6113
An Empirical Evaluation Of The State Of Art
Feature Selection Methods For Text
Categorization
Ananya Gupta, Shahin Ara Begum
Abstract : Feature selection methods select a small subset of the relevant features from the original feature space by eliminating redundant or irrelevant features. In the process it also reduces the dimensionality of the feature space and improves the efficiency of the data mining algorithms. In this paper, sixteen state of art feature selection methods are studied that use different benchmark datasets with respect to text categorization and their performance is summarized. The past research reveals that performance of feature selection methods are dataset specific. In the present work, further experiments are carried out with the state of art feature selection methods for text categorization over a unifying framework of benchmark datasets to evaluate and compare their performance on same standards. The efficiency of the methods is evaluated on the basis of their performance with k-means clustering and KNN classification. The experiments reveal that unsupervised feature selection method of Multi-Cluster Feature Selection (MCFS) performs the best in comparison to the state of art feature selection methods studied in the present work. MCFS reduces the data dimensionality to an extent of 95% on an average on the considered datasets with acceptable results of classification and clustering.
Index Terms : Classification, Clustering, Dimensionality reduction, Feature selection, Predictive accuracy, Text categorization, Text datasets.
—————————— ——————————
1.
INTRODUCTION
Technological advances have led to data explosion both in perspective of dimensionality and size of samples. Various machine learning applications pertaining to text mining, biomedical field and computer vision have been confronted with the problem of high dimensionality of the data. With the rapid growth of database technologies, data mining from databases and machine learning are gaining increasing popularity. Knowledge acquisition has become very important to study these large-scale datasets. The main challenge in handling these large-scale datasets is their problem of high dimensionality. The problem of dimensionality has imposed a very big challenge towards the efficiency of the machine learning algorithms. The machine learning algorithms cannot handle these high dimensional data which in turn makes the machine learning tasks intractable. Thus, it becomes necessary to reduce the dimensionality of the data.
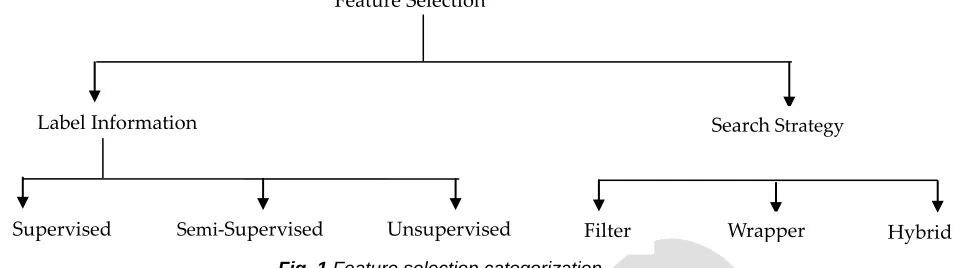
Feature selection is such a method of dimensionality reduction, wherein small subsets of features that are relevant are chosen. . It not only removes the irrelevant and redundant features but also reduces the computational cost and improves predictive capability. Feature selection is broadly guided by two aspects: 1) label information 2) search strategy (Fig. 1). Feature selection methods can be categorized into three types on the basis of labeled information. They are: supervised feature selection [1], [2], [3], [4] semi-supervised feature selection [5], [6], [7], and unsupervised feature selection [8], [9], [10], [11], 12]. Supervised methods are those that are guided by the presence of labeled information. Studies on supervised methods can be found in [3], [13]. Semi-supervised methods are employed when a small portion of the data is labeled. Most of the semi-supervised methods are graph based learning methods that rely on similarity matrix [5], [14]. Unsupervised methods are used when datasets are devoid of
labels. The absence of labels in unsupervised methods makes feature selection a much harder task [9]. Based on search strategy, feature selection can be of three types – the filter method, wrapper method and the hybrid method. The filter method is based on rank and scores of the features based on certain statistical criterion. The features with top score are considered to be the potential features for the target concept. Filter methods are fast, but they lack in robustness in terms of multi-way feature interactions. Another crucial aspect of filter methods is the selection of the cutoff points while selecting the discriminative features (i.e. the value of the cut off score of ranking). Frequently used filter methods include t-test [15], chi-square test [16], Wilcoxon Mann–Whitney test (17), mutual information [18], and principal component analysis [19]. Filter components do not involve any mining algorithm. In the wrapper approach, a pre-determined mining algorithm is used to evaluate the quality of feature subset. It searches for features that are suitable for the mining algorithm. The learning algorithm is applied on the subset of features and tested on a hold-out set or the test data and its prediction accuracy is used to determine the quality of the feature subset. Usually, wrappers are more effective than filter methods, although they are computationally more expensive than the filter methods [20], [21]. In hybrid methods, initially the filter approach is applied to select a feature pool and then the wrapper method is implemented on the feature pool to select an optimal subset of features.
————————————————
Ananya Gupta is currently pursuing Ph.d degree program in
Computer Science in Assam University, India. E-mail: gupta. [email protected]
Shahin Ara Begum, Associate Professor in the Dept. Computer
Science, Assam University, India. E-mail:
6114
Fig. 1 Feature selection categorization
The rest of the paper is outlined as follows: Section 2 describes feature selection process, Section 3 describes state of art feature selection methods, Section 4 describes experimental setup to evaluate the state of art methods over three bench mark datasets to evaluate the feature selection methods on the same standards of the considered datasets and Section 5 concludes the paper.
2 FEATURE SELECTION PROCESS
A feature selection process typically comprises of four stages: generation of subset, evaluation of subset, stopping criterion to stop the iterative process of subset generation and validation of the results.
2.1 Subset Generation
The subset generation procedure generates the candidate feature subset. Each state in the search space is a candidate set for evaluation. Two issues that are of utmost importance in this stage are the search starting points and the search strategy. Search can be a forward search, or backward search, or can be both forward or backward simultaneously. Search may also begin with a random subset to avoid being trapped in local optima [22]. Search strategies can be complete, sequential or random depending on the cardinality of the set.
2.2 Subset Evaluation
An evaluation function measures the goodness of a subset produced using some criterion function. The value obtained by the function is compared with the previous best value. If it is found to be better than the previous one, then it replaces it. Evaluation functions can be independent or dependent on the basis of the dependency criterion of the mining algorithms [23], [24]. The former is used mainly in filter models. It utilizes the intrinsic properties of the data such as the information measure, distance measure, dependency measure, and the consistency measure [25], [26], [27], [28], [29]. The dependent criterion of evaluation is used in case of wrapper methods. If the predictive accuracy of the mining algorithm is high, then the feature subset consists of features that are better suited for the algorithm. Thus, this evaluation measure is dependent on the selected features. Classifier error rate is one such dependent evaluation measure [30].
2.3 Stopping Criterion
Stopping criterion is necessary for feature selection process, otherwise it may run exhaustively or forever through the space of subsets. Generation process and evaluation functions can influence the choice for a stopping criterion. Stopping criteria of a generation process include whether a predefined number
of features are selected, and whether a predefined number of iterations are reached. Stopping criteria of an evaluation function may be attributed to two conditions 1) whether further addition (or deletion) of features does not produce a better subset than the previous and 2) whether an optimal subset is already obtained using some evaluation function
2.4 Validation
In this stage, validation of the results is done either using the synthetic or real-world data sets. In case of synthetic datasets, prior knowledge about the relevant features aids in validation of the actual results obtained. However, in case of real-world datasets, prior knowledge is unknown and thus, some indirect measures are employed [31].
2.5 Factors affecting the choice of feature selection algorithms
The choice of feature selection method for a specific task has always been a dilemma, given a large number of available algorithms. A complete account of the factors that guide the choice of feature selection method can be found in [32]. Primarily the data mining task, namely classification or clustering needs to be ascertained. Evaluation criterion is affected by the choice of the mining task. Search strategy is purpose specific. Additional information on knowledge and data factors play key role in resolving the choice of suitable algorithms. The knowledge factor can be further categorized into purpose of feature selection, time concerned, expected output type and the ratio of relevant features to irrelevant features. The data factor comprises of class information, feature type, quality of data and the ratio between total number of features and the number of instances.
3 FEATURE SELECTION METHODS
Research over the years has led to availability of extensive feature selection methods. In this paper, we restrict the discussion on some feature selection methods for text categorization. Some state of art selection methods for text categorization is briefly stated here in the section.
(i) Information Gain (IG)
IG is a commonly adopted method used for feature selection. This criterion is used to ascertain the goodness of the term in field of machine learning [33], [34], [35]. Let the global probability of the class be . is the probability of the class considering term is in the document. is the global fraction of documents containing . Information gain
for a term is
Feature Selection
Label Information Search Strategy
6115
1 1 1lo g . . lo g
(1 ( ) ) . (1 ) (1 ( ) )
i
i i i
k i k k i i i
I t P P t p t p t
F t p t l o g p t
(1)Greater the value of greater is the discriminatory power of . The terms which are below a predefined threshold value of
are removed.
(ii) Mutual Information (MI)
MI is derived from information theory and it gives the mutual information between classes and features. Mutual information ( between term and class is the co-occurrence of term and class . Mutual information is given by
. lo g . i i iF t p t
M t
F t P
(2)
when is correlated positively to and when is negatively correlated to . The value of if and are independent. Mutual Information suffers from the drawback that it is influenced by marginal probabilities [35].
(iii) statistics (CHI)
CHI[35] computes the dependence between the class and term Let be the total number of documents in the corpus, is the conditional probability that class contains the term and is the global fraction of documents which contain The statistics is given by
2 2
2 . .
. 1 . 1
i i i
i i
n F t p t P
t
F t F t P P
(3)
statistics is the normalized measure and is advantageous than mutual information. Terms belonging to the same category can be easily measured using statistics. However, it is not a reliable measure for low frequency terms [36].
(iv) Term Strength (TS)
TS was used by Yang and Wilbur in text categorization [35], [37].The term importance is measured on how frequently the term is probable to appear in closely related documents. Term strength is calculated based on the conditional probability that the term occurring in the second half of the pair of related document appears in the first half. Let and be two arbitrary pairs of distinct but related documents. Then the term strength of the term is given by
s t( ) Pr(t y |t x) (4)
(v) Document Frequency (DF)
DF gives the frequency of documents in which a term occurs [35]. The document frequency for each term is calculated and the terms below a predefined limit are removed considering them to be non-informative terms. It is the simplest method of feature selection and its computational complexity is approximately linear to the number of training documents.
(vi) Entropy-based Ranking
The approach of entropy-based ranking was proposed in [38]. The nature of the term is measured by reduction in entropy on removal of the term. The entropy of a term is given by:
1 1
( ) ( j. ( j) (1 i j) . (1 j) )
n n
i i i
i j
E t S l o g S S l o g S
(5)
where, is the similarity between the and the document and (0,1). is defined as
, ln 0 .5
,
i j
d is t ij
d i s t
S e
(6)
is the distance between the terms and and is the average distance in between the documents after the removal of term . The computation of for each term requires ) operations.
(vii) Fast Clustering Based Feature Selection Algorithm (FAST) Song, Qinbao et al. [39] proposed a feature selection algorithm FAST for high dimensional dataset. It eliminates irrelevant features by calculating the T-Relevance value of each feature, and retains the relevant features which are greater than the pre-defined threshold value. A weighted complete graph is constructed by calculating the F-Correlation value between the pair of features and setting it as the weight of the edges between the vertices (features). The complete graph represents the correlations between the target-relevant features.
(viii) Probability based Term Weighting Features Selection The distribution of text data is often imbalanced. Classifiers corresponding to categories with fewer instances do not perform well. This method handles the data imbalance problem using probability based term weighting feature selection method for categorization of documents belonging to minor categories. This method replaces the idf factor of the tf-idf weighting scheme [40] [41] [42]. The tf-idf term is replaced by feature value. The feature value utilizes two critical information ratios to compute the terms weight. The two ratios give the most informative information on the term’s strength to its corresponding category. The weighting scheme is formulated as:
t f. lo g 1 A. A
B C (7)
where, denotes the number of documents belonging to category where the term occurs at least once; denotes the number of documents not belonging to category where the term occurs at least once; denotes the number of documents belonging to category where the term does not occur. A B and A C are the relevance ratios of the terms. A B gives the relevance ratio of the term if it is related to category only. Given two terms, , and category , A C the term with a higher value of will be the better feature to represent .
(ix) Orthogonal Centroid Feature Selection
6116 objective function according to orthogonal centroid algorithm
[45] [46] [47]. The centroids of the class and the training samples are calculated. Subsequently, the score of the term is calculated based on the centroid of each class and the training set. The higher is the term score, more is its category information. The term score of the term is given by:
2
0
( ) ( )
c
j k k
k j
j
n
O C F S t m m
n
(8)where, is the number of documents in the category , is the total number of documents in the training set, is the element of the vector of the category , is the element of the centroid vector of the entire training set and | | is the total number of categories in the corpus.
(x) Comprehensively Measure Feature Selection (CMFS) Comprehensively Measure Feature Selection (CMFS) was proposed in [47]. It measures the discrepancy of a term both within the category and across the category. CMFS is defined for a term and category as follows
, 1 ,
, .
,
k i k i k i
k i
tf t c tf t c
C M F S t c
tf t C tf t c V
2 , 1 , k i k it f t c
t f t C t f t c V
(9)
where, is the term frequency of the term in category , is the term frequency of the term in the whole training set, is the sum of the term frequencies of all terms in , is the number of total categories and is the number of total terms in the feature space.
(xi) Distinguishing Feature Selector
Distinguishing Feature Selector[48], [49] is based on the assumptions: that term frequently occurring within a single class and not occurring in the other classes is a discriminative term and thus it must be assigned a high score, a term that rarely occurs within a class is irrelevant and therefore it is assigned a low score ,a term frequently occurring in all classes is irrelevant and is assigned low score and term appearing in some of the classes is relatively distinctive and it is given a relatively high score. It is formulated as:
1
( | )
( ) | 1
M i
i
i i
P C t
D F S t
P t C P t C
(10)is the number of classes, is the conditional probability of class given term , is the conditional probability of the absence of term given class and is the conditional probability of term given the classes other than
(xii) Mutual information based feature selection MIFS-ND MIFS-ND is a greedy feature selection method based on mutual information [50]. The optimal feature subset is obtained on the basis of feature mutual information and feature-class mutual information combined.
(xiii) Gini Index
A novel Gini Index algorithm was proposed [51]. The underlying principle of this method is based on the concept of Gini-Index theory towards text feature selection. Let , ,…, be the conditional probabilities that a document belongs to class considering that the term is in it. Thus, Gini Index of the term , given by
21
k i
i
G t P t
(11)
range from (1 k, 1). Greater the value of , better is the discriminative power of the term. The skewness present in the global class distribution at the start may interfere with accuracy in estimating the discriminative power of the underlying attributes.
(xiv) Complete Gini-Index Text (GIT) Feature Selection
Park et al. [52] reported that the feature selection method in [51] was not adequate to select the discriminative features. They proposed a new complete Gini Index Text (GIT) feature selection method that has the ability to obtain unbiased feature values. In the process it eliminates many redundant features from feature subsets while retaining the discriminative features. This new algorithm compared to the original version, demonstrates an overall noteworthy improved performance with respect to classification.
(xv) Multi-Cluster Feature Selection (MCFS)
Cai et al in [53] proposed a multi- cluster feature selection (MCFS) method which is capable to select the set of features that can cover all the possible clustering in the data. It uses the spectral analysis to measure the correlation between different features in an unsupervised domain. The top eigenvectors of graph Laplacian and spectral clustering cluster data samples. MCFS use the k-Nearest-Neighbors approach to construct the graph of the data, where k is predetermined. The weighting matrix is calculated as follows:
2 i j x x ij e W (12)
where, and are connected data points in the k nearest neighbor graph and is a predefined parameter. A degree
matrix is computed from which the graph
Laplacian is computed. The eigen problem is solved to capture the multi-cluster structure of the data. The relevant subset of features is obtained by minimizing the objective function
2 m in k T k k a
y X a
(13)
6117 comparable performance with Laplacian Score.
(xvi) Term Frequency-Inverse Document Frequency (Tf-Idf) Tf-Idf [41], [54] was proposed with a heuristic perception that query terms occurring across many documents are not good discriminators and should not be considered as discriminative terms. They should be assigned less weight than those occurring across few documents. Term frequency (Tf) represents the frequency of the term occurring in the document whereas Inverse Document Frequency (Idf) gives the inverse measure of the number of documents to which the term is assigned [55]. To express the significance of textual data, it is expressed as the product of Tf and Idf. Tf-Idf is given by
i j i j lo g
i
N
w t f
d f
(14)
where, wi j is the weight of the term in document j, N is the number of documents in the collection, t fi jis the frequency of the term i in document j and d fi is the frequency of the document containing the term i in the collection. Tf-Idf is an estimate of the relevance of the term to the document [55]. A term occurring in many documents will have low Tf-Idf values than those appearing relatively fewer across the documents.
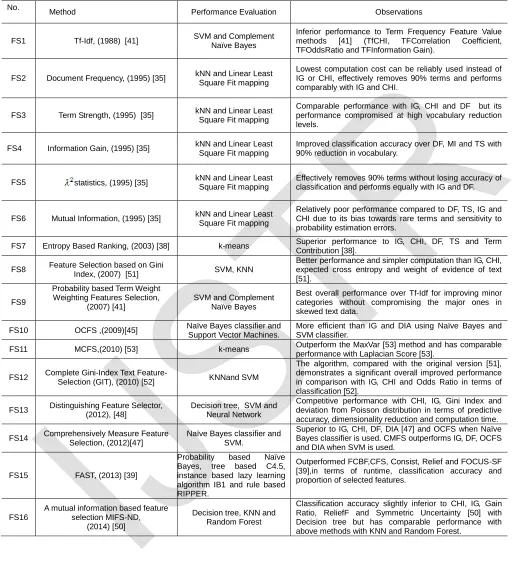
The methods in this section are summarized in Table 1 (at the end of paper) with respect to their performance.
4 EXPERIMENTAL SETUP
Research in the past reveal that the predictive accuracy of feature selection methods are dataset driven The results summarized in Table 1 are obtained from different text datasets. The merits and demerits of the state of art methods in Table 1 are assessed on different standard or adhoc datasets. In order to evaluate different feature selection methods on a common standard, experiments are performed on three benchmark text datasets - the Reuters-21578, 20 Newsgroups and TDT2 datasets to compare the results in a unifying framework of datasets. In the study, feature selection is evaluated in terms of the performance of k-means clustering and KNN classifier.
4.1 Data Sets
Past research works [35], reveal that text categorization performance varies with different dataset. Therefore, three different text datasets are used to evaluate text clustering and classification performance on three standard datasets: Reuters-21578, 20 Newsgroups and TDT2 datasets. In all the three datasets, multi-label documents are discarded. Dataset properties are described in Table 2 at the end of the paper.
4.2 Evaluation Metrics
The performance of clustering and classification is evaluated with standard measures of accuracy, F-Measure and Normalized Mutual Information [53].
A c c u r a c y T P T N
T P T N F P F N
P r e c i s i o n T P
T P F P
R e c a ll T P
T P F N
F M e a s u r e 2 P r e c is io n R e c a ll.
P r e c is io n R e c a ll
, ,
T P F P T N and F N are the number of true positives, false
positives, true negatives and false negatives respectively.
Normalized Mutual Information M I is given by:
,
m a x ,
M I C C M I
H C H C
where, C and C' denote the set of clusters obtained from the ground truth and labels after clustering respectively.
( )
H C and H C( ') are entropies of C and C'respectively. Their mutual information is given by
'
2
, '
,
, ( , ' ) lo g
. '
i j
i j i j
c C c C i j
P C C
M I C C P C C
P C P C
where, P C( i)and P C( 'j) are probabilities that documents are selected arbitrarily from the corpus belongs to Ci and
'
j
C respectively. P C( i,C ' )j are joint probabilities that the selected documents belongs to both the clusters at the same time. Normalized Mutual Information ranges from 0 to 1.
4.3 Experiment Results
6118 reason for competitive advantage of FS11-the MCFS feature
selection method over other methods is its capacity to capture the correlation amongst the features, unlike the other methods that simply rank the features using scores independent of each other. As is observed FS11 has the highest predictive accuracy, the dimensionality reduction produced by it is studied herewith. Table 8 (at the end of paper) shows dimensionality reduction of 96% on Reuters-21578, 99% on 20 NG dataset and 97% on TDT2 dataset with k-means clustering. Table 9 (at the end of paper) shows that Reuters-21578 dataset has a dimensionality reduction of about 92%, while 20NG approximately has a reduction of 99% and TDT2 has dimensionality reduction of 96%with KNN classifier.
5 CONCLUSIONS
6119
Table 1. Feature selection methods in text categorization
No.
Method Performance Evaluation Observations
FS1 Tf-Idf, (1988) [41] SVM and Complement Naïve Bayes
Inferior performance to Term Frequency Feature Value methods [41] (TfCHI, TFCorrelation Coefficient, TFOddsRatio and TFInformation Gain).
FS2 Document Frequency, (1995) [35] kNN and Linear Least Square Fit mapping
Lowest computation cost can be reliably used instead of IG or CHI, effectively removes 90% terms and performs comparably with IG and CHI.
FS3 Term Strength, (1995) [35] kNN and Linear Least Square Fit mapping
Comparable performance with IG, CHI and DF but its performance compromised at high vocabulary reduction levels.
FS4 Information Gain, (1995) [35] kNN and Linear Least Square Fit mapping
Improved classification accuracy over DF, MI and TS with 90% reduction in vocabulary.
FS5 statistics, (1995) [35] kNN and Linear Least Square Fit mapping
Effectively removes 90% terms without losing accuracy of classification and performs equally with IG and DF.
FS6 Mutual Information, (1995) [35] kNN and Linear Least Square Fit mapping
Relatively poor performance compared to DF, TS, IG and CHI due to its bias towards rare terms and sensitivity to probability estimation errors.
FS7 Entropy Based Ranking, (2003) [38] k-means Superior performance to IG, CHI, DF, TS and Term Contribution [38].
FS8 Feature Selection based on Gini
Index, (2007) [51] SVM, KNN
Better performance and simpler computation than IG, CHI, expected cross entropy and weight of evidence of text [51].
FS9
Probability based Term Weight Weighting Features Selection,
(2007) [41]
SVM and Complement Naïve Bayes
Best overall performance over Tf-Idf for improving minor categories without compromising the major ones in skewed text data.
FS10 OCFS ,(2009)[45] Naïve Bayes classifier and Support Vector Machines.
More efficient than IG and DIA using Naïve Bayes and SVM classifier.
FS11 MCFS,(2010) [53] k-means Outperform the MaxVar [53] method and has comparable performance with Laplacian Score [53].
FS12 Complete Gini-Index Text
Feature-Selection (GIT), (2010) [52] KNNand SVM
The algorithm, compared with the original version [51], demonstrates a significant overall improved performance in comparison with IG, CHI and Odds Ratio in terms of classification [52].
FS13 Distinguishing Feature Selector, (2012), [48]
Decision tree, SVM and Neural Network
Competitive performance with CHI, IG, Gini Index and deviation from Poisson distribution in terms of predictive accuracy, dimensionality reduction and computation time. FS14 Comprehensively Measure Feature
Selection, (2012)[47]
Naïve Bayes classifier and SVM.
Superior to IG, CHI, DF, DIA [47] and OCFS when Naïve Bayes classifier is used. CMFS outperforms IG, DF, OCFS and DIA when SVM is used.
FS15 FAST, (2013) [39]
Probability based Naïve Bayes, tree based C4.5, instance based lazy learning algorithm IB1 and rule based RIPPER.
Outperformed FCBF,CFS, Consist, Relief and FOCUS-SF [39],in terms of runtime, classification accuracy and proportion of selected features.
FS16
A mutual information based feature selection MIFS-ND,
(2014) [50]
Decision tree, KNN and Random Forest
6120
Table 2 Dataset Properties
Datasets No. of
Class
No. of Instances No. of Terms
REUTERS 80 10733 18484
20NG 20 18828 91652
TDT2 30 9394 36771
Table 3Accuracy results obtained from different feature selection methods with k-means clustering
Table 4 F-Measure results obtained from different feature selection methods with k-means clustering
Table 5 NMI results obtained from different feature selection methods with k-means clustering
Table 6 Accuracy results obtained from different feature selection methods with KNN classifier
Table 7 F-Measure results obtained from different feature selection methods with kNN classifier
Table 8 Clustering performance with number of features with MCFS and k-means clustering
Table 9 Classification performance with number of features with MCFS and KNN classifier
REFERENCES
[1] L. Wolf and A. Shashua, ―Feature selection for unsupervised and supervised inference: The emergence of sparsity in a weight-based approach,‖ The Journal of Machine Learning Research, vol 6, pp.
1855–1887, 2005.
[2] Z. Zhao and H. Liu, ―Spectral feature selection for supervised and unsupervised learning‖, Proceedings of the 24th international conference on Machine learning, ACM, pp. 1151–1157, 2007.
[3] F. Nie, H. Huang, X. Cai, C.H. Ding, ―Efficient and robust
feature selection via joint L2, 1-norms minimization,‖ in: Advances in neural information processing systems, pp. 1813–1821, 2010.
[4] J. Li, Z. Chen, L.Wei, W. Xu, G.. Kou, ―Feature selection via least squares support feature machine,‖ International Journal of Information Technology & Decision Making, vol. 6, no. 04, pp. 671–686, 2007.
[5] Z. Zhao and H. Liu, ―Semi-supervised feature selection via spectral analysis,‖ in: SDM, SIAM, pp. 641–646, 2007. [6] Z. Xu, I. King, M.R.T. Lyu, R. Jin, ―Discriminative
semi-supervised feature selection via manifold regularization,‖ IEEE Transactions on Neural Networks, vol. 21, no.7, pp. Dataset FS1 FS2 FS3 FS4 FS5 FS6 FS7 FS8 FS9 FS10 FS11 FS12 FS13 FS14 FS15 FS16 Reuters 78.87 77.76 60.56 65.87 74.03 65.29 65.29 71.56 69.09 68.77 81.22 69.28 70.84 70.15 69.01 74.01 20NG 79.26 78.22 67.14 63.35 72.91 60.32 63.57 72.28 71.19 66.72 82.14 72.44 68.58 72.61 73.19 76.27 TDT2 73.34 67.79 65.67 64.49 68.81 59.17 67.56 69.34 69.91 68.72 75.93 70.54 66.26 70.11 69.03 70.71
Dataset FS1 FS2 FS3 FS4 FS5 FS6 FS7 FS8 FS9 FS10 FS11 FS12 FS13 FS14 FS15 FS16 Reuters 79.19 70.27 69.37 68.65 75.04 60.11 67.87 72.02 75.39 70.38 83.13 70.51 67.57 70.38 72.36 75.37 20NG 80.72 79.41 68.54 64.57 72.71 63.55 66.21 73.67 71.78 74.12 86.84 73.44 73.27 63.41 71.67 76.75 TDT2 69.05 64.33 66.72 62.08 66.29 56.66 62.62 64.35 60.49 64.76 74.83 67.22 65.76 61.59 67.26 62.11
Dataset FS1 FS2 FS3 FS4 FS5 FS6 FS7 FS8 FS9 FS10 FS11 FS12 FS13 FS14 FS15 FS16 Reuters 73.62 67.17 60.56 64.56 72.89 50.34 64.66 68.21 70.39 67.29 75.84 67.79 68.10 69.74 65.41 62.30 20NG 70.65 66.76 65.81 65.72 69.82 62.41 64.13 67.78 66.17 67.76 72.84 64.47 67.74 69.53 65.77 69.95 TDT2 72.77 68.75 64.13 67.20 66.47 67.58 68.79 60.16 65.75 64.61 74.77 68.32 64.55 63.39 65.01 64,68
Dataset FS1 FS2 FS3 FS4 FS5 FS6 FS7 FS8 FS9 FS10 FS11 FS12 FS13 FS14 FS15 FS16 Reuters 79.66 75.77 62.44 65.87 75.38 63.29 66.46 74.78 74.39 68.33 83.74 70.84 74.22 71.56 67.39 77.81 20NG 78.19 70.45 65.69 64.57 76.19 60.54 60.48 74.62 73.18 65.76 82.97 71.20 75.68 70.86 68.03 76.52 TDT2 76.44 74.76 66.81 69.28 65.58 64.01 67.87 69.09 70.86 69.77 80.19 72.31 70.44 69.57 67.68 70.87
Dataset FS1 FS2 FS3 FS4 FS5 FS6 FS7 FS8 FS9 FS10 FS11 FS12 FS13 FS14 FS15 FS16 Reuters 78.39 77.21 64.42 67.68 73.52 62.28 68.29 75.62 75.22 69.78 80.47 72.28 75.23 72.19 70.34 75.66 20NG 75.38 71.11 67.78 66.87 75.20 64.63 66.76 75.29 75.73 68.61 80.49 73.58 73.86 72.43 71.59 76.32 TDT2 74.38 72.40 68.84 70.09 67.68 64.33 68.54 70.81 72.08 72.36 78.54 70.04 71.77 70.61 72.60 72.24
Dataset 500 600 700 800 900 1000 1100 1200 1300 1400 1500
Reuters 65.51 70.22 77.71 81.29 81.18 81.01 81.66 81.34 81.27 81.52 81.32 20NG 70.45 75.71 82.20 82.31 82.02 82.67 82.43 82.39 82.19 82.35 82.66 TDT2 68.18 70.56 71.21 71.67 72.09 72.48 72.68 73.67 73.89 75.83 75.85
Dataset 500 600 700 800 900 1000 1100 1200 1300 1400 1500
6121 1033–1047, 2010.
[7] P. Wang, Y. Li, B. Chen, X. Hu, J. Yan, Y. Xia, J. Yang, ―Proportional hybrid mechanism for population based feature selection algorithm,‖ International Journal of Information Technology & Decision Making, pp. 1–30, 2013.
[8] D. Cai, C. Zhang, X. He, ‖Unsupervised feature selection for multi-cluster data,‖ in: Proceedings of the 16th ACMSIGKDD international conference on Knowledge discovery and data mining, ACM, pp. 333–342, 2010. [9] J.G. Dy and C.E. Brodley, ―Feature selection for
unsupervised learning,‖ The Journal of Machine Learning Research, vol. 5, pp. 845–889, 2004.
[10] Y. Yang, H. T. Shen, Z. Ma, Z. Huang, X. Zhou, ― l2, 1-norm regularized discriminative feature selection for unsupervised learning,‖ in: IJCAI Proceedings-International Joint Conference on Artificial Intelligence, vol. 22, pp. 1589, Citeseer, 2011.
[11]E.R. Hruschka, E.R. Hruschka Jr, T.F. Cov˜oes, N.F. Ebecken, ―Bayesian feature selection for clustering problems,‖ Journal of Information & Knowledge Management, vol. 5, no.04, pp. 315–327, 2006.
[12]R. Liu, R. Rallo, Y. Cohen, ―Unsupervised feature selection using incremental least squares,‖ International Journal of Information Technology & Decision Making, vol.10, no.06, pp. 967–987, 2011.
[13]B. Krishnapuram, A. Harternink, L. Carin, M.A. Figueiredo, ―A bayesian approach to joint feature selection and classifier design,‖ IEEE Transactions on Pattern Analysis and Machine Intelligence, vol. 26, no. 9, pp.1105–1111, 2004.
[14]Q. Cheng, H. Zhou, J. Cheng, ―The fisher-markov selector: fast selecting maximally separable feature subset for multiclass classification with applications to high-dimensional data,‖ Pattern Analysis and Machine Intelligence, vol. 33, no. 6, pp.1217–1233, 2011. (IEEE Transactions)
[15]J. Hua, W. Tembe, E.R. Dougherty, ―Feature selection in the classification of high- dimension data,‖ in: IEEE International Workshop on Genomic Signal Processing and Statistics, pp. 1–2, 2008.
[16]X.Jin, A. Xu, R. Bie, P. Guo, ―Machine learning techniques and chi-square feature selection for cancer classification using SAGE gene expression profiles,‖ Lecture Notes in Computer Science, vol. 3916, pp. 106–115, 2006.
[17]C. Liao, S. Li, Z. Luo, ―Gene selection using Wilcoxon rank sum test and support vector machine for cancer‖, Lecture Notes in Computer Science, vol. 4456, pp. 5729 – 66, 2007.
[18]Hanchuan Peng, Fuhui Long, and Chris Ding, ―Feature selection based on mutual information criteria of max-dependency, max-relevance, and min-redundancy,‖ IEEE TPAMI, vol. 27, no. 8, pp. 1226–1238, 2005.
[19]L. Rocchi, L. Chiari, A. Cappello, ―Feature selection of stabilometric parameters based on principal component analysis,‖ Medical and Biological Engineering and Computing, vol.42, pp. 71–79, 2004.
[20]R. Kohavi and G.H. John, ―Wrappers for Feature Subset Selection,‖ Artificial Intelligence, vol. 97, no. 1-2, pp. 273-324, 1997.
[21]P. Langley, ―Selection of Relevant Features in Machine Learning,‖ Proc. AAAI Fall Symp. Relevance, pp.140-144, 1994.
[22] J. Doak, ―An Evaluation of Feature Selection Methods and Their Application to Computer Security,‖ Tech. Rep. Univ. of California at Davis, Dept. Computer Science, 1992..
[23] G. Brassard and P. Bratley, Fundamentals of Algorithms, New Jersey: Prentice Hall, 1996.
[24] M.A. Hall, ―Correlation-Based Feature Selection for Discrete and Numeric Class Machine Learning,‖ in Proc. of 17th Int’l Conf. Machine Learning, pp. 359-366, 1994. [25]I. Kononenko, ―Estimating attributes: Analysis and
extension of RELIEF, ― in Proc. Of European Conference on Machine Learning, Catania, Italy, pp.171–182, 1994. [26] D.A. Bell and H. Wang, ―A formalism for relevance and its
application in feature subset selection,‖ Machine Learning, vol. 41, pp. 175–195, 2000.
[27]D. Koller and M. Sahami, ―Toward optimal feature selection,‖ in Proc. of International Conference on Machine Learning, Bari, Italy, pp. 284–292, 1996.
[28]H. Liu, R. Setiono, ―A probabilistic approach to feature selection—A filter solution,‖ in: Proc. of International Conference on Machine Learning, Bari, Italy, pp. 319–327, 1996 .
[29]C. Cardie, ―Using decision trees to improve case-based learning,‖ in Proc. of 10th
Int’l Conf. on Machine Learning, Amherst, MA, pp. 25–32, 1993.
[30]G..H. John, R. Kohavi, K. Pfleger, ―Irrelevant Feature and the Subset Selection Problem,‖ in Proc. of 11th Int’l Conf. Machine Learning, 121-129, 1994.
[31] I.H. Witten and E. Frank, ―Data Mining-Pracitcal Machine Learning Tools and Techniques with JAVA Implementations,‖ Morgan Kaufmann, 2000.
[32]Huan Liu and Lei Yu, Toward Integrating Feature Selection Algorithms for Classification and Clustering, IEEE Transactions on Knowledge and Data Engineering, vol. 17, no. 4, 2005.
[33] Quinlan, J. Ross, ―Induction of decision trees,‖ Machine learning, vol. 1, no. 1, pp. 81-106, 1986.
[34] Tom Mitchell, Machine Learning, McCraw Hill, 1996. [35]Y. Yang, J. O. Pederson, ―A comparative study on feature
selection in text categorization,‖ ACM SIGIR Conference 1995.
[36]T. E. Dunning, ―Accurate methods for the statistics of surprise and coincidence,‖ In Computational Linguistics, vol. 19, no.1, pp. 61-74, 1993.
[37] Y. Yang and W.J Wilbur, ―Using corpus statistics to remove redundant words in text categorization,‖ In J Amer Soc
Inf Sci 1996.
[38] T. Liu, S. Liu, Z. Chen., W. Y. Ma, ―An evaluation on
feature selection for text clustering‖.In Proceedings of the 20th international conference on machine learning (ICML-03) pp. 488-495, 2003.
[39] Song, Qinbao, Jingjie Ni, Guangtao Wang, ―A fast clustering-based
feature subset selection algorithm for high-dimensional data,‖ IEEE
transactions on knowledge and data engineering, vol. 25, no.1, pp. 1-14,
2013.
[40] R. Baeza-Yates and B. Rebeiro-Neto, Modern Information Retrieval.
Boston, MA, USA: Addison-Wesley.
6122
text retrieval,‖ Information Processing and Management, vol. 24, no. (5),
pp. 513-523, 1998.
[42] G. Salton and M.J. McGill, Introduction to modern information
retrieval. New York. USA: McGraw-Hill, 1983.
[43] Changki Lee and Gary Geunbae Lee, ―Information gain and
divergence-based feature selection for machine learning-based text
categorization,‖ Information processing and management, vol. 42, no.1,
pp. 155-165, 2006.
[44] J. Carbonell and J. Goldstein, ―The use of MMR, diversity-based
reranking for reordering documents and producing summaries.‖ In
Proceedings of 21st ACM-SIGIR International Conference on Research
Development in Information Retrieval, 1998.
[45] J. Yan, N. Liu, B. Zhang, S. Yan, Z. Chen, Q.Cheng, W. Fan and W.Y.Ma, ―OCFS: optimal orthogonal centroid feature selection for text categorization,‖ In Proceedings of the 28th annual international ACM SIGIR conference on Research and development in information retrieval, ACM, pp. 122-129. 2005.
[46] S.S.R. Mengle and N. Goharian, ―Ambiguity measure feature-selection algorithm,‖ Journal of the American Society for Information Science and Technology, vol. 60, pp. 1037-1050, (2009).
[47] J. Yang, Y. Liu, X. Zhu, Z.Liu and X. Zhang, ― A new feature selection based on comprehensive measurement both in inter-category and intra-category for text categorization,‖ Information Processing and Management, vol. 48, pp 741-754, 2012.
[48] Uysal, AlperKursat, and Serkan Gunal. "A novel probabilistic feature selection method for text classification." Knowledge-Based Systems, vol. 36, pp. 226-235, 2012.
[49] F.P.Shah,, Vibha Patel, "A review on feature selection and feature extraction for text classification." In 2016 International Conference on Wireless Communications, Signal Processing and Networking (WiSPNET), pp. 2264-2268. IEEE, 2016.
[50] Hoque, Nazrul, Dhruba K. Bhattacharyya, and Jugal K. Kalita, "MIFS-ND: A mutual information-based feature selection method." Expert Systems with Applications, vol. 41, no. 14 pp. 6371-6385, 2014.
[51] W .Shang, H. Huang, H. Zhu, Y. Lin, Y. Qu, and Z. Wang, ― A novel feature selection algorithm for text categorization,‖ Expert Systems with Applications, vol. 33, no. 1, pp. 1-5, 2014.
[52] H. Park, S. Kwon, H.C. Kwon, ―Complete gini-index text (git) feature-selection algorithm for text classification,‖ In The 2nd International Conference on Software Engineering and Data Mining, pp. 366-371, IEEE, 2010, June.
[53] D. Cai, C. Zhang, X. He, ―Unsupervised feature selection for multi-cluster data,‖ in: Proceedings of the 16th
ACMSIGKDD international conference on Knowledge discovery and data mining, ACM , pp. 333–342, 2010 .
[54] D.L. Lee, H. Chuang, K. Seamons, ― Document Ranking and Vector Space Models,‖ IEEE software, vol. 14, no.2, pp. 67- 75. 1997.