Licensed under Creative Common Page 96
http://ijecm.co.uk/
ISSN 2348 0386
FDI AND ECONOMIC GROWTH IN MACEDONIA
AN EMPIRICAL INVESTIGATION
Esmeralda Shehaj
Department of Economics, Faculty of Economics, University of Tirana, Albania
smeraldis@yahoo.com
Sulo Haderi
Department of Economics, Faculty of Economics, University of Tirana, Albania
Abstract
This paper explores the relationship between foreign direct investments (FDI) and the economic
development of Macedonia. It examines whether FDI has played a positive role in the economic
development, or whether levels of the economic development of the country have encouraged
FDI inflows. The study uses World Bank data on the FDI and the economic growth of
Macedonia over the period 1997 – 2009. Besides the bivariate analysis on the relationship
between these two variables, the analysis was enriched with other factors, in order to study the
links in a multivariate context. The additional variables include imports and exports, as well as
measures of human capital of the recipient country, theoretically expected to be related to both
FDI and the economic growth. The empirical evidence is drawn by using VAR and the Granger
causality tests. The study provides significant insights on the factors affecting FDI, thereby
fostering the policy making process by recommending evidence-based policies for the economic
development of the country and the attraction of FDI flows.
Keywords: FDI, Economic Growth, VAR, Granger causality, imports, exports, human capital
INTRODUCTION
The economic reforms in Macedonia have been moving steadily forward, but several
phenomena have negatively affected the economic growth of the country. These include
corruption, lack of finance and an unclear regulatory environment, which in addition have also
negatively influenced the inflow of foreign direct investments and resulted in high unemployment
Licensed under Creative Common Page 97 unfavourable. The reforms that the government undertook towards an open economy,
especially the privatization process, have considerably improved the economic performance of
the country, resulting in considerably improved indicators and increasing trends, as well as
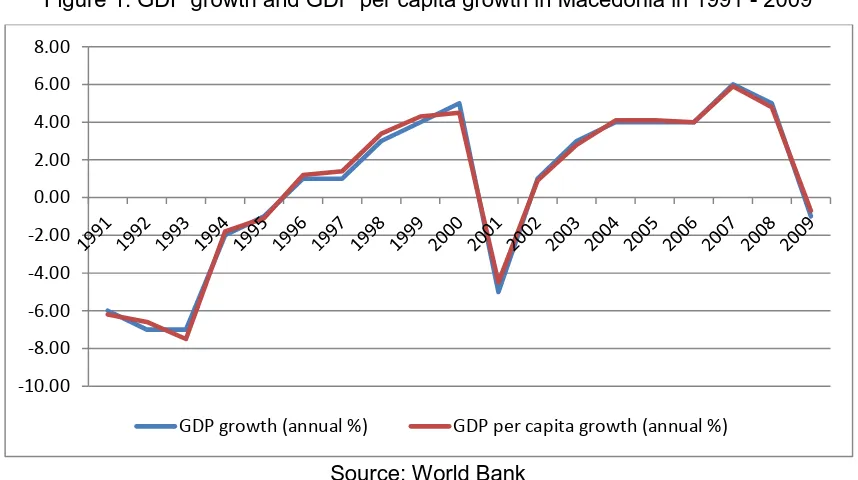
periods of high economic growth. The GDP growth of the country recorded a sharp decline in
the first few years of transition, and did not record positive figures until 1996. This is clearly
shown in Figure 1. The figure also indicates that the Macedonian economy has experienced
shifts in different directions in the last two decades, representing itself as an unstable economy.
The initial increasing trend, although associated with modest figures of GDP growth, continued
until the end of the decade, when GDP growth reached a peak of 4.5 percent. However, this
trend was interrupted and a decline of about 9 percentage points was recorded at the beginning
of the next decade. Several reasons remain behind this economic shrank, but the conflict in
Kosovo was one of the most important ones, that directly affected foreign trade and investment,
because Serbia was a major trading partner of the country. The economy recovered quickly,
reaching positive figures of around 3-5 percent during 2003 - 2006 and exceeding these figures
in 2007 and 2008. Because of global economic downturn, the economy shrank again in 2009.
Figure 1. GDP growth and GDP per capita growth in Macedonia in 1991 - 2009
Source: World Bank
Balkan is one of the less stable regions in the world, with little inspiration for capital investment
and foreign ownership. Macedonia is part of this peninsula, but given the general expectations
about what affects foreign investors’ decisions, there is still quite a road ahead. Vaknin (2006)
suggests that GDP, the rates of inflation and of interest, the living standards, the available -10.00
-8.00 -6.00 -4.00 -2.00 0.00 2.00 4.00 6.00 8.00
Licensed under Creative Common Page 98 infrastructure, and the banking system are not the first question to be asked by them. Instead,
foreign investors need to know about the property rights, the role of the state and the court, the
legislation in vigour, the crime rate and its persistency, the characteristics of the people,
officials and politicians, bureaucracy, the ease of doing business and similar issued that would
affect the foreign investor in the longer term. Data suggests that Macedonia has lacked behind
in projecting a friendly- to-business country to foreign businesses, although given the lack of
domestic capital and a low level of domestic savings, FDI is considered as a crucial component
for supporting the transition process and a sustainable economic growth in the long run.
Nevertheless, a considerable number of international companies from different countries have
started operations in Macedonia.
The transition period of the Republic of Macedonia has been associated with several
external shocks affecting the socio-economic activity of the country. Despite of the need for
foreign investments, Macedonia is one of the transition countries that has attracted lower levels
of FDI compared to other transition economies. The process of liberalization of foreign trade
noticed some important progress in 2001 with the Stabilization and Association Agreement with
EU that ensured duty-free access to European markets for the majority of the goods, provided
extended autonomous trade preferences and provided very liberal access to EU markets; in
2003, when the country accessed the WTO, and another important step in 2006 when it joined
the regional CEFTA. Nowadays, foreign trade accounts for more than 90 percent of GDP, a
level that surely exposes the country to external developments.
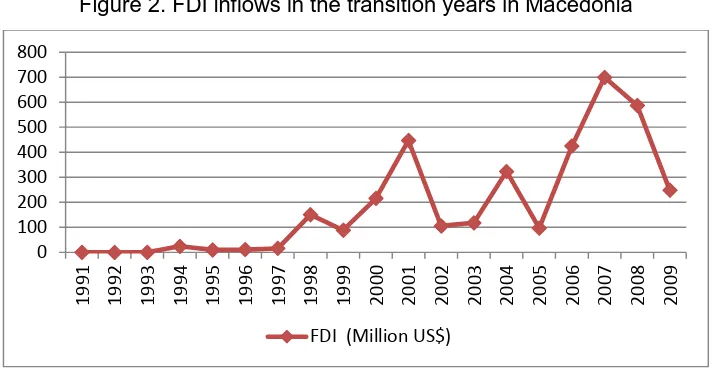
In the early years after the independence the FDI inflows were very modest. During the
1990s, the majority of foreign investments were in the manufacturing and construction sectors,
but most recent inflows have been invested in the service sector. The vast majority of FDI has
been privatisation-related, a process that is now almost complete. However, once the
privatisation process started, the inflow increased noticeably, reaching a peak of USD 447
million in 2001.According to the Statistical Bureau and the National Bank of the Republic of
Macedonia, the cumulative value of FDI in the Republic of Macedonia at the end of 2002 was
equivalent to approximately USD 106 million, the majority being accounted for by privatization
deals transacted through the Macedonian Stock Exchange. The trend showed constant
increase until 2004 reaching USD 323 ml. In 2005, an FDI inflow worth of USD 97 million was
recorded. The trend recovered dramatically in 2006 reaching USD 225 million mainly due to the
sale of the Electric Power Company. In 2007, the FDI inflow increased to USD 699 million
Licensed under Creative Common Page 99 Figure 2. FDI inflows in the transition years in Macedonia
Source: World Bank
LITERATURE REVIEW
A vast of literature on FDI and economic growth points to a positive relationship between the
two. However, a few explanations are provided in support to this evidence. Theoretically,
economic growth may encourage FDI inflow when FDI is seeking consumer markets, or when
growth leads to greater economies of scale. FDI may also indirectly affect economic growth
through its impact on capital stock, technology transfer, skill acquisition or market competition.
The relationship between economic growth and FDI has attracted the attention of many
researchers and policymakers through the years. Evidence suggests that FDI can stimulate
economic growth through different channels, which have been the focus of the theoretical
analysis of different authors such as Solow (1956), MacDougall (1960), Kemp (1961) and
Diamond (1965), among others. Empirical evidence was sought with regard to the effect of FDI
on the economic growth of developing countries through its effect on the productivity levels
(Stoneman, 1975), through the impact on the technological progress (Findlay, 1978) or via
international trade, imports and exports (Bhagwati, 1978; Balasubramanyam et al., 1996).
The theoretical developments in the field as well as the dynamics of the developing
economies, pointing out both positive and negative effects of FDI in the economic performance
of the receiving countries, revealed the need to empirically study which of these effects prevail.
Using cross-sectional data and OLS regressions for 46 developing countries over the period
1970 to 1985, Balasubramanyam et al. (1996) estimated the FDI effects on economic growth.
Although the results may not be reliable due to the use of the OLS regression and the two-way
causality between FDI and economic growth, they found that FDI has positive spill-overeffects
on economic growth, but these effects are stronger in countries that adopt export-promoting 0 100 200 300 400 500 600 700 800 19 91 19 92 19 93 19 94 19 95 19 96 19 97 19 98 19 99 20 00 20 01 20 02 20 03 20 04 20 05 20 06 20 07 20 08 20 09
Licensed under Creative Common Page 100 policies compared to import substituting economies. Olofsodotter (1998) also used OLS on
cross-section data for 50 developing and developed countries for the period 1980to1990 and
found that the FDI stock has a positive effect on the economic growth rate, the effect being
stronger for host countries with a higher level of institutional capability.
Borensztein et al (1998) also used cross-section data, for an extended panel of
69developing countries for the period 1970 to 1989. They used seemingly unrelated regression
and found that FDI has a positive effect on economic growth, and that the magnitude of the
relationship depends on the quality of the human capital of the host country. De Mello (1999)
used time series and fixed-effects on a sample of 32 developed and developing nations for the
estimation of the impact of FDI on capital accumulation and output growth in the recipient
economy. The results indicate that FDI can lead to better technology and enhanced
management in the host country. However, the evidence was relatively weak on whether FDI
affects the economic growth. Similar conclusions reached Choe (2003) when analyzing 80
countries by using the panel data causality tests.
Carkovic and Levine (2002) used the GMM technique to analyze the relationship
between FDI inflows and economic growth on a panel dataset covering 72 developed and
developing countries. They found no evidence on the impact of FDI on economic growth.
Bangoa and Sanchez-Robles (2003) examined the relationship between FDI, economic
freedom and economic growth in Latin America. They conclude that FDI has a significant
positive effect on host country economic growth but similar to Borensztein et al. (1998) the
magnitude depends on host country conditions.
Basu et al. (2003) used a panel of 23 countries from different continents and found a
co-integrated relationship between FDI and GDP growth. Their results emphasised trade openness
as a crucial determinant for the impact of FDI on growth. They found two-way causality between
FDI and GDP growth in open economies, both in the short and the long run. However, in
relatively closed economies the long run causality is unidirectional from GDP growth to FDI.
This evidence was further supported from the results of Trevino and Upadhyaya (2003) in their
study of five developing countries in Asia, who found that the positive impact of FDI on
economic growth is greater in more open economies. Johnson (2006) estimated the relationship
between FDI and economic growth for a panel of 90 countries and found that FDI inflows
positively affect economic growth in developing economies, but not in developed economies.
Chowdhury and Mavrotas (2006) took a different route by testing for Granger Causality
using data from 1969-2000, and found that FDI did not Granger-cause GDP in Chile, whereas
there is a bi-directional causality between GDP and FDI in Malaysia and Thailand. Hansen and
Licensed under Creative Common Page 101 during 1970-2000. Bloomstrom et al. (1994) found that FDI Granger caused economic growth,
conditional on the richness of the country. Hsiao and Hsiao (2006) has examined the Granger
causality relations between GDP, exports, and FDI among eight rapidly developing East and
Southeast Asian economies using panel data from 1986 to 2004. For the individual country time
series causality tests, they did not find systematic causality among GDP, exports, and FDI
variables. However, the panel data causality results reveal that FDI has unidirectional effects on
GDP directly and indirectly through exports, and there also exist bidirectional causality between
export and GDP.
METHODOLOGY
In addition to the variables discussed in the previous section: GDP growth and GDP per capita
growth and the net inflows of FDI, the empirical analysis will also be extended to multivariate
contexts by including other factors that are related to economic growth and FDI. These variables
include employment as a percentage of total population, secondary school enrolment as a proxy
for human capital and the share of the sum of export plus imports to GDP as a proxy for trade
openness of the country. Although the theory is very rich in factors of these kinds, the selection
of the variables that will be considered in this analysis is restricted because of non-availability of
data on a range of other variables or availability of a limited number of observations (years). The
consideration of these limited data would result in a very low of observations for the multivariate
analysis, and thus, the empirical results would have been unreliable. The frequency of the data
considered for the empirical analysis is annual.
The analysis begins with stationarity tests of the series under consideration. As Nelson
and Plosser (1982) argue, macroeconomic time-series data are usually non-stationary. The
results of the unit root tests would be used in deciding the integration range of the series, and
thus to avoid spurious regression. Three separate methods for the stationarity test are
employed in this study. First, we conduct an Augmented Dickey-Fuller (ADF) test by carrying
out a unit root test based on the structure in (3):
t
X
t
n
i i t i i
t
i
X
X
t
1
Where, X is the variable under consideration, is the first difference operator, t captures any
time trend,
t is a random error, and n is the maximum lag length. The optimal lag length isLicensed under Creative Common Page 102 hypothesis
0
, then we conclude that the series under consideration has a unit root and istherefore non-stationary. In addition, Dickey-Fuller GLS and the Phillips-Perron tests (Phillips,
1987; Phillips-Perron, 1988) were also performed.
The results of the stationarity tests are reported in Table 1 in the Appendix. The unit root
tests on the levels of each variable reveal the corresponding series to be non-stationary for all
countries. Analogous tests on the first-difference measures of the variables, however, reveal
both series to be integrated in the first order and, hence, stationary at the first-difference level.
These results also suggest that first-differences of the respective series must be used in the
Granger causality tests.
ANALYSIS AND RESULTS
Before proceeding with the Granger causality test, we first estimate a vector autoregression
model, taking into account the number of degrees of freedom that in our case due to data
limitations is fairly small. The results of this estimation are presented in Table 2 in the Appendix.
The results of the Granger tests are presented in Table 3 in the Appendix. Starting with the tests
for the first equation, the first is a Wald test that the coefficients on the two lags of the first
difference of the (natural) logarithm of the FDI that appear in the equation for the first difference
of the growth of GDP are jointly zero. The null hypothesis that D1GDP does not Granger-cause
D1LNFDI cannot be rejected. The same can be said for the Granger causality of D1LNFDI
onD1GDPG, tested in the second equation. Thus, the results indicate that these variables do
not Granger cause each other. The same analysis is carried for the relationship between the per
capita annual growth of the GDP and the FDI flows. As expected (because of the previous
results), the results indicate that these variables do not Granger cause each other. These
results are presented in Table 4 in the Appendix.
Hence, the results of the Granger causality test carried out above do not support any
FDI-growth causal relationship. Growth seems not to significantly affect FDI and likewise, FDI
seems not to affect growth. Possible explanations on the lack of causality between FDI and
GDP can be found in the way these two variables affect each other, shortly discussed in section
2. A more thorough discussion can be found in Carcovic and Levine (2002) and Ayanwale
(2007). It is possible that foreign investors are not much interested in investing in countries that
perform economically well, rather than in countries that provide good business climate, have
good business legislation, where courts and other institutions perform well, where the education,
culture and tradition of the people fulfils their expectations and favours their business
Licensed under Creative Common Page 103 between FDI and remittances, both considered and defined as inflows of money. The main
reason behind this difference may be the use of the profit of the international firms out of the
recipient country. An additional caveat to FDI is the possibility of international firms to pay higher
wages in comparison to national firms. This leads to employment of the brightest professionals
of the country, thus negatively affecting the performance of the national firms. These reasons,
among others, may jeopardize any positive effects that FDI per se may have on economic
growth. However, it is also possible that the nature of this relationship is influenced by other
institutional and economic factors, some of which are explored below.
Due to the limitations of the data, namely the low number of observations because of
unavailability, it is almost impossible to get reliable results if in the new model we will include
shorter series. For this reason, we decided to include the imports and exports (as shares of
GDP) for which we have full series, and will have the same number of observations, thus
lowering the degrees of freedom of the VAR model only due to increased number of variables.
The results of the Granger-causality tests for this estimation are presented in Table 5 in the
Appendix. They indicate that neither GDP, nor FDI are Granger caused by the import and export
variables. These results indicate that only exports and imports Granger cause each other. We
conclude the same, even when considering the per capita GDP Growth instead of the GDP
growth.
However, enriching the analysis with proxies of human capital significantly changes the
results. Unit root tests were also carried out for the secondary school enrolment rates, and the
series was differentiated once to be stationarity. The results of the VAR regression are
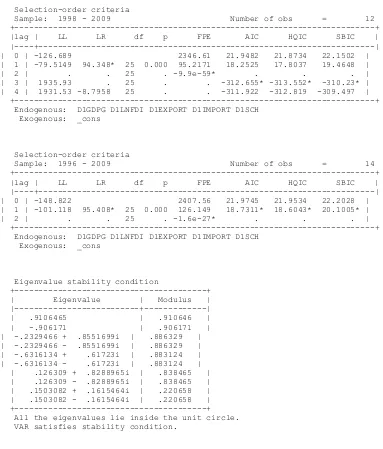
presented in Table 6, the respective diagnostics and the selection-order and optimal lag criteria
in table 7, and the Granger causality tests in the Table 8 in the Appendix. As it can be seen from
the figures in this table, enriching the analysis with human capital variables results in significant
two-way causality between GDP growth and FDI. GDP growth affects the FDI in the horizon of
two years, while the feedback from FDI to GDP is realized in a one-year lag. The signs of the
relationship also vary. The FDI has a positive impact on the GDP growth, while the effect of an
increase in the GDP of the country has a negative effect on the FDI inflows. The other variables
do also Granger-cause each other, but their relationship is beyond the interests of this study,
but it is interesting to note that there is an insignificant effect of the human capital proxy on the
economic growth, which suggests that there is a shortage of skilled labour in the country.
However, when considering these results for policy implication it must be taken into account that
this analysis draws upon a small number of observations and thus, on a low number of degrees
Licensed under Creative Common Page 104 CONCLUDING REMARKS
This study aimed at exploring empirical the relationship between FDI and GDP growth in
Macedonia. Data were collected from prestigious international institutions such as the World
Bank. The results vary among different specifications suggesting that in general FDI does not
contribute to Macedonia’s economic growth, and vice versa. This result holds for two
specifications, the bivariate one and another controlling for trade variables only. However, there
is a significant change in the results when a human capital proxy is added to the model. The
results of this latter model suggest that FDI has a positive effect economic growth of the
country, suggesting that the business climate is healthy. However, the changes in the results
because of an additional variable included in the analysis, namely the human capital variable, is
an indicator of the lack of robustness of the results, which can be argued mainly on the basis of
small sample size.
Given some of the previous results, one can conclude that, since FDI is expected to
positively affect economic growth, it needs to be encouraged. Nevertheless, the sectors of main
interest, those that have the highest potential for contributing to growth, need to be identified
and the FDI needs to be properly channelled and integrated into the mainstream of the
economy. This latter issue may be relevant and an issue of interest for future research in the
field, not only enriching the pool of academic studies on FDI and its impacts on the economy of
the country, but also in fostering the policy decision-making process with more appropriate
recommendations. Finally, in terms of future research, it is important to enrich the number of
observations, not only by using more years, but also by using higher frequency data. This would
increase the reliability of results, but more importantly, it would add to the investigation of short
run dynamics of the relationship between FDI and economic growth in Macedonia.
REFERENCES
Ayanwale, A. B., 2007. FDI and Economic Growth: Evidence from Nigeria. AERC Research Paper 165, African Economic Research Consortium, Nairobi.
Balasubramanyam, V N, Salisu M A and Sapsford, D, 1996. Foreign Direct Investment and Growth in EP and IS Countries. The Economic Journal,Vol.106( 434), pp. 92-105.
Bangoa, M., and Sanchez-Robles, B., 2003. Foreign direct investment, economy freedom and growth: new evidence from Latin America. European Journal of Political Economy, Vol. 19, pp. 529-545.
Basu, P., Chakraborty, C., and Reagle, D., 2003. Liberalization, FDI and Growth in Developing Countries: A Panel Cointegration Approach. Economic Inquiry, Vol. 41 (3), pp. 510-516.
Bhagwati, J. N., 1978. Anatomy and Consequences of Exchange Control Regimes, Vol. 1, Studies in International Economic Relations, 10 (New York: National Bureau of Economic Research).
Licensed under Creative Common Page 105 Borensztein, E., de Gregorio, J., and Lee, J.W., 1998. How does foreign direct investment affect economic growth? Journal of International Economics, Vol. 45, pp. 115-135.
Carkovic, M., and Levine, R., 2002. Does foreign direct investment accelerate economic growth? Working Paper, University of Minnesota, Department of Finance.
Choe, J. I., 2003. Do Foreign Direct Investment and Gross Domestic Investment Promote Economic Growth? Review of Development Economics Vol. 7, pp. 44-57.
Chowdhury, A., and Mavrotas, G., 2006. FDI and Growth: What Causes What? World Economy, Vol. 29 (1), pp. 9-19.
De Mello, L., 1999. Foreign Direct Investment-led growth: evidence from time series and panel data. Oxford Economic Papers, Vol.51, pp. 133-151.
Diamond, P. A., 1965.National Debt in a Neoclassical Growth Model. American Economic Review, Vol. 55(5), pp. 1126-1250.
Findlay, R., 1978. Relative backwardness, direct investment, and the transfer of technology: A simple dynamic model. The Quarterly Journal of Economics, Vol.92(1), pp. 1-16.
Hansen, H., and Rand, J., 2006. On the Causal Links between FDI and Growth in Developing Countries.The World Economy, Vol. 29 (1), pp. 21-41.
Hsiao, F. S. T., and Hsiao, M. C. W., 2006.FDI, Exports, and GDP in East and Southeast Asia‐Panel Data versus Time‐Series Causality Analysis. Journal of Asian Economics,Vol.17(6), pp. 1082‐1106.
Kemp, M., 1961.Foreign Investment and National Advantage. Economic Record, Vol. 28, pp. 56-62. MacDougall, G., 1960. The Benefits and Cost of Private Investment from Abroad: A Theoretical Approach. Economic Record, Vol. 36, pp. 13-35.
Nelson, C., and Plosser, C., 1982. Trends and random walks in macroeconomic time series: Some evidence and implications. Journal of Monetary Economics, Vol. 10, pp. 130-162.
Olofsdotter, K., 1998. Foreign direct investment, country capabilities and economic growth. WeltwirtschaftlichesArchiv, Vol. 134 (3), pp. 534-547.
Solow, R. M., 1956. A contribution to the theory of economic growth. The Quarterly Journal of Economics, Vol. 70(1), pp. 65-94.
Stoneman, C., 1975. Foreign Capital and Economic Growth. World Development. Vol. 3 (1), pp. 11-26. Trevino, L. J., and Upadhyaya, K. P., 2003. Foreign aid, FDI and Economic growth: Evidence from Asian countries. Transnational Corporations, Vol. 16 (4), pp. 119-135.
Licensed under Creative Common Page 106 APPENDICES
Table 1. Unit root tests
Test Variable Level P-value for z(t) First Diff. P-value for z(t)
Augmented DF (no trend)
FDI (in million US$) -2.608 0.658 -2.946** 0.040
Ln(FDI) -1.886 0.339 -2.891** 0.046
Annual GDP Growth -2.271 0.182 -3.165** 0.022
Annual Growth of GDP
per capita -2.235 0.194 -2.967** 0.038
Augmented DF (with trend)
FDI (in million US$) -2.388 0.386 -2.580* 0.097
Ln(FDI) -2.202 0.489 -2.891** 0.046
Annual GDP Growth -2.201 0.489 -3.576** 0.031
Annual Growth of GDP
per capita -2.283 0.443 -3.432** 0.047
Philips-Perron
FDI (in million US$) -1.955 (2) 0.307 -4.271* 0.001
Ln(FDI) -2.017 (2) 0.279 -6.036* 0.000
Annual GDP Growth -2.165 (2) 0.219 -4.573* 0.000
Annual Growth of GDP
per capita -2.140 (2)
0.229
-4.347* 0.000
Critical value at 5% Critical value at 5%
DF-GLS
FDI (in million US$) -3.318 (1) -3.476 -0.125 (6) -4.391
Ln(FDI) -1.354 (1) -3.476 -1.721 (2) -3.151
Annual GDP Growth -2.264 (1) -3.476 -2.794 (1) -3.421
Annual Growth of GDP
per capita -2.209 (1) -3.476 -2.659 (1) -3.421
* minimum number of lags in brackets
Table 2. VAR Results
Sample: 1994 - 2009 No. of obs = 16 Log likelihood = -64.83649 AIC = 9.354561 FPE = 41.34953 HQIC = 9.379288 Det(Sigma_ml) = 11.34534 SBIC = 9.837429 Equation Parms RMSE R-sq F P > F
--- D1GDPG 5 4.14428 0.1243 .3904525 0.8113 D1LNFDI 5 1.23824 0.2811 1.075292 0.4145 ---
--- | Coef. Std. Err. t P>|t| [95% Conf. Interval] ---+--- D1GDPG |
D1GDPG |
L1. | -.3408814 .3354533 -1.02 0.331 -1.079209 .3974464 L2. | -.2631273 .3378196 -0.78 0.452 -1.006663 .4804086
| D1LNFDI |
L1. | .2265998 .9825084 0.23 0.822 -1.935887 2.389086 L2. | .5044757 .9802156 0.51 0.617 -1.652964 2.661916 |
_cons | .5311393 1.284909 0.41 0.687 -2.296926 3.359205 ---+--- D1LNFDI |
D1GDPG |
L1. | .0670282 .1002276 0.67 0.517 -.1535713 .2876276 L2. | .0591699 .1009346 0.59 0.570 -.1629856 .2813255 |
D1LNFDI |
L1. | -.5645951 .2935564 -1.92 0.081 -1.210708 .0815181 L2. | -.3548066 .2928713 -1.21 0.251 -.999412 .2897989 |
Licensed under Creative Common Page 107 Table 3. Granger causality Wald tests for the relationship between first differences
of GDP growth and the first difference of (ln) FDI
+---+ | Equation Excluded | F dfdf_rProb> F |
|---+---| | D1GDPG D1LNFDI | .13256 2 11 0.8772 | | D1GDPG ALL | .13256 2 11 0.8772 | |---+---| | D1LNFDI D1GDPG | .29839 2 11 0.7478 | | D1LNFDI ALL | .29839 2 11 0.7478 | +---+
Table 4. Granger causality Wald tests for the relationship between first differences of GDP growth per capita and the first difference of (ln) FDI
+---+ | Equation Excluded | F dfdf_rProb> F |
|---+---| | D1GDPGPC D1LNFDI | .07874 2 11 0.9248 | | D1GDPGPC ALL | .07874 2 11 0.9248 | |---+---| | D1LNFDI D1GDPGPC | .29778 2 11 0.7483 | | D1LNFDI ALL | .29778 2 11 0.7483 | +---+
Table 5. Granger causality Wald tests for the extended model with (first differences) of import and export shares
Licensed under Creative Common Page 108 Table 6.VAR extended model with (first differences) of import and export shares,
and secondary school enrollment
Sample: 1996 - 2009 No. of obs = 14 FPE = -1.64e-27
Det(Sigma_ml) = -4.09e-32
Equation Parms RMSE R-sq chi2 P>chi2 --- D1GDPG 11 3.44294 0.8148 61.58751 0.0000 D1LNFDI 11 .452673 0.9546 294.1541 0.0000 D1EXPORT 11 5.45381 0.7551 43.16549 0.0000 D1IMPORT 11 5.64809 0.8520 80.62638 0.0000 D1SCH 11 .480248 0.9165 153.6516 0.0000 ---
--- | Coef. Std. Err. z P>|z| [95% Conf. Interval] ---+--- D1GDPG |
D1GDPG |
L1. | -.3114531 .2979998 -1.05 0.296 -.8955219 .2726158 L2. | -.500174 .3304477 -1.51 0.130 -1.14784 .1474917 |
D1LNFDI |
L1. | 2.42464 .7831581 3.10 0.002 .8896785 3.959602
L2. | .697191 .4368383 1.60 0.110 -.1589962 1.553378 |
D1EXPORT |
L1. | .4751256 .2715594 1.75 0.080 -.0571212 1.007372 L2. | -.9123104 .247218 -3.69 0.000 -1.396849 -.427772 |
D1IMPORT |
L1. | -.5969633 .2138411 -2.79 0.005 -1.016084 -.1778424 L2. | .4854288 .2416713 2.01 0.045 .0117618 .9590958 |
D1SCH |
L1. | -1.838855 1.1366 -1.62 0.106 -4.066551 .38884
L2. | .6234459 1.360916 0.46 0.647 -2.0439 3.290791
|
_cons | 1.080217 .9898414 1.09 0.275 -.8598361 3.020271 ---+--- D1LNFDI |
D1GDPG |
L1. | -.142583 .0391806 -3.64 0.000 -.2193757 -.0657904 L2. | -.2098954 .0434469 -4.83 0.000 -.2950497 -.1247411
| D1LNFDI |
L1. | -.3676674 .1029686 -3.57 0.000 -.5694822 -.1658526 L2. | -.2082803 .0574349 -3.63 0.000 -.3208507 -.0957099 |
D1EXPORT |
L1. | .367599 .0357043 10.30 0.000 .2976199 .4375782 L2. | -.0862087 .0325039 -2.65 0.008 -.1499152 -.0225022 |
D1IMPORT |
L1. | -.1746633 .0281156 -6.21 0.000 -.2297688 -.1195578 L2. | -.048703 .0317746 -1.53 0.125 -.1109802 .0135741 |
D1SCH |
L1. | .8663162 .1494388 5.80 0.000 .5734216 1.159211 L2. | -.5918316 .1789315 -3.31 0.001 -.9425308 -.2411323 |
_cons | .5861949 .1301431 4.50 0.000 .3311191 .8412707 ---+--- D1EXPORT |
D1GDPG |
Licensed under Creative Common Page 109
| D1LNFDI |
L1. | -.2777676 1.240568 -0.22 0.823 -2.709236 2.153701 L2. | -1.776758 .6919771 -2.57 0.010 -3.133008 -.4205074 |
D1EXPORT |
L1. | .9517878 .4301659 2.21 0.027 .1086781 1.794898 L2. | .0499915 .3916076 0.13 0.898 -.7175453 .8175283 |
D1IMPORT |
L1. | -1.042128 .3387368 -3.08 0.002 -1.70604 -.3782162 L2. | -.0069846 .3828213 -0.02 0.985 -.7573007 .7433314 |
D1SCH |
L1. | -3.750527 1.800441 -2.08 0.037 -7.279326 -.2217284 L2. | 4.838245 2.155769 2.24 0.025 .6130147 9.063475 |
_cons | 1.409599 1.567966 0.90 0.369 -1.663558 4.482756 ---+--- D1IMPORT |
D1GDPG |
L1. | .9236413 .4888644 1.89 0.059 -.0345154 1.881798 L2. | .7975183 .5420948 1.47 0.141 -.2649681 1.860005 |
D1LNFDI |
L1. | -.8892591 1.28476 -0.69 0.489 -3.407342 1.628824 L2. | -1.957886 .7166269 -2.73 0.006 -3.362449 -.5533232 |
D1EXPORT |
L1. | 1.64632 .4454894 3.70 0.000 .773177 2.519463 L2. | -.0238336 .4055576 -0.06 0.953 -.8187118 .7710446 |
D1IMPORT |
L1. | -1.74681 .3508034 -4.98 0.000 -2.434372 -1.059248 L2. | -.0456977 .3964583 -0.12 0.908 -.8227417 .7313463 |
D1SCH |
L1. | -5.732395 1.864577 -3.07 0.002 -9.386898 -2.077892 L2. | 6.630864 2.232563 2.97 0.003 2.255122 11.00661 |
_cons | 3.474683 1.623821 2.14 0.032 .2920529 6.657313 ---+--- D1SCH |
D1GDPG |
L1. | .1728694 .0415674 4.16 0.000 .0913988 .25434 L2. | .0389408 .0460935 0.84 0.398 -.0514008 .1292824 |
D1LNFDI |
L1. | .0843074 .1092412 0.77 0.440 -.1298014 .2984162 L2. | .3259888 .0609337 5.35 0.000 .206561 .4454167 |
D1EXPORT |
L1. | -.0381678 .0378793 -1.01 0.314 -.1124098 .0360743 L2. | -.0994271 .034484 -2.88 0.004 -.1670144 -.0318398 |
D1IMPORT |
L1. | .0628599 .0298283 2.11 0.035 .0043975 .1213223 L2. | .0891746 .0337103 2.65 0.008 .0231037 .1552455 |
D1SCH |
L1. | .3027326 .1585421 1.91 0.056 -.0080043 .6134695 L2. | .5322395 .1898315 2.80 0.005 .1601767 .9043023 |
Licensed under Creative Common Page 110 Table 7. Diagnostics of the VAR model extended with import and export shares
and secondary school enrollment
Selection-order criteria
Sample: 1998 - 2009 Number of obs = 12 +---+ |lag | LL LR df p FPE AIC HQIC SBIC | |----+---| | 0 | -126.689 2346.61 21.9482 21.8734 22.1502 | | 1 | -79.5149 94.348* 25 0.000 95.2171 18.2525 17.8037 19.4648 | | 2 | . . 25 . -9.9e-59* . . . | | 3 | 1935.93 . 25 . . -312.655* -313.552* -310.23* | | 4 | 1931.53 -8.7958 25 . . -311.922 -312.819 -309.497 | +---+ Endogenous: D1GDPG D1LNFDI D1EXPORT D1IMPORT D1SCH
Exogenous: _cons
Selection-order criteria
Sample: 1996 - 2009 Number of obs = 14 +---+ |lag | LL LR df p FPE AIC HQIC SBIC | |----+---| | 0 | -148.822 2407.56 21.9745 21.9534 22.2028 | | 1 | -101.118 95.408* 25 0.000 126.149 18.7311* 18.6043* 20.1005* | | 2 | . . 25 . -1.6e-27* . . . | +---+ Endogenous: D1GDPG D1LNFDI D1EXPORT D1IMPORT D1SCH
Exogenous: _cons
Eigenvalue stability condition
+---+ | Eigenvalue | Modulus | |---+---| | .9106465 | .910646 | | -.906171 | .906171 | | -.2329466 + .8551699i | .886329 | | -.2329466 - .8551699i | .886329 | | -.6316134 + .61723i | .883124 | | -.6316134 - .61723i | .883124 | | .126309 + .8288965i | .838465 | | .126309 - .8288965i | .838465 | | .1503082 + .1615464i | .220658 | | .1503082 - .1615464i | .220658 | +---+ All the eigenvalues lie inside the unit circle. VAR satisfies stability condition.
Table 8. Granger causality Wald tests for the extended model with (first differences) of import and export shares, and secondary school enrollment
Granger causality Wald tests
+---+ | Equation Excluded | chi2 dfProb> chi2 |
|---+---| | D1GDPGD1LNFDI | 9.6092 2 0.008 |
Licensed under Creative Common Page 111