A phenotypic and molecular characterization of the
fmr1-tm1Cgr
Fragile X mouse
Q. J. Yan
†, P. K. Asafo-Adjei
†, H. M. Arnold
§,
R. E. Brown
‡and R. P. Bauchwitz
*,††Department of Neurology, St. Luke’s-Roosevelt Institute for Health Sciences, Columbia University, New York, NY, USA, ‡Department of Psychology, Dalhousie University, Halifax, Nova Scotia, Canada,§Behavioral Neuropharmacology, Sention, Inc., Providence, RI, USA
*Corresponding Author: R. P. Bauchwitz, Department of Neurol-ogy, St. Luke’s-Roosevelt Institute for Health Sciences, Columbia University, 432 W 58th St., Rm. 411, New York, NY 10019, USA. E-mail:[email protected]
Fragile X Syndrome is the most common form of inherited mental retardation. It is also known for having a substantial behavioral morbidity, including autistic fea-tures. In humans, Fragile X Syndrome is almost always caused by inactivation of the X-linked FMR1 gene. A single knockout mouse model, fmr1-tm1Cgr, exists. In this report we further characterize the cognitive and behavioral phenotype of the fmr1-tm1Cgr Fragile X mouse through the use of F1 hybrid mice derived from two inbred strains (FVB/NJ and C57BL/6J). Use of F1 hybrids allows focus on the effects of thefmr1-tm1Cgr allele with reduced influence from recessive alleles present in the parental inbred strains. We find that the cognitive phenotype of fmr1-tm1Cgr mice, including measures of working memory and learning set formation that are known to be seriously impacted in humans with Fragile X Syndrome, are essentially normal. Further test-ing of inbred strains supports this conclusion. Thus, any fmr1-tm1Cgr cognitive deficit is surprisingly mild or absent. There is, however, clear support presented for a robust audiogenic seizure phenotype in all strains tested, as well as increased entries into the center of an open field. Finally, a molecular examination of thefmr1-tm1Cgr mouse shows that, contrary to common belief, it is not a molecular null. Implications of this finding for interpret-ation of the phenotype are discussed.
Keywords: Audiogenic seizure, Barnes maze, Fmr1 RNA, Fragile X, hybrid mouse strain, Morris water maze, olfactory sequence learning, open field, radial maze, working memory
Received 7 July 2003, revised 9 May 2004, accepted for publication 10 May 2004
Fragile X Syndrome (FXS) is a genetic disorder characterized by mental retardation, behavioral problems and physical mani-festations, most notably macroorchidism (Escalante et al. 1971; Martin & Bell 1943). It is the most common form of inherited mental retardation, with a prevalence of approxi-mately 1 in 4000 males (Morton et al. 1997; Turner et al. 1996). Those with FXS lack the protein FMRP (Fragile X Mental Retardation Protein) in neurons. FMRP is widely expressed in vertebrate tissues, particularly in those with dividing cells such as the developing brain (Devys et al. 1993; Khandjianet al. 1995). In almost all cases of FXS, the absence of FMRP is usually associated with a triplet repeat expansion in the 50 UTR of the X-linkedFMR1gene which
leads to promoter methylation and transcriptional silencing (Bellet al. 1991; Sutcliffeet al. 1992).
FMRP is an RNA binding protein (Siomiet al. 1993) asso-ciated with approximately 4% of brain mRNA (Ashleyet al. 1993) and has been observed on ribosomes in the neuronal soma and dendrites (Fenget al. 1997; Weiler & Greenough 1999). FMRP has the molecular characteristics of an mRNA nuclear–cytoplasmic shuttling protein, and can inhibit transla-tion of mRNAs (Laggerbaueret al. 2001; Liet al. 2001; Zalfa
et al. 2003). The presence of FMRP in dendrites, particularly at the base of spines, suggests that it is involved in mRNA targeting to synapses and/or the translational regulation of such mRNAs. Since dendritic abnormalities have been observed in FXS, it is possible that FMRP is involved in synaptic development and plasticity.
Ideally, animal models of Fragile X Syndrome should exhibit the hallmark behavioral and cognitive deficits observed in affected humans. Infants with Fragile X are usually noted to nurse poorly and are late in achieving developmental mile-stones such as sitting up. Hand flapping, poor eye contact and other autistic features are characteristically seen by 5 years of age. Perseveration in speech and behavior are frequently very pronounced, as are attention deficits, impul-sivity and hyperactivity (Baumgardner et al. 1995; Bregman
et al. 1988; Fischet al. 1999a; Muniret al. 2000b; Wilding
with the degree of tissue and methylation mosaicism (Kaufmannet al. 1999). In IQ tests, males with FXS show a relative deficit in sequential task processing, consistent with a deficit in short-term/working memory (Bennetto & Pennington 1996; Dykenset al. 1987).
In order to further investigate Fragile X Syndrome and its effect on intelligence, genetically manipulable animal models are essential. To this end, a knockout (KO) mouse has been produced by insertion of a selectable marker sequence into the fifth exon of theFmr1gene, which has 17 exons, thereby apparently disrupting transcription and translation of most of the gene lying-30of exon 5 (Dutch–Belgian Fragile-X
Consor-tium 1994); a function for exon 5 itself is not known. The
fmr1-tm1CgrKO mouse shares morphologic features of FXS in humans, such as macroorchidism (Dutch–Belgian Fragile-X Consortium 1994) and neuronal dendritic spine abnormalities (Comeryet al. 1997; Nimchinskyet al. 2001). Auditory seiz-ures can be induced infmr1-tm1Cgr mice as well (Chen & Toth 2001; Musumeciet al. 2000). Although no alterations in
fmr1-tm1Cgrhippocampal long-term potentiation (LTP) have been found (Godfraind et al. 1996; Paradee et al. 1999; Valentine et al. 2000), a deficit in cortical LTP has been described (Li et al. 2002), as has an elevation in mGluR group I dependent hippocampal LTD, which may be asso-ciated with elevated AMPA receptor internalization (Huber
et al. 2002).
Prior reports describing the behavioral phenotype of the
fmr1-tm1Cgrmouse have produced inconsistent results, and even behaviors seemingly the opposite of what would be expected from the human syndrome. For example, in spatial memory tests employing the Morris water maze (MWM), some groups observed possible mild deficits (D’Hoogeet al. 1997; Dutch–Belgian Fragile-X Consortium 1994; Kooyet al. 1996) while others saw no difference between mutant and wildtype (WT) animals which could be ascribed to the fmr1-tm1Cgr allele (Paradee et al. 1999; Peier et al. 2000). Likewise, differences from WT animals were found in a plus maze in one study (Van Damet al. 2000) but not in a second (Dobkinet al. 2000). Locomotor hyperactivity in the mutant animals has been reported (Dutch–Belgian Fragile-X Consortium 1994) as has its absence (Nielsenet al. 2002; Peieret al. 2000). In one study,fmr1-tm1Cgrmice performed significantly better than WT in operant learning and memory tasks (Fischet al. 1999b). Oddly, some of the more repro-ducible findings, principally a seemingly reduced anxiety in various tests (Peieret al. 2000), and a diminished response to audiogenic startle (Chen & Toth 2001; Nielsenet al. 2002), suggest a phenotype the opposite of that observed in humans with FXS (Bregman et al. 1988; Hagerman 1996; Milleret al. 1999).
Here we describe further cognitive and behavioral tests of
fmr1-tm1Cgr mice. Original test results are presented in several assays of working memory: novel object, radial maze and olfactory sequence. Results from testing in the Barnes maze, assessing spatial long-term memory, are also
reported for the first time infmr1-tm1Cgrmice. In addition, Barnes maze behaviors were compared to results from the MWM. Overall, the cognitive effects of the fmr1-tm1Cgr
mutation were surprisingly mild or undetectable. Tests of hyperarousal, including open field, elevated plus maze, acoustic startle and audiogenic seizure susceptibility were also performed.fmr1-tm1Cgrmice showed significant alter-ations in open field behavior and audiogenic seizure sensitiv-ity. Finally, the molecular phenotype of the fmr1-tm1Cgr
mouse was further characterized. Thefmr1-tm1Cgr mouse is shown to express substantialfmr1mRNA, including one isoform which has an open reading frame (ORF) extending the length of the gene and which would be expected to produce a full length FMRP. Implications for the phenotypes are discussed.
Materials and methods
Subjects
Ten WT and 14 KO mice were shipped to Dalhousie Uni-versity where they were kept in quarantine for two weeks and then tested in a battery of behavioral tests (Brownet al. 2000) which measured anxiety and locomotor activity (ele-vated plus maze, open field), non-spatial memory (novel object recognition) and spatial memory (Barnes maze, MWM, 8-arm radial maze) in that order. Twelve WT and KO mice each were used in the startle and PPI tests (Sention). Nine WT and 10 KO mice were used for the olfactory work-ing memory and second radial maze tests (Columbia). All of the preceding were F1 hybrid mice. Eleven FVB, 20 FVB KO, 13 C57, 6 C57 KO, 33 hybrid and 8 hybrid KO mice were used for audiogenic seizure testing (Columbia).
Genotyping and molecular analysis
Mice were genotyped by PCR for the presence of the neomycin (‘neo’) antibiotic resistance sequence found at the fmr1-tm1Cgr disruption site (primer sequences are given in Table 2). Mice were also genotyped for the presence of the WTFmr1 allele using the exon 5 primers Ex5(50)/(30)
spanning the neo insert. PCR conditions were typically 1 cycle of 94C, 4 min, 30–35 cycles of 94C, 30 seconds/
annealing temperature ‘Ta’ (Table 2), 1 min/72C, 2 min, and a
final extension of 72C, 7 min, on a Perkin-Elmer 2400 thermal
cycler (Wellesley, MA). Generally, 0.25 unit/25ml reaction Taq polymerase (Promega, Madison, WI, with Buffer B) was used, along with 200mM final dNTPS, and 0.2–1mM final primers.
Total RNA and cDNA was made from brain, growing tail tips, white blood cells, and other organs as previously described (Bauchwitz & Costantini 2000). Twomg of cDNA was routinely used for RT-PCR. Fivemg of oligo-dT selected polyadenylated RNA was used for Northern blots (Fig. 9) or 16mg of total RNA (not shown). Antisense32P labeled RNA
probes for Northern blotting were made from PCR products in which one primer included a terminal T7 RNA polymerase phage promoter sequence. Modified nucleotides were incorporated into the labeled RNA probes which allowed more efficient removal from the blots (Ambion Inc. Strip-EZ, Austin, TX). TheFmr1specific probe used in Fig. 9 spanned the 30-UTR region bounded by the MuSp primers (Table 2),
a region with no significant overlap to murineFXRsequences or others found by BLAST database seaches. RNA was separated on 1% agarose gels using BPTE buffer (Burnett 1997). Gels were blotted by downward transfer in 10SSC to positively charged nylon membranes. Northern blots were hybridized at 63C in 50% formamide buffer which in some
cases (Fig. 9) included a volume excluder (Cornish et al. 1998; Ambion UltraHyb). Blots were washed at 63C twice
for 5 min with 2xSSC/0.1%SDS followed by 63C twice for 15 min with 0.1xSSC/0.1%SDS.
RT-PCR across thefmr1-tm1Cgrinsertion site (e.g. Fig. 9) was as described for genotyping except that cycle exten-sions were usually increased to 3 min. RT-PCR products from a primary PCR were diluted as necessary (1/12–1/ 50 final) for a second round of PCR, as indicated in the text.
A nested PCR protocol was used to specifically identify the full length ORF isoform offmr1-tm1Cgr(Fig. 10). cDNA was made from 1mg of each RNA sample with a one step method (One-Step RT-PCR for Long Templates, Invitrogen, Carlsbad, CA; 55C, 30 min) and 0.5mMFmr1exon 3 and exon 7 primers
(1 cycle of 95C5 m followed by 40 cycles of 95C1 m,
54C2 m, 68C3 m). Subsequently, 2ml of this product
was used in a 50ml PCR reaction with 3neoiso – U1/L, U2/L or U3/L primers. The 3neoiso-U1 upstream primer was a nested Fmr1 exon 3 primer. An upstream primer which crossed a novel junction of the full lengthfmr1-tm1Cgrisoform was also used (3neoiso-U2; 50-TGATAAAGGGTGAGATCATC)
with the same 3neoiso-L primer (Table 2) to produce a 187 bp KO specific PCR product (‘U2’). Sensitivity of the 3neoiso-U2 primers and others spanning the U2187 bp product splice junc-tions (U4, U5 and U6, each with 3neoiso-L, unpublished data) was low as assessed by titration of known amounts of sequenced 187 bp product in PCR reactions. Therefore, ‘touchdown’ cycling protocols, with and without 1.2 M betaine, were also employed when using U2/L primers as a primary screen, e.g. 95C4 m; 5 cycles of 94C30 seconds,
72C45 seconds, 72C1 : 00 min, for which the annealing
temperature was decreased by 1.0C each cycle; 35 cycles of
94C30 seconds, 67C45 seconds, 72C1 min for
which the annealing temperature was decreased by 0.2C each cycle; 72C.
RNase protection analysis was used to estimate the quan-tity of splice products in adult mouse brains using the U2 splice junctions. A 208 nucleotide (NT) probe template was made by PCR between the 3neoiso-U2 primer and a T7 promoter sequence followed by a spacer (50 TAATACGAC- TCACTATAGGATTTAGGTGACACTATAGAGATAAGCTTGA-TATCGAATTCTTG). The probe was labeled with 32P-UTP 800 Ci/mmole, 10 mCi/ml, in anin vitrotranscription (Ambion MaxiScript) and then gel purified on a 15% acrylamide urea denaturing gel. 50mg of total RNA from adult KO and WT mice, as well as from yeast as a negative control, were processed as described (Ambion RPAIII; Fermentas RNaseA/T1 mix, 1:50). Samples and labeled markers (Century Plus, Ambion) were separated for 90 min at 300 V on a 15% acrylamide denaturing gel. Template RNA for a standard curve was produced by PCR between the 3neoiso-L primer and an oligonucleotide with a T7 promoter sequence upstream of the U2 primer sequence. A common band was observed in all RNase protection (‘RPA’) samples, including those in which the probe was hybridized to yeast total RNA (see Fig. 10a). The unknown common band was resistant to twice the RNase concentrations normally used in this procedure. This RNA is shorter than a full length probe, and may be a self-protected species, perhaps reflecting significant secondary structure.
Sequence analysis was used to confirm the identity of the 3neoiso-U1 and U2 products, as well as a third splice isoform from KO mice which employed a different 50splice junction (fmr1
The 3neosio-U3/L primer pair produced a 178 bp product (Ta¼56; Fig. 10). The U1 and U3 PCRs were performed
with a hotstart method (1.25m./50ml reaction AmpliTaq Gold, Applied Biosystems, Foster City, CA) 95C, 10 m, 35 cycles
of 95C, 30 seconds, Ta 1 m, 72C, 2 m. Ta U1¼54C; Ta
U3¼56C.
Elevated plus maze
The elevated plus maze (EPM) was built according to the description of Lister (Lister 1987) and was illuminated with a 60-watt red light. Mice were tested for 5 min and their behav-ior videotaped. Behavbehav-iors scored included: (1) frequency of entering the open arms with all four paws, (2) frequency of entering the closed arms, (3) time spent in the open arms, (4) time spent in the closed arms, (5) frequency of entering the central square with all four paws, (6) time spent in the central square, (7) frequency of head dipping over the sides of the open arm, (8) frequency of stretch attend postures, (9) fre-quency of rearing, (10) frefre-quency of nonexploratory behavior (grooming or not moving), (11) number of puddles or streaks of urine, (12) number of fecal boli, (13) locomotor activity (number of open and closed arm line crossings). From these results the percentage of entries into the open arms and closed arms based on the total arm entries were calculated for each animal. The percentage of time spent in the open arms and the closed arms was calculated over the 5-min test. The index of open arm avoidance (Trullas & Skolnick 1993) was calculated as 100 – (% time on open armsþ% entries into the open arms)/2.
Open field
Mice were tested in the open field test chamber (7272 cm square with 36 cm walls) for 5 min on each of 5 consecutive days. The floor was divided into 16 squares (1818 cm) with painted lines; a separate square of equal size was drawn around the center of the box. Testing was performed in the dark phase under a 60-watt red light. Behaviors were video-taped and analyzed with the event-recorder program Hind-sight v. 1.5 for MS-DOS. Mice were placed into one of the four corners of the open field, facing the center and tested for 5 min, after which the mice were returned to their home cages and the open field cleaned with 70% ethanol. The behaviors scored (Brownet al. 1999) included: (1) frequency line of crossing with all four paws, (2) frequency of crossing into the central square, (3) time spent in the central square, (4) frequency of free rearing, (5) frequency of rearing against a wall, (6) frequency of stretch attend postures, (7) frequency of grooming, (8) freezing, (9) number of puddles or streaks of urine, (10) number of fecal boli. Each animal was given a total locomotor activity score calculated as the sum of line cross-ings and rearing frequencies.
Novel object task
The novel object recognition task (Podhorna & Brown 2002) was conducted in the open field on the day after the final
open field test. During the first trial, two objects (01 and 02) were placed in diagonally opposite corners of the arena, each 10 cm from the corner. Each mouse was placed into one of the four corners of the open field and tested for 5 min. The following behaviors were recorded: the number of line cross-ings, rearing and rearing against the wall, the frequency of approaches to each object and the time sniffing each object. The novel object duration ratio was calculated as the time spent with the novel object divided by the time spent with both objects on day 2. The mice were returned to their home cage for 30 min and then reintroduced into the arena for trial 2 with the familiar object (01) in the same position as in trial 1 and a new object (N) that replaced 02. The same behaviors as described above were recorded for 5 min. Metal objects of various shapes (jar lids, bolts, nuts) ranging in size from about 222 cm to 246 cm were used as objects. Object 2 (to be replaced in trial 2) was counterbalanced for each group of animals. Object 1 (to remain for trial 2) was the same for all mice, to eliminate the possibility of aversion or preference to the object. The new object was similar in size to 02 to reduce preference for either object. All objects and the apparatus were cleaned after each test using 70% etha-nol to eliminate olfactory stimuli.
Olfactory learning and memory tasks
Barnes maze
The Barnes maze (Barnes 1979) for mice is a circular plat-form 69 cm in diameter with 16 equally spaced escape holes around its perimeter and surrounded by a 15 cm high wall (Pomplet al. 1999). One of the holes allowed escape from the platform into a box. The platform was bathed in bright light (2580 lux) and had a buzzer above the center. Three visual cues (two geometric shapes and a picture) were taped to the inside of the wall, semi-randomly, in locations that were not directly above any of the escape holes. The test procedure had four phases: habituation (1 day); acquisition training (4 days); reversal training (4 days); and a probe trial (1 day).
On the first day, the mice were habituated to the maze and to their escape hole. Mice were randomly assigned one of four escape holes (numbered 4, 8, 12 or 16). An inverted 2-1 glass beaker was placed over the mouse and around the escape hole for 5 min. The beaker prevented the mouse from moving away from the hole, but allowed it to see the rest of the maze and to explore and enter the escape hole to avoid the bright lights of the maze. The buzzer was not used during this habituation trial. In acquisition training the mouse was released into the center of the maze and the latency to enter the escape hole with all four feet was recorded, as were the number of errors committed (head dips into incor-rect holes) before the mouse located the escape hole. Repeated head dips into the same hole, without the animal moving away from the hole between dips, were counted as one error. Nose pokes into the correct escape hole without entry were not counted as an error. If the mouse did not enter the escape hole within 30 seconds, the buzzer was turned on to increase the aversiveness of the maze. The buzzer remained on until the mouse entered the escape box. If the mouse did not enter the escape box within 5 min it was guided to the escape hole with a piece of card-board. Mice were allowed to remain in the escape box for 30 seconds before being returned to their home cages. The maze was cleaned with 70% ethanol between animals. Each mouse received four trials per day with an intertrial interval of about 20 min. Acquisition training continued for four days, for a total of 16 trials. During reversal training, the escape box was moved to the hole opposite that used during acquisition and mice were then tested using the same procedure as during acquisition training. A five minute probe trial with no escape box or buzzer was conducted on day 10. The maze was divided into four pie-shaped quadrants labeled ‘correct’ (the correct hole during reversal training), ‘opposite’ (the correct hole during acquisition training), ‘right’ (to the right of the correct quadrant) and ‘left’ (to the left of the correct quadrant). The following measures were recorded: (1) fre-quency of entry into each of the four quadrants, (2) duration of time spent in each of the four quadrants, (3) frequency of freezing, (4) duration of time spent freezing, (5) number of head dips in the correct and opposite holes.
Morris water maze
A MWM modified for mice was used (Paylor et al. 1996). Several wall posters, as well as furniture, acted as extra-maze visual cues. During testing, the room was dimly lit with diffuse white light. Mice were tested in four phases: acquisition training with a hidden platform; reversal training with a hidden platform; a single probe trial with no escape platform; four trials with a visible platform.
All mice were randomly assigned a start position (West, North, East or South) and each trial lasted a maximum of 60 seconds. Latency to climb onto the platform was recorded. If the animal did not find the platform within 60 seconds, it was guided onto the platform. Mice had to remain on the platform for 20 seconds before being removed. Each mouse completed four trials per day for three days of acquisition training. Then the platform was moved to the opposite quadrant and four trials of reversal testing commenced for three days. The interval between trials for each mouse was 10 min. On the probe trial (day seven), the following behaviors were measured: (1) fre-quency of entry into each quadrant, (2) duration of time spent in each quadrant, (3) number of times the mouse crossed the location of the platform during acquisition and reversal training (annulus crossing), (4) frequency and dur-ation of thigmotaxic behavior, defined as swimming near the wall in the outer 1/6 of the radius of the pool.
8-Arm radial maze
The apparatus and protocol used for the spatial working memory task in the 8-arm radial maze was based on the win-shift paradigm described previously (Crusioet al. 1993; Schwegler et al. 1990). Eight extra-maze cues were pos-itioned on the platform between the arms of the maze in a fixed configuration. Five days prior to training the mice were placed on a food restriction schedule to maintain them at 80–85% of their free feeding weight. On days five and six the mice received two 10-minute habituation trials, 24 h apart, with free access to all arms, with no food in any of the arms. The mice were trained for 15 consecutive days, one trial per day. For each animal a specific subset of four arms was randomly selected (with the provision that no more than two arms were beside each other) and a food reward was placed in the dish in each of the baited arms. An arm entrance was scored if an animal entered an arm with all four paws. Trials were terminated after the mouse entered all four of the correct (baited) arms.
entered the chosen arm, the inner barrel was lowered and the sliding guillotine door positioned in line with the arm, allowing escape back into the center platform. Once the mouse entered the center, the guillotine door was closed, preventing the mouse from entering any other arms for 5 seconds. In the second configuration (radial maze II), the entrance to each arm had a clear plastic guillotine door. For a door to be opened, the mouse had to touch or rear up against it for at least 3 seconds (‘strong choice’). In the concentric barrel apparatus (radial maze I), if a mouse entered a baited arm but did not eat the food pellets, it was still recorded as an entry into the correct arm. Thus the mouse did not need to re-enter the correct arm to eat the food for this arm entry to be recorded. In contrast, in the individual door apparatus for which a definitive signal from the animal was required for a door to open (radial maze II), a correct score was counted only when the animal ate the food at the end of the arm. Entry into a correct arm without eating the reward was counted as a motivation error.
Measures recorded: (1) the sequence of arms entered, (2) the total number of arms entered until the last of the four baited arms had been entered, (3) the number of correct entries in the first four entries, (4) working memory errors (the number of times the mouse entered a correct arm after the initial entry), (5) reference memory errors (the number of incorrect, unbaited arms entered), (6) total time taken until all four baited arms were entered, (7) arm entry angles (the angle between consecutive arm entries).
Startle response and pre-pulse inhibition
Wildtype and fmr1 KO mice approximately 6 months old were tested in an SR-Laboratory startle reflex apparatus (San Diego Instruments, San Diego, CA) with background white noise adjusted to 65 dB. Ten minutes prior to the onset of the startle session, all mice were given a saline injection (1.0 ml/kg, i.p.) in order to establish testing param-eters for subsequent drug studies not reported here. Mice were placed in the startle apparatus and given a five minute adaptation period, after which each mouse was pre-sented with six startle stimuli (40 ms, 120 dB) to assess initial startle magnitude. Mice were then presented with five dif-ferent trial types in pseudo-random order such that a particu-lar trial type was not presented more than twice in a row. Trials were separated by a variable intertrial-interval of 15 seconds (range 5–25 seconds). The trial types were as follows: 10 additional startle trials (120 dB, 40 ms), 10 trials of a 68 dB pulse (40 ms) followed 100 ms later by the startle stimulus, 10 trials of an 80 dB pulse (40 ms) followed 100 ms later by the startle stimulus, five trials of the 68 dB ‘pre-pulse’ (no startle stimulus was presented on this trial) and five trials of the 80 dB pre-pulse only (again, no startle stimulus was presented). At the end of the session mice were presented with five additional trials of the startle stimulus to assess habituation to the startle stimulus. Mice were tested weekly for three weeks to assess any changes in response over
time and over repeated testing. Due to an equipment failure, data for six mice in each group were not recorded on the initial test day. Pre-pulse inhibition (PPI) of the startle response was calculated as a percentage by the following formula: PPI¼100[(a–b)/(a)] where ‘a’ is the mean value of the 10 startle response trials in the middle of the session and ‘b’ is the mean startle response to the 10 trials in which the startle stimulus was preceded by a pre-pulse. This measure was calculated independently for each level of the pre-pulse (68 and 80 dB).
Audiogenic seizure susceptibility
Population audiogenic seizure (AGS) sensitivity was deter-mined by exposing mice to a high intensity siren of fre-quency peak 1800–6300 Hz at an average sound pressure level of 125 dB at 11 cm (Personal Alarm, Model 49–417, Tandy Corporation) for up to 16 min in an empty plastic box with a sound-absorbent tile lid under which the siren was mounted. C57 and hybrid strains were found to have ele-vated seizure frequencies at earlier ages than the FVB strains, so the ages of AGS testing were adjusted as follows: FVB strains (WT and KO) were tested at 30 days while C57 and HYB strains were tested at 21 days (Q.J. Yan, M. Rammal, M. Tranfaglia, R.P. Bauchwitz, unpublished data). Data pre-sented in Fig. 8 are for the following numbers of unprimed mice: FVB (11), FVB KO (20), C57 (13), C57 KO (6), HYB (33), HYB KO (8). Seizures were also scored by the time of occur-rence (latency) during a 16-min test and by type: clonic, tonic, tonic-clonic and status epilepticus, which in these studies almost always led to death following a prolonged tonic seiz-ure. Wild running and jumping almost always preceded the onset of seizures, and these were noted but not included in the number of seizures.
Statistical analysis
All cognitive and behavioral tests were conducted by experi-menters blind to the genotype of the mice. Statistical ana-lyses of parametric data were conducted by the appropriate
t-test (after first assessing relation between the variances) or
by ANOVA. When ANOVA suggested a statistically significant
difference, the Tukey-Kramer method was used to assess which differences in means contributed significantly. For non-parametric categorical data (olfactory learning and AGS) chi-square analysis and Fisher’s exact test were used. Prob-ability valuesP<0.05 are indicated with an *,P<0.01 with **, andP<0.001 with *** in the figures. Error bars repre-sent one standard error of the mean (SEM), unless otherwise indicated.
Testis weights
Results
Nonspatial learning and memory Novel object task
In the novel object recognition test, mice with better object recognition memory show a preference for a novel object, i.e. they explore the novel object more often and for a longer period of time, while at the same time habituating to and spending less time with an object common to both trials (Ennaceur & Delacour 1988). When a novel object test was performed with WT and KO littermates on a FVB/ NJC57BL/6J (FC) hybrid F1 background, there was no statistically significant difference by genotype in time inves-tigating the novel object (Fig. 1a). As expected, there was a significant decrease in exploration of the common object by both genotypes on day 2 (Fig. 1b). An analysis of the novel
object duration ratios showed that there was no difference by genotype:F1,22¼0.274,P¼0.61.
Olfactory sequence working memory
An odor-based digging task was performed to specifically address whether a deficit existed in working memory for sequences of information, which has been implicated in the Fragile X syndrome (Dykenset al. 1987; Hodappet al. 1992; Kemperet al. 1988). This task was also meant to assess the higher cognitive ability of the mice. The sets of three odor-ants used in each trial were novel and constantly shuffled, such that only by acquisition of a learning set, namely choos-ing odor one first and then odor two second, could the animal consistently achieve near errorless performance. FVB and FVB KO mice were able to improve their perfect sequence choices from near random (22% average) to a peak of 50% average (Fig. 1c). No statistically significant difference in per-formance between genotypes (WT and KO), either by day or for cumulative scores, was observed using either a 15 sec-ond or 3 min delay between exposure and challenge. Hybrid WT and KO mice also had no difference in plateau perform-ance (Fig. 1d), but this background performed significantly better than the FVB and FVB KO (not shown; Katz et al. 2003). Thus, although a genetic effect was observed in this task, it was not associated with thefmr1-tm1Cgrallele.
Spatial learning and memory Barnes maze
In order to further assess the cognitive performance of the
fmr1-tm1Cgr(‘KO’) mice, several tests of spatial learning and memory were performed. During the first three days of training in the Barnes maze, WT mice made more errors (Fig. 2a) and had elevated latency to escape (Fig. 2b) com-pared to KO mice, although such differences did not rise to the level of statistical significance. Elevated anxiety may have had a negative effect on performance. Latency to the escape hole in this test increased by day (Fig. 2b), which would be expected if the maze was becoming less aversive to the mice with exposure. Although both genotypes entered all quadrants with equal frequency on the probe trial (no escape box; Fig. 2c), WT mice spent significantly more time in the correct quadrant than the KOs (Fig. 2d): X2(3,571)¼ 30.1,P<0.001.
Morris water maze
In the MWM test, WT mice were slower to reach the plat-form on the first four days of testing, the first three of which were the acquisition phase (Fig. 3a). Although the difference in latency did not reach statistical significance:F1,22¼0.76,
P¼0.39, the overall shorter latency by the KOs in the acquisition phase is consistent with results in the Barnes maze. In the MWM probe trial, the WT and KO mice spent more time in the correct quadrant than in any other quadrant, with no significant difference by genotype (Fig. 3b). The simi-larity of WT and KO recollection of the platform site was
0 5 10 15 20 25 30
(a) Duration of novel object
exploration
1 2
**
1 2
KO
0 5 10 15 20 25 30
(b) Duration of common object
exploration
(d)
7 9 11 13 15 17
WT KO
(c) FVB 2-sequence learning
set formation
0 10 20 30 40 50 60
1 2 3 4 5 6 7 8 9 10 11
Block WT KO
% 1 then 2
Seconds
Score
Seconds
Genotype HYB 2-sequence learning
with delay Day Day
WT
Figure 1: Visual and olfactory working memory comparisons.
more specifically measured in a circular region (annulus) around the last location that the platform occurred in the reversal trials; again, no difference between WT and KO performance was observed (Fig. 3c).
8-Arm radial maze
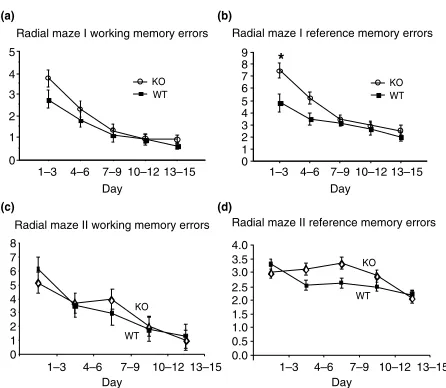
A radial maze test was performed and scored using a win-shift paradigm with four baited arms as previously described (Mineuret al. 2002; radial maze I). Over the first six days, the WT mice appeared to perform better in the maze than the KOs (Fig. 4a,b). ANOVA indicated a marginal difference
between genotype means for working memory:F1,19¼4.6,
P¼0.045, but no significant differences were observed between any single pair of blocks by genotype using the Tukey-Kramer honestly significant difference test.ANOVA indi-cated a significant difference between genotypes in refer-ence memory errors:F1,19¼9.2,P¼0.007. A Tukey-Kramer
post hoc comparison indicated that the difference in refer-ence memory involved performance in the first three-day block (critical difference CD¼2.3; the mean difference on day one between genotypes was 2.6). The trend of these results was similar to results reported recently for fmr1-tm1Cgrmice which were interpreted as indicating a deficit in working memory (Mineur et al. 2002). However, when radial maze testing was extended in this study, it was observed that fmr1-tm1Cgr mouse performance became equal to that of their WT littermate brothers by the third block of trials (Fig. 4a,b). Therefore, it appeared unlikely that a memory deficit existed in the KOs as this would no longer apply at later testing times. Instead, it might have been that the rate of learning of the rules of the test differed between the genotypes, or alternatively, a difference in attention or
search strategies existed. It was apparent that some mice were attempting to use a serial search strategy in the early days of testing, which might have affected the early perform-ance if one genotype had differences in such tendencies. Keeping all arm doors blocked for a short time (usually about 5 seconds) when the mouse was in the center platform was intended to disrupt the effect of serial search strategies (Bolhuiset al. 1986) and did so in our tests. There was no opposite correct right left
0 opposite correct right left
0
(d) Duration
KO WT
20 40
60 *** 1 2 3 4 5 6 7 8
reversal
(a) Barnes maze error number
4 8 12 16 20 24
0
(c) Quadrant entry frequency
1 2 3 4 5 6
1 2 3 4 5 6 7 8
(b) Correct hole latency
25 50 75 100 125 150 175
0 200
Number of entries
Number of errors
Percent time
Seconds
Day Day
Quadrant Quadrant
Figure 2: Barnes maze spatial memory test. (a) Number of errors prior to entering the correct escape hole. (b) Latency to enter the correct escape hole over eight days of training. (c) Frequency of correct quadrant entries during probe (no escape) test. (d) Time spent in each quadrant during the probe trial. ***P<0.001.
0 1 2 3 4 5 6
(c)
Reversal annulus crossing frequencycorrect right opposite left
Duration
0 10 20 30 40 50
1 2 3 4 5 6
0 10 20 30 40 50 60
reversal
(a)
Morris water maze latency(b)
KO WT
Number of crossings
% Time
Seconds
Genotype Quadrant
Day
statistical difference in the angles chosen between consecu-tive arm entries between the two genotypes (measured in groups of 3 days for 1, 45, 90, 135 and 180 degrees). How-ever, in opening the doors after a fixed time, we observed that many mice on early days would enter the arm they happened to be nearest when the doors were unblocked, even though they had been moving to many arms (often serially) while the doors were blocked.
In order to further examine whether there was a reproduc-ible difference between WT and KO animals during the first week of training, a second group of hybrid WT and KO littermates was tested (radial maze II). However, in the sec-ond maze animals were trained that opening a door required touching or leaning against it for at least three seconds. Thus, the animal learned to make a clear choice in order to get a door to open (‘strong choice’ test). If the animal were remembering the location of the food early in the testing, then it would not be expected that such a more definitive assessment of choice would have any negative impact on performance. In addition to this modification, the scoring was adjusted such that if an animal entered a correct arm but did not eat the reward, a motivation error was noted; when the animal did subsequently enter the arm and eat the food, it was scored as a correct response. However, the fre-quency of motivational errors was extremely small (6 such
errors for all 16 mice over all days, of which 1 occurred on the first day, and the rest on the last day, four from a single animal), so this had no appreciable effect on the outcome. In this second radial maze experiment, there was no statistically sig-nificant difference in working memory errors (arm reentries) on any day by genotype (Fig. 4c). Only during one three-day block (days 7–9) did KO reference memory errors (empty arm entries) appear to be slightly greater than WT (Fig. 4d;
P¼0.13), but this was due to performance of a small subset of animals and was not sustained throughout the test.
In comparing the two radial maze results, mice of both genotypes, but especially the KOs, made more reference memory errors (empty lane entries) in radial maze I than in radial maze II (strong choice). Conversely, both genotypes made fewer early working memory (reentry) errors in radial maze I than II. Although final performance was similar in the two maze formats, it took several days longer for the mice of both genotypes to master the maze (II) that required a defini-tive choice by the mouse.
Hyperarousal and anxiety Open field
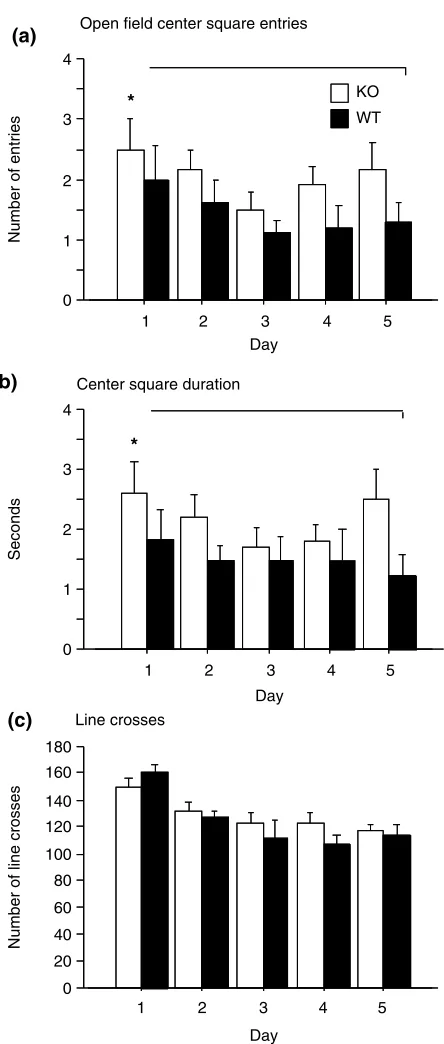
In the open field test, KOs entered the center more often,
F1,22¼4.2,P¼0.05, and spent significantly more time in the center,F1,22¼5.2,P¼0.03, than WT littermates on each of 5 days of testing (Fig. 5a,b). No mean difference in genotype behavior by day rose to statistical significance using Tukey-Kramer post hocanalysis. The preference of KO animals to enter the center of an arena well before WT littermates, particularly on initial exposure, was quite evident in other tasks such as a Y-shaped water maze (data not shown). However, the KO animals also showed more stretch attend postures, suggestive of risk assessment, than did WTs on days 1, 2 and 4 (WT stretch attend was greater than KO on day 3). Rearing and freezing activity did not differ between the strains (except for elevated WT freezing on day 3 – the same day they exhibited more stretch attend behavior). At the very least, the stretch attends do not support a simple interpret-ation that the WTs were more anxious than the KOs. Rather, differences in preference for moving to the center of the maze might suggest more aggressive exploratory behavior in the KOs. There was no difference by genotype in overall loco-motor activity as measured by line crosses (Fig. 5c).
Elevated plus maze
The EPM is regarded as a robust measure of rodent anxiety (Handley & Mithani 1984; Lister 1987; Pellow & File 1986; Trullas & Skolnick 1993) which should be able to provide support for the open field results suggesting reduced anxiety in KO mice (Peieret al. 2000 and herein). However, in the EPM there was no significant difference between WT and KO in the number of open arm entries (the mean was actu-ally less for KOs), closed arm entries, open or closed arm duration, entries and time in the central square, head dips over the side of an open arm, stretching or rearing. Figure 6
(a)
0 1 2 3 4 5
1–3 4–6 7–9 10–12 13–15 Day
WT KO
(b)
Radial maze I reference memory errors
Day
*
0 1 2 3 4 5 6 7 8 9
1–3 4–6 7–9 10–12 13–15
WT KO
(c)
0 1 2 3 4 5 6 7 8
KO
WT
1–3 4–6 7–9 10–12 13–15 (d)
0.0 0.5 1.0 1.5 2.0 2.5 3.0 3.5 4.0
KO
WT
1–3 4–6 7–9 10–12 13–15 Radial maze I working memory errors
Radial maze II reference memory errors Radial maze II working memory errors
Day Day
Figure 4: 8-Arm radial maze.Radial maze I: (a) Three day mean working memory errors (re-entries into a baited arm). (b) Three day mean reference memory errors (the number of entries into unbaited arms). Radial maze II: a second 8-arm radial maze
performed with a second group of WT and KO FVB/NJC57BL/
summarizes the EPM results as an index of open arm avoid-ance (Trullas & Skolnick 1993). An additional 10 F1 hybrid mice of each genotype tested in an EPM with a dark-sided arm under bright lights confirmed the lack of difference between the genotypes in open arm avoidance (M. Rammal and R.P. Bauchwitz, unpublished).
Acoustic startle: habituation and pre-pulse inhibition
No differences were observed betweenfmr1mutant mice and their WT counterparts on any of the startle related meas-ures (see Table 1). Analysis of the data for the subset of animals that were successfully recorded over all three days did not reveal any significant effects of genotype on the initial day of testing nor any interactions between day and geno-type on any of the recorded measures. Because these data did not reveal any effects, the data were collapsed across all available days of testing to create an average score for each animal for each measure. Both groups had similar degrees of response to the initial startle stimulus (t22¼0.146, P¼0.885). While a significant reduction in startle amplitude was observed over the course of the session (Fig. 7a) for both groups of mice (F3,66¼70.402,P<0.001) there were no differences between the WT and KOs on the rate of habituation (F3,66¼0.644,P<0.589).
The percent inhibition of the startle response was calcu-lated for each of the pre-pulse levels (68 and 80 dB) and is shown for each genotype in Fig. 7(b). The 80 dB pre-pulse resulted in significantly more inhibition of the startle than the lower 68 dB pulse (F1,22¼553.4,P<0.001). However, there was no effect of genotype nor an interaction between these two factors (bothPs>0.1). At least one previously published paper reported that F1fmr1-tm1Cgrmice exhibited a startle response to the pre-pulse stimulus itself (Nielsen et al. 2002). However, in the current study neither the KO nor
0 20 40 60 80 100 120 140 160 180
1 2 3 4 5
Day
(c)
Line crosses0 1 2 3 4
1 2 3 4 5
Day
(a)
*
Day 0
1 2 3 4
1 2 3 4 5
Center square duration
*
Number of line crosses
Seconds
Number of entries
(b)
KO
WT Open field center square entries
Figure 5: Open field.(a) Frequency of center square entries. (b) Duration in the center square. (c) Number of line crosses as a measure of locomotor activity. No statistically significant
difference by genotype. Open square entries (P¼0.05) and
duration (P¼0.03) were significantly greater forfmr1-tm1CgrKO mice across days byANOVA. *P<0.01.
0 .1 .2 .3 .4 .5 .6 .7
KO WT
Arbitrary units
EPM index of open arm avoidance
Figure 6: Elevated plus maze.Index of open arm avoidance by
genotype measured as: 100 – (% time on open armsþ% entries
WT mice showed any tendency to exhibit a startle response to the 68 or 80 dB signal when this signal was presented without being followed by a startle pulse (Ps>0.05).
Audiogenic seizures
It has been reported that Fragile X KO (fmr1-tm1Cgr) mice are more sensitive to seizures induced by auditory stimulus than WT animals (Chen & Toth 2001; Musumeciet al. 2000). We found this to be the case for all strains tested: inbred FVB KO and C57 KO, and also F1 hybrid KO mice (Fig. 8). The
fmr1mutation significantly raised the seizure rate in all WT backgrounds. In general, the FVB WT background was the most sensitive to audiogenic seizures of the WT strains. C57 WT were quite resistant to AGS under our conditions, yet the presence of thefmr1-tm1Cgrallele on this background sub-stantially raised seizure sensitivity in total, and for status epilepticus (Fig. 8). Hybrid KO mice, regardless of the sex of the parental knockout strain (FVBC57) or (C57FVB), had a much reduced susceptibility to status epilepticus (pro-longed seizures most often leading to death) compared to the parental inbred KO lines (Fig. 8). From the lack of status epi-lepticus observed in hybrid KO mice, we conclude that this genetic background is most resistant to AGS, consistent with inbred AGS sensitivity being due to recessive alleles. None-theless, using the same equipment with a priming protocol, we could see AGS in all WT backgrounds, as well as elevated AGS frequency and severity in the susceptible FVB and KO lines (Q.J. Yan, M. Tranfaglia and R.P. Bauchwitz, unpublished data).
Molecular characterization
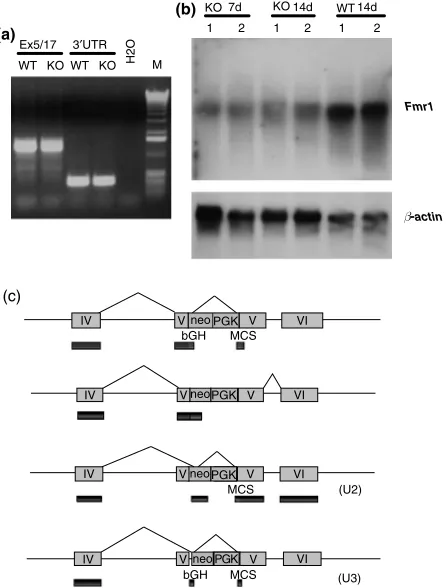
It has been repeated many times in the literature that fmr1-tm1Cgr mice lack Fmr1 RNA or protein (e.g. Brownet al. 2001; Li et al. 2002; Nielsen et al. 2002) or are ‘null’ (Miyashiro et al. 2003). However, upon performing RT-PCR of mRNA preparations fromfmr1-tm1Cgrmice, we observed thatFmr1mRNA was present both 30and 50of the disruption
site in exon 5 (Fig. 9a; Bauchwitz 1998). Northern blot analy-sis showed that the fmr1-tm1Cgr promoter is producing
fmr1 mRNA at significant levels, as assessed by probes specific for the 30UTR of mouseFmr1(Fig. 9b). By
sequen-cing multiexon cDNA products from several fmr1-tm1Cgr
specific PCR primer pairs located throughout the fmr1-tm1Cgr sequence, we demonstrated thatFmr1 sequence, and notFxr1orFxr2, was being expressed infmr1-tm1Cgr
male mice.
Primers spanning the PGKneo insertion site in exon 5 of the fmr1-tm1Cgr allele were used to obtain cDNAs for sequencing (Table 2). Sequence of the KO RT-PCR products were definitive regarding the ability of thefmr1-tm1Cgrallele to produce splice products through and around the disrup-tion. Some of the splice products obtained are diagrammed in Fig. 9(c) (see also GenBank accession numbers AF170530, AF179463, AY544163 and sequences in Fig. 10). In general, various truncated FMRP products were predicted. However, of potentially greater significance, one of the sequenced products encoded an mRNA with an ORF which could pro-duce a protein extending the entire length of FMRP. This full length ORF is actually the product of a double splice in which exon 4 is joined to 153 bases of reverse orientation Tn5 Table 1: Startle response of F1 hybrid wildtype andfmr1-tm1Cgr
mice
Initial Startle % PPI (68 dB) %PPI (80 dB)
Wildtype 126.414.2 32.72.7 50.43.5
Knockout 124.08.2 37.42.2 55.92.1
Mean (SEM) startle amplitude (in arbitrary units) during the initial startle trial and startle trials preceded by a prepulse of 68 or 80 dB.
Blocks of five startle trials 60
KO WT
(a)
120 140 160
Arbitrary units
65 0
20 30 40 50 60 70
80
KO WT
(b)
Percentage
Mean acoustic startle response Mean %prepulse inhibition
Blk1 Blk2 Blk3 Blk4
80 100
Pre-pulse decibel level 10
Figure 7: Pre-pulse inhibition of startle response in F1 hybrid WT and fmr1 mutant mice.(a). Mean acoustic startle response over blocks of five startle trials. (b) Pre-pulse inhibition of the startle response. In neither measure was there a statistically significant difference by genotype.
18
100
0 67
0
100
0
75
0
17
0 0
0 20 40 60 80 100 120
Percentage
FVB FVBko C57 C57ko HYB HYBko
Strains
Audiogenic seizure frequency
Figure 8: Seizure frequency in fmr1-tm1Cgr mice of various genetic backgrounds.FVB and FVB KO male mice at 30 days of age, and C57, C57KO, HYB and HYBKO at 21 days of age were exposed to high intensity sound from a siren. The lighter, left bar of each pair shows total seizures; the darker, right bar is status epilepticus. FVB is FVB/NJ, C57 is C57BL/6J, HYB is
neomycin structural gene sequence, which in turn is joined to the multiple cloning site sequence found at the 30junction
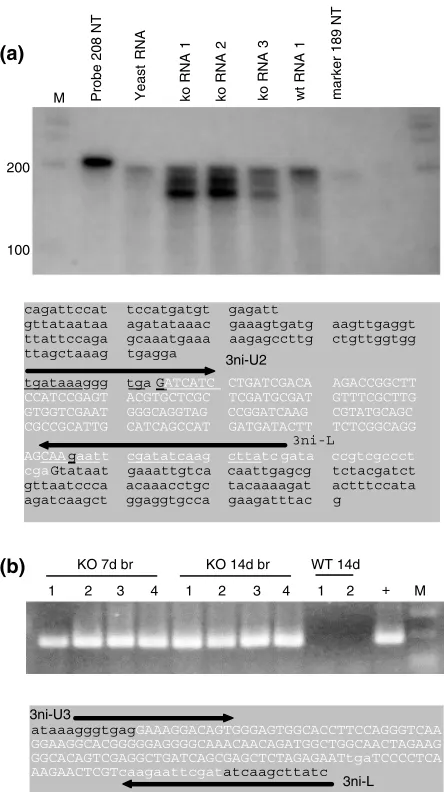
of PGKneo and exon 5 (Fig. 10a). Conserved splice acceptor and donor sequences (50 intron GT and 30 intron AG) were
observed at the novel splice sites. The difference between the predicted protein and true FMRP is that 61 novel amino acids from non-coding neomycin (Tn5) strand and multiple cloning site sequence would replace 12 amino acids from the portion of exon 5 preceding the disruption. The sequence in Fig. 10(a) (as well as the others described in Fig. 9) rules out any possibility that the fmr1-tm1Cgr allele is not being expressed. These products were found in the brains of FVB, C57 and hybrid strains in the fetal, newborn, juvenile and adult periods. The same 30 splice junction, spanned by
the 3neoiso-L primer, was also present in conjunction with a 50splice between the KOfmr1exon 4 and the bovine growth
hormone polyadenylation signal found 30 of the neomycin
insert sequence. This 3neoiso-U3 product was easily and widely observed in KO but not WT animals (Fig. 10b). As for the other PCR products, the identity of the 3neoiso-U3 pro-ducts were confirmed by DNA sequencing (Fig. 10b).
More than one dozen additional splice isoforms were observed spanning the disruption site in the fmr1-tm1Cgr
allele but not sequenced. Therefore, the products described here are not comprehensive and we do not rule out that other splice products with full length open reading frames may be present. The goal of this characterization was to demonstrate thatfmr1-tm1Cgris not a molecular null, i.e. it producesFmr1 mRNA, and possibly truncated or even full length FMRP.
In a preliminary effort to quantitate the level of the U2 splice product, RNase protection assays were performed. Knockout specific splice products were observed from the U2 region (Fig. 10a). The lower, darker product was of exactly the size (167 NT) predicted for a splice product lacking the 30
junction of U2 (Fig. 10a). The upper product is almost exactly the size (185 NT) of the U2 full length open reading frame product (187 NT). The upper KO specific band was generally
IV VneoPGK V VI
MCS
IV V V VI
MCS bGH
PGK neo
IV VneoPGK V VI
IV V V VI
MCS bGH
PGK neo
(U2)
(U3)
1 2 1 2 1 2
7d 14d 14d
Fmr1
(b)
(c) (a)
KO
WT KO
KO KO
WT
WT
H2O M
Ex5/17 3′UTR
β-actin
Figure 9: Fmr1mRNA is present in the fmr1-tm1Cgr mouse.(a)
Fmr1RT-PCR shows common products in WT and KO mice in the
30UTR, the 30coding region (spanning exons 5–17; ‘Ex5/17’), and 50 of the disruption site (exons 1–4; ‘Ex1/4’). (b) Northern blot analysis of polyadenylated mRNA from hybrid KO and WT mouse brains (at 7 and 14 days of age). A strand specific RNA probe for the murineFmr1 30UTR shows significant levels ofFmr1mRNA in thefmr1-tm1Cgr mouse. The same blot was stripped and rehybridized with a probe for murineb-actin mRNA. (c) Schematic diagrams of somefmr1-tm1Cgr splice isoforms obtained from sequencing RT-PCR products. At least one splice product (bottom) can encode a protein which extends the full length of FMRP.
Table 2: PCR primers for genotyping and molecular analysis offmr1-tm1CgrRNA
Name 50 30 Ta cDNA
Neo-(N3/N4) AGAGGCTATTCGGCTATGACTG CCTGATCGACAAGACCGGCTTC 65 417
Ex5(50)/5(30) ATAGAATATGCAGCATGT TTGTCGTAAATCTTCTGG 50 138
MuSp 30UTR AGATGTTTTCAGCTACTTG AAAAAAACCCCACAAAAAT 53 378
HuSp 30UTR TTGAATTTTCATTTTACAG CCTTGGTTAATTATCTACA 53 238
Ex5/17 TCACAATTGAGCGTCTAC ACGGAAATGGTATAGGAAATA 60 1571
Ex1/4 TCCAATGGCGCTTTCTAC CCTTTATCATCCTCACTT 52 235
Ex4/5 GCCTTGCTGTTGGTGGTTAG GCAGGTTTGTTGGGATTA 60 138/var
Ex3/7 GAGACAGATTCCATTCCA TCGCTTTGAGGTGACTTC 60 424/var
3/5(30) GAGACAGATTCCATTCCA TTGTCGTAAATCTTCTGG 60 301/var
3neoiso-U/L ATTCCCACCACCTGTAGGTTA GATAAGCTTGATATCGAATTCTTG 54 300
cDNA sizes are identical for WT and KO unless spanning the KO insertion site in exon 5, in which case ‘var’ for ‘ various sizes’ is indicated. For
found to be about 1/10th the level of the lower KO specific product. These two KO specific bands were present in all KO brain total RNA samples tested (5 FVB KO adult and 3 HYB KO 7–15 day postnatal), but not in any WT (2 FVB adult and 1 HYB 7 day postnatal). The quantity of the two KO specific bands observed in the RNase protection assay was estimated by comparing signal intensities to a titration of known amount of target RNA (Materials and methods). The upper KO specific band was present at a level of approxi-mately 2–4 pg and the lower 167NTband about 20 pg, although the relative levels of the upper band could appear to be greater in some samples (Fig. 10a). Since adult hemi-brains of approximately 200 mg produced 240mg total RNA on average, a 50mg RNA sample was derived from 42 mg brain. Using a density of neurons in the mouse brain of 180 000/mm3 (Jerison 1973), and molecular weights of 60 300 and 50 000 for the 187 and 167NT products, respectively, it was estimated that there may be at least 100 copies of the 167 NT splice product and on the order of 10 molecules of U2 per murine neuron on average. The levels of the U2 KO RNAs might be very different if specific populations or devel-opmental time points are examined. Efforts to quantitate expression levels during development and to obtain amino acid sequence information from fmr1-tm1Cgr specific pro-tein products observed with antibodies to FMRP are under-way.
Testis weights
It has been demonstrated that there exists a substantial increase in testicular size infmr1-tm1Cgr strains relative to WT controls, with a maximum difference in adults at 3 months of age (Dutch–Belgian Fragile-X Consortium 1994; Kooyet al. 1996). This is consistent with the enlarged testicu-lar volumes observed in males with FXS (Butleret al. 1992). In order to ensure that ourfmr1KO mice were indeed what the molecular genotyping suggested, we measured testis weights for all strains used in this study (Fig. 11). In all three genetic backgrounds of WT and KO mice, there was a highly significant difference in weight between WT and KO testes. This supported the audiogenic seizure data indicating that thefmr1-tm1Cgrallele was penetrant in our strains. The testis data also indicated that strain background had a sig-nificant effect on adult testis size. Hybrid WT testes were approximately the same size or larger, on average, than the testes of the inbred KO strains (Fig. 11; HYB vs. C57 KO
P¼0.13; HYB vs. FVB KOP¼0.001). It is known that testis size does not correlate with body size, but rather with chrono-logical age (e.g. Zachmann et al. 1974). This suggests that some recessive alleles in the inbred strains were acting to reduce adult testis size relative to that seen in the hybrid animals. Furthermore, the effect of such alleles had a mag-nitude approximately equal to that of thefmr1-tm1Cgrallele itself (Fig. 11). This contrasts with the case of adult humans with FXS, in which the range of testicular size has little overlap with that of normals; the 50th percentile of mean
3ni-U3
3ni-L
+
1 2 3 4 1 2 3 4 1 2 M
(b)
cagattccat tccatgatgt gagatt
gttataataa agatataaac gaaagtgatg aagttgaggt ttattccaga gcaaatgaaa aagagccttg ctgttggtgg ttagctaaag tgagga
tgataaaggg tga GATCATC CTGATCGACA AGACCGGCTT
CCATCCGAGT ACGTGCTCGC TCGATGCGAT GTTTCGCTTG
GTGGTCGAAT GGGCAGGTAG CCGGATCAAG CGTATGCAGC
CGCCGCATTG CATCAGCCAT GATGATACTT TCTCGGCAGG
AGCAAgaatt cgatatcaag cttatc gata ccgtcgccct
cgaGtataat gaaattgtca caattgagcg tctacgatct gttaatccca acaaacctgc tacaaaagat actttccata agatcaagct ggaggtgcca gaagatttac g
3ni-U2
3ni-L
(a)
100 200
M Probe 208 NT Yeast RNA ko RNA 1 ko RNA 2 ko RNA 3 wt RNA 1 marker 189 NT
ataaagggtgagGAAAGGACAGTGGGAGTGGCACCTTCCAGGGTCAA GGAAGGCACGGGGGAGGGGCAAACAACAGATGGCTGGCAACTAGAAG GGCACAGTCGAGGCTGATCAGCGAGCTCTAGAGAATtgaTCCCCTCA
AAGAACTCGTcaagaattcgatatcaagcttatc
KO 7d br KO 14d br WT 14d
Figure 10: RNase protection, RT-PCR and sequence of fmr1-tm1Cgrisoforms. (a) Upper panel: RNase protection
assay with 208 NT RNA probe spanning the U2fmr1-tm1Cgr
50- and 30 splice junctions. Two fmr1-tm1Cgr allele specific products are observed: a lower band of 167 NT and an upper
band of 185 nt. A third band of190 NT is common to KO,
W T a n d y e a s t R N A s a m p l e s . M¼m a r k e r s ( i n
nucleotides¼NT). Lower panel: exon 4 to exon 5 KO U2
splice sequence across the PGKneo insert sequence which allows production of a full length FMRP. The 153 base reverse strand neomycin sequence is in uppercase white and the 38 base polylinker sequence in lowercase white italics. Sequence from fmr1-tm1Cgr exon 4 and the 30 end of exon 5 are in lowercase black. Splice points are indicated with bold lettering. The 3 neoiso-U2/L primer pair, indicated with arrows, crosses the exon 4-neo and neo-polylinker splice junctions. GenBank accession number is AF179463. (b) RT-PCR products and their
DNA sequence from hybridfmr1-tm1Cgrmice using knockout
specific 3neoiso-U3/L primers. M¼markers; the product is
FXS testis volume is almost 100% larger than the 95th percentile of normal males (Butleret al. 1992). The average relative increase in KO testes weights for all strains measured here was 20.3% (Fig. 11), as compared to more than 150% for FXS males over the age of 17 years (Butleret al. 1992).
Discussion
It was our intent in these experiments to perform a survey of behavior offmr1-tm1Cgrmice on an F1 hybrid genetic back-ground, with an emphasis on working memory performance. Startle tests infmr1-tm1Cgrmice were originally performed with our C57BL/6JFVB/NJ (‘CxF’) F1 generation hybrid mice as proposed by one of us (RPB; Nielsenet al. 2002). Our rationale for use of such mice, created by crossing two inbred strains, was that the inbred strains themselves are known to carry a number of homozygous mutations which can substantially affect behavioral and cognitive testing. For example, C57BL/6J mice develop age related hearing loss (Johnson et al. 1997), while FVB/NJ mice carry the rd1
(Pde6brd1/Pde6brd1) allele for retinal degeneration and are therefore essentially blind as adults (Pittler & Baehr 1991). Murine genetic background has also been shown to affect the pre-pulse inhibition of the startle response, with C57BL/ 6J showing less inhibition than FVB/NJ (Paylor & Crawley 1997). In animals with an F1 hybrid genetic background, by contrast, the effects of recessive alleles should be largely reduced or eliminated. Therefore, these behavioral studies should more closely define the effect of the fmr1-tm1Cgr
allele itself in outbredMus musculuspopulations, and would be predicted to be more comparable to effects in other outbred species, such as humans.
Learning and memory
Several tests of learning and memory were performed with the hybrid mice. The MWM, Barnes maze and 8-arm radial maze can measure ability to learn the position of visual-spatial cues over a period of days. The 8-arm radial maze, as well as novel object and olfactory sequence memory tasks can assess shorter term or working memory, which is known to correlate well with intelligence in humans. The olfactory tests were specifically performed in order to assess memory for sequences of information, a task which should be quite relevant to deficits observed in humans with FXS.
Morris water maze
The MWM has been repeatedly used to testfmr1-tm1Cgr
KO mice (D’Hooge et al. 1997; Dutch–Belgian Fragile-X Consortium 1994; Kooy et al. 1996; Paradee et al. 1999), with mixed results. In the MWM, a rodent has to learn the position of a submerged, invisible platform in a pool, presum-ably using only distant fixed visual cues. The premise of the task is that a mouse or rat will be averse enough to floating or swimming in water that it will seek the most rapid means to exit by finding and perching upon a platform. Initial behav-ioral testing of the extant FX KO mouse (fmr1-tm1Cgr) on a C57BL/6J-129 mixed background showed that they had increased latency in the initial training trials and even more so upon the initial reversal trial (Dutch–Belgian Fragile-X Consortium 1994). Otherwise, however, the KOs learned at the same rate and achieved the same performance as the WT controls. There was no difference in the probe trials (in which the hidden platform was removed after its position had been learned). Absence of effect in a probe trial is important, since scoring of learning and memory may be more accurately reflected in this measure than in differences in latency to reach the platform (Gallagher et al. 1993; Hodges 1996). Further testing of MWM performance did not support the original difference in training trial latency between WT and KO animals (D’Hoogeet al. 1997), but did substantiate differences in reversal trials. Reversal results in animal tests may reflect mental flexibility (or conversely, tendency toward perseveration) and require cortical function, particularly of the frontal lobes (Divac 1972; Kolbet al. 1974). Reversal results are of particular interest in humans with FXS since related measures (e.g. elevated perseveration in the Wisconsin Card Sorting Test) have been shown to be affected (Cornishet al. 2001; Wildinget al. 2002). However, it was also demonstrated that even when the platform was visible, KO mice reached it significantly more slowly than WT littermates, suggestive of some motor or performance difference between the genotypes which might complicate interpretation of the results. In addition, there was no difference in probe trials between WT and KO for acquisition or reversal, suggesting that both remembered the general location of where the platform had been (before removal for the probe trial). It was concluded that the MWM results did Testis weights
60 80 100 120 140 160 180 200
C57 C57ko FVB FVBko HYB HYBko
Strain 111
134
108 126
141 174
***
**
***
mg
not support significant involvement of the hippocampus in thefmr1mutant allele’s effect (D’Hoogeet al. 1997). In yet further MWM tests, fmr1-tm1Cgr animals on a C57BL/6J background with more than 15 backcrosses showed no deficits in the MWM reversals compared to controls (both latency and probe), while animals of a C57BL/6J129RE/J F1 hybrid background were found to have elevated latency for the training blocks occurring on the first day compared to controls (Paradeeet al. 1999). Indeed, it was confirmed that normal 129/ReJ animals have a significantly increased swim latency compared to C57, so that such differences in latency observed previously may have been due to 129 alleles seg-regating with thefmr1-tm1Cgrmutation but removed during backcrossing to C57. A further study offmr1-tm1Cgron the C57 background again showed no difference in escape latency in the MWM (Peier et al. 2000). The results pre-sented here, which used F1 hybrids of FVB/NJ and C57BL/ 6J, further substantiate the likely negative effect of 129 alleles since no deficit was observed in the presence of FVB alleles. Therefore, it can be concluded that fmr1-tm1Cgron highly backcrossed C57BL/6J or F1 hybrid back-grounds that exclude most 129/ReJ alleles do not show deficits in standard MWM measures.
Barnes maze
In the MWM tests presented in this study, hybrid KO mice performed at least as well as if not better than their WT littermates, including in the reversal phase. This would tend to suggest that the KO allele itself does not promote a substantial deficit in performance of a standard MWM task, and by extension, the forms of visually based learning and memory examined. In order to further assess the meaning of the MWM spatial memory results, a Barnes maze was employed. The Barnes maze is a land-based circular maze in which mice are motivated to escape into holes located around the perimeter upon exposure to bright lights and noise. One advantage of the Barnes maze in testing mice is that they are generally less aquatic in habitat than rats, so their performance tends to be better in the land-based Barnes maze than in the presumably more stressful water mazes. In these experiments, we found that the KO animals acquired the task more quickly than WT littermates. The difference in performance was present from the very start of the testing (and then disappeared), as was the case for latency in the MWM. The results of Barnes maze probe trials in which the escape box was not present showed that the KO and WT entered the correct quadrant with the same frequency, but the WT animals stayed there signifi-cantly longer. This might mean that the WT had a more accurate memory of the location of the escape hole, or it might mean that the KO more quickly determined that no escape was present and left. Alternatively, WT mice may have had more apprehension that the buzzer would sound than the KO mice. (No buzzer was employed in the probe trial, but its use was required to get the mice to enter the
escape box.) In contrast to the absence of aversive stimulus in the Barnes maze probe trial, the aversive stimulus in the MWM probe trial (water) could not be removed. Given that no probe trial differences have ever been observed between WT and KO in the MWM, it is not possible to conclude without further investigation what the difference in probe data in the Barnes actually mean. In particular, a difference in search strategy between the strains (spatial vs. sequential search) may be an important factor (R. Brown, unpublished data; see also Wolfer et al. 1998 for MWM search strategies).
8-Arm radial maze
A more stringent test of spatially-based memory was desired to assess whether milder deficits in the KO mice might be revealed. An 8-arm radial maze was used in two tests with two different groups of hybrid animals. In one test, scored as previously described for the KO animals (Mineuret al. 2002), we initially observed, as Mineuret al. did, that the KO ani-mals appeared to acquire the task more slowly during the first week. However, we found that the performance of the KO became equivalent to the WT during the second week. If working memory is really measured by arm re-entry, as is assumed in this task, then we should conclude from such studies that the KO animals’ working memory improved over time. As this is very unlikely to be the case, it seems possible that such re-entries might reflect something other than work-ing memory, e.g. exploratory behavior, motivation for or comprehension of the task or a combination of such factors. Elevated reference memory errors (entry into arms never baited) by KO mice led to a significant difference in the first three days on radial maze I. Again, an elevation in KO exploratory drive early in the testing could explain the results. Alternatively, the KO animals may have been slightly slower to learn not to enter non-productive (unbaited) arms, possibly due to a slower formation of long-term memory during the first days of testing or less facility in comprehending the relationship between what was in the environment and the position of the baited arms.