72
RESEARCH ARTICLE
DEVELOPMENT,
VALIDA-TION & STRESS
DEGRA-DATION STUDIES OF
TRIPROLIDINE BY
RE-VERSE PHASE-HIGH
PER-FORMANCE LIQUID
CHROMATOGRAPHGY
(RP-HPLC)
PVSR Mohana Rao1, Tata Santosh2, Dr. K Raghu Babu1*
1Andhra University College of Engineering, Andhra
Universtiy, Andhra Pradesh, India.
2Corpuscle Research Solutions, Andhra Pradesh, India.
Date Received: 30th January 2016; Date Accepted: 11th February 2016 Date published: 12th February 2016
Email: drraghualways@yahoo.co.in
Abstract: Objective: To develop a simple, selective and precise and rapid reverse phase high performance liquid chromatography method for the development and valida-tion, stress degradation studies of Troprolidine in bulk and Pharmaceutical dosage forms. Methods: The chroma-tographic separations was performed by Agilent Polaris C18 column (150 X 4.6 mm id, ODS 2,5µ m) using
metha-nol: 0.1% ortho-phosphoric acid in water (65:35) as mobile phase at flow rate of 0.1 mL/min with injection volume 20 µL and the detection was carried out using UV detector at 232nm. The method was validated as per ICH guidelines.
Results: The retention time for Troprolidine was found to be 1.88 min respectively . The linear regression analysis data for the calibration plots showed good linear relation-ship in the concentration range of 1.01-10.05µg/mL. The correlation coefficient and percent recovery for Troprolidine were found to be 0.9989 and 100.66 respec-tively. The influence of Acid, Alkaline, Oxidative stress, Photolytic stress condition on Troprolidine was studied. Results indicated completed degradation in Alkaline me-dium. Conclusion: The developed method was success-fully validated in accordance to ICH guidelines. This
method is simple, selective, linear and precise accurate and sensitive and can be used for routine analysis of bulk samples.
Key words: Triprolidine; HPLC, Stress Degradation.
Introduction
Troprolidine is chemically 2-[(1E)-1-(4-methylphenyl)-3-(pyrrolidin-1-yl)prop-1-en-1-yl] pyridine ( Fig.1), Anti-allergic, Histamine H1 Antagonist that block the action of endogenous histamine, which subsequently leads to tem-porary relief of negative symptoms brought on by hista-mine. It is used for the treatment of seasonal or perenial allergic rhinitis or non allergic rhinitis, conjunctivitis and mild utricaria and angioedema[1]. The most common side
effects are sedation, dizziness, incordination,
gasrointestinal disturbances, nausea, vomiting and diar-rhea. It may also produce blurred vision, dryness of mouth, tight of chest, blood diorders including agranulocytosis and haemolyticanaenia[2]. Literature survey revealed that few analytical methods have been reported; determination of Troproline in plasma using Thin layer chromatography[3]; simultaneous determina-tion of Troprolidine with other anti-histamines [3][4][5]; other agents[6][7]; Few methods had been developed for determination of Troprolidine by HPLC[8] and Spectro-photometric method[9]; SpectroSpectro-photometric and High Performance Liquid Chromatographic [10]. Determina-tion of Troprolidine and its metabolite in biological sam-ples using liquid chromatography-mass spectrometry[11]. Capillary Zone Electrophoresis Method for Quality Con-trol Analysis of Troprolidine with other drugs[12]; Deg-radation studies of Troprolidine and Stability indicating UPLC method[13]; New plastic membrane and carbon paste ion elective electrodes for determination of troprolidine[14]. Tropolidine is usually administered in combination with dextromethorphan and/or phenylpro-panolamine and also with paracetamol. [15]
2. EXPERIMENTAL
2.1 Reagents and Chemicals
Methanol (HPLC grade, Merck Ltd), Milli-Q water, Troprolidine (Reference standard purchased from Sigma Aldrich, USA), 0.1% Ortho-Phosphoric acid (GR Grade, SD Fine Chem Ltd). All other chemicals are of the highest grade commercially available unless otherwise specified.
2.2 Instrumentation
The chromatographic system consisted of a Shimadzu Class VP Binary pump LC-10ATvp, SIL-10ADvp Auto sampler, CTO-10Avp Column Temperature Oven, SPD-10Avp UV-Visible detector. All the components of the system are controlled using SCL-10Avp System Control-ler. Data acquisition was done using LC solutions soft-ware.
2.3 Chromatographic Conditions
The mobile phase consisted of 65:35 % (v/v) of Methanol & 0.1% Ortho-phosphoric acid operated on isocratic mode. The flow rate is 1.0 ml/min. Chromatographic de-termination of Troprolidine was performed on Agilent Polaris C18 column (150 X 4.6mm id, ODS 2,5µm). The
ef-fluent was monitored by UV detector at 232. The injection volume is 20µL.
2.4 Preparation of Standard solutions
Stock solution of Troprolidine was prepared by dissolving 10 mg drug in diluent solution (50:50 % v/v Methanol & Milli-Q water), Sonicated and then make the volume upto 100mL. The concentration of stock solution was found to be 100 µg/mL. The working standard solutions of Triprolidine was prepared by taking suitable aliquots of drug solution from the working stock solution and the volume was made upto 10 mL with mobile phase to get concentrations of 1.01 to 10.05. These solutions were fil-tered through 0.45µ membrane filter before injection and 20µL of solution was injected to the chromatographic sys-tem.
2.4.1 Preparation of sample solution
Ten tablets of Troprolidine were taken individually and
their weight is taken. The average weight of each tablet is calculated. Tablet powder equivalent to 1 tablet powder is then weighed accurately and transferred into a 100mL volumetric flask. 70mL of diluent was then added and sonicated to dissolve it completely and made volume up to the mark with the diluent. The solution is mixed well and filtered through 0.45µm filter. 1mL of the solution is then transferred into a 10mL volumetric flask and diluted up to the mark with diluent. The final solution was mixed well. This mixture is then carefully filtered using 0.45µm membrame filter. The filtrate is then taken and suitably diluted and injected for analysis. The assay content was evaluated using the regression equation of linear calibration curve.
3. RESULTS AND DISCUSSION
HPLC separation of Troprolidine was carried out on a Agilent Polaris C18 column by an isocratic elution with of
Methanol & 0.1% Ortho-phosphoric acid (65:35 % v/v). The flow rate was constant at 0.8mL/min and the column temperature was at ambient temperature. The UV wave-length was set at 232 nm. No interference from diluents, impurities or excipients present in the pharmaceutical formulation was observed at this detection wavelength. Before each run LC column was equilibrated with the mobile phase for about 15 min. A sharp, symmetrical peak was obtained for Troprolidine when analyzed under these conditions a. This retention time enable rapid determina-tion of the drug, which is important for routine quality control analysis. A typical chromatogram showing the separation of the drug is given in Fig-2.
System suitability test was established from six replicate injections of a solution containing Troprolidine 5 µg/ml. The percent relative standard deviation (RSD) of the peak area was calculated. The peak tailing for drug was meas-ured. A useful and practical measurement of peak shape, the peak tailing and theoretical plate count was deter-mined. The proposed method met these requirements within the United States Pharmacopoeia (USP) accepted limits (Tailing factor < 1.5, Theoretical plates > 2000). The stability of Troprolidine in solution was investigated in the method development phase. six solutions containing 10 µg/ml of Troprolidine were tested. The solutions were stable during the investigated time and the RSD was < 1.0% for retention time (min), peak area and height. The solutions were shown to be stable with no significant change in Troprolidine concentration over this period Table.1 .
Method Validation
Linearity
74
1.02, 2 ,4, 6, 8 and 10.05 µg/ml. Each solution was injected calibration plot was prepared. Linearity was evaluated by linear least-squares regression analysis. Good linearity was observed over the concentration range evaluated
(1-10 µg/ml) as shown in the linearity curve in Figure 3. The correlation coefficient was found 0.999. The results are tabulated in Table 2
Table 1. System Suitability test for Triprolidine
S.No Retention Time Peak Area Theoretical Plates Tailing factor
1 1.88 389705 5993 1.73
2 1.88 383481 5949 1.74
3 1.88 385619 6092 1.74
4 1.89 381912 6099 1.74
5 1.88 390329 5918 1.70
6 1.88 399277 6186 1.74
Mean 1.88 388387 6039.50 1.73
Std.Dev 0.00 6288.99 102.83 0.02
Table 2. Statistical data of Linearity for Triprolidine by RP-HPLC method
Parameter Value
Absorption maximum (nm) 232
Linearity range (µg/mL) 1.01-10.05
Regression equation Y = 77251x - 25547
Correlation coefficient R2 = 0.9989
Slope 77251
Intercept 25547
Table 3 : Precision of the proposed method
Conc. (µg/mL) Intra-day Precision Inter-day Precision
Mean Area % RSD Mean Area % RSD
2.51 220960 1.06 220006 1.41
5.03 418350 0.67 417584 0.80
7.54 613135 0.80 610544 1.47
Table 4: Accuracy of the proposed method
Theoretical Conc. (µg/mL)
Measured Conc. (µg/mL) % Recovery % RSD
2.51 2.51 ± 0.03 100.66 1.20
5.03 5.09 ± 0.04 101.12 0.71
7.54 7.61 ± 0.06 100.96 0.83
Table 5. Sensitivity of Triprolidine by HPLC
LOQ LOD
S.No Retention Time Peak Area S.No Retention Time Peak Area
1 1.88 38678 1 1.88 18678
2 1.89 37459 2 1.89 18459
3 1.88 38187 3 1.88 19187
Mean 1.88 38108 Mean 1.88 18774
Std.Dev 0.01 613.33 Std.Dev 0.01 373.50
76
Table 6. Robustness Data Parameters Optimized
method
Used adopted
for ro-bustness
Peak Area Retention Time
USP plate count
Tailing
Flow rate (ml/min﴿
(± 0.1)
1.0 mL 0.9mL/min 394449 1.85 3021 2.0
1.0 mL/min
380337 1.88 6046 1.74
1.1 mL/min
486060 2.26 3527 1.8
Mobile Phase (± 5% Organic
Com-position)
65:35 (%) 70:30 527487 1.78 1791 1.9
65:35 382620 1.88 6036 1.73
60:40 378941 2.03 3183 2.0
Table 7: Stress Degradation study data for Triprolidine
Degradation Condition Peak Area Peak Area (%)
Acidic hydrolysis (0.1% HCl) 417204 100.3
Oxidation (5% H2O2 ) 417038 100.3
Photolytic degradation (UV light) 422803 101.7
Control sample 415627 -
Precision
The precision of the method was investigated with respect to repeatability and intermediate precision. The repeata-bility (intra-day precision) of the method was evaluated by assaying three replicate injections of the Troprolidine at 100% of test concentration (5 µg/ml) on the same day. The %RSD of the retention time (min) and peak area were calculated. Intermediate precision (inter-day precision) was demonstrated by evaluating the relative peak area percent data the LC system at three different concentra-tion levels that cover the assay method range (2-10 µg/ml). The %RSD of the system was calculated from the individual relative percent peak area mean values of the test concentration (Table 3). The intra-day (n= 3) and inter-day (n= 3) %RSD are given in table. All the data are within the acceptance criteria of 2%.
Accuracy
Accuracy of the method was evaluated by fortifying a Troprolidine sample solution (with respect to the target assay concentration) with three known concentrations of reference standard ( 2, 5 and 7 µg/ml). Percent recoveries were calculated form differences between the peak areas obtained for fortified and unfortified solutions. Good re-coveries were obtained within the acceptance criteria (98.0-102.0%) as shown in Table 4.
LOD & LOQ
Limits of detection (LOD) and quantification (LOQ) were estimated from both linearity calibration curve method and signal to noise ratio method. The detection limit was defined as the lowest concentration level resulting in a peak area of three times the baseline noise. The quantification limit was defined as the lowest concen-tration level that provided a peak area with signal to noise ratio higher than 5, with precision (%CV) and accu-racy with (±) 20%.
Limit of Detection (LOD) and Limit of Quantifica-tion(LOQ) were calculated based on calibration curves. They were expressed as LOD = (3.3× σ)/S; LOQ = (10× σ)/S (where σ is the standard deviation of the y-intercepts of the regression line and m is the mean of the slope of the calibration curve). The method is found to be sensitive which can be determined from the data obtained from the (Table 5).
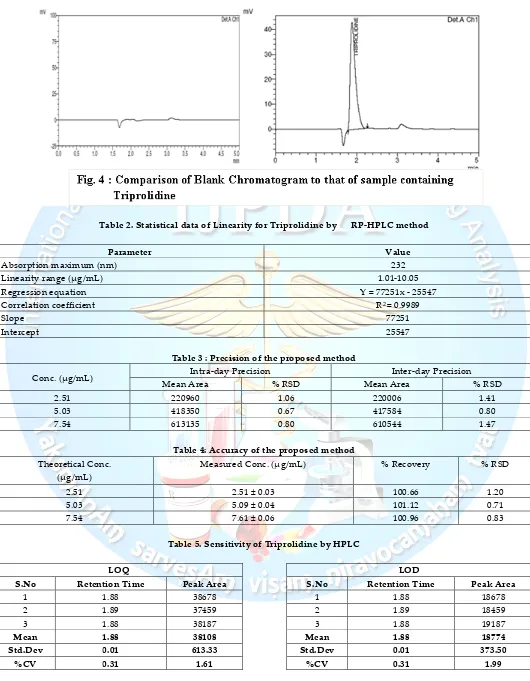
Specificity
taken as acceptance criteria for the analyte. Sample Specificity is also observed in the degradation study of the drug. None of the degraded products must interfere with the quantification of the drug. Specificity of the method was observed by injecting the blank and work-ing standard solutions of Triprolidine. The specificity was determined by comparison of the blank chromato-gram with that of the Standard chromatochromato-gram (Fig. 4).
Robustness
Robustness of the method was evaluated by the analysis of Troprolidine under different experimental conditions such as changes in the organic composition of the mobile phase and flow rate. The percentage of methanol in the mobile phase was varied ±10%, the flow rate was varied ± 0.1 ml/min. Their effects on the USP plate count, USP tail-ing at 10%, recovery and repeatability were studied. De-liberate variation of the method conditions had no signifi-cant effect on assay data or on chromatographic perfor-mance, indicating the robustness of method and its suita-bility for routine use and transfer to other laboratories. The results from robustness testing are presented in Table 6.
Stress Degradation Studies
For Stress Degradation Analysis, 1 mL aliquots (in dupli-cate) of samples containing MQC level concentration are treated separately with 100 µL of 0.1N HCl (Acid stress), 0.1N NaOH (Alkaline stress), 5% v/v Hydrogen Peroxide (Oxidative Stress), for 24 Hrs. Samples for Photolytic stress are placed in a transparent glass vial & placed in a UV chamber for 24 Hrs. Samples are then injected for analysis. The results of analysis are then compared with similarly prepared fresh samples.
The stress studies involving acid, light (UV) and oxida-tion revealed that Troprolidine was not fully degraded. However in alkaline conditions (0.1N NaOH), the drug was instable and the degradation peak eluted earlier ac-companied with a drastic peak distortion and increased tailing. Except for alkaline conditions, the drug content was within 95 –105 % for all stress conditions indicating the stability and specificity of the analytical method to differentiate the degradation peaks. (Table-7)
CONCLUSION
A rapid, accurate and precise isocratic RP-HPLC method has been developed. The developed was found to be sim-ple and have short run time which makes them method rapid. The chromatographic run time of 10 min allow analysis of lot of samples in a short period of time. There-fore, the method is suitable for analysis of large samples during routine analysis of formulations and raw materi-als. Nevertheless, the results of the study indicate that the
developed HPLC method is simple, precise, accurate and less time consuming.
ACKNOWLEDGEMENT
The authors are thankful to Mr. Santosh Tata, Corpuscle Research Solutions, Visakhapatnam, India, for providing the necessary facilities to carry out this work.
Conflict of Interest
Authors do not have any conflict of interest in this re-search work.
REFERENCES
1. Drug Profile, "Triprolidine"
http://www.mims.com/Troprolidine
2. Reynolds, J.E.F. 1982. Promethazine and other anti-histamines. In: Martindale: The Extra Pharmacopoeia, 28th Edition, pp.1294. The Pharmaceutical press, London.
3. R.L. Deangelis, M.F. Kearney and R. M. Welch. (1997). Determination of troprolidine in human plas-ma by quantitative TLC. Journal of Pharplas-maceutical Sciences.66 (6), 841-843.
4. Arvind Gupta, Rajesh Kumar Nema, Atul sahu.
(2009). Simultaneous estimation of Phenylpropano-lamine hydrochloride and Triprolidine hydrochloride in pharmaceutical preparations by RP-HPLC method. The Pharma Research.1;67-71.
5. Hetice Caglar, Ebru Buyuktuncel.(2014). HPLC
meth-od dvelopment and validation: Simultaneous deter-mination of active ingredients in cough and cold Pharmacueticala. International journal of pharmacy and pharmaceutical sciences. 6(10), 421-428.
6. Yasser EL-Shabrawy, Alaa El-Gindy, Maisra
Al-Shabraw Shoeib and Yassmin El-Gindy. (2014). An HPLC method for Determination of 15 Pharmaceuti-cal compounds in Anti-cold Products. Standard Re-search Journal of Pharmacy and Pharmacology. 1(4), 86-94.
7. Alaa El-Gindya, Khalid Abdel-Salam Attiab, Mo-hammad Wafaa N assarb, Hamed Abu Aeadab and Maisra Al-Shabrawi Shoeibc. (2013). HPLC method for determination of Paracetamol, Psudoephedrine, Triprolidine, Methylparaben, Propylparaben, Sodium Benzoate and other related substances in Pharmaceu-tical syrup. Journal of liquid cheomatography & re-lated technologies. 36(9), 1251-1263.
8. Basel M. Saida, Shrhabeel A.Alabjaw, Fawaz Deabas, Munib M. Saket, Rami Shareiah and Eyad S. M.Abu Nameh. (2014). Liquid chromatographic Method for the Determination of Triprolidine. Journal of chemi-cal and Pharmaceutichemi-cal Research, 6(8), 327-332. 9. Amina Mumtaz, Asrar A.Kazi, Tehseen Aman, M.
Usman Sabri and Fauzia Noureen. (2005).
Spectrophoto-78
metric method in pure and pharmaceutical preparartions using Dichloronitrobenzene as a new cheomagenic reagent. Proc.Pakistan Acad.Sci. 42(4), 253-259.
10. Madhuri Hinge, K.R.Patel and R.J.Mahinda. (2015). Spectrophotometrioc and High performance liquid
chromatographic determination (HPLC) of
Triprolidine and Pseudoephedrine hydrochloride in Tablet dosage form. Pharm Method. 15(6), 87-93.
11. Hansen EBJr, Getek TA, Korfmacher WA. (1989).
Ap-plication of HPLC-Thermospray ionization mass spectrometry for the analysis of Triprolidine and its metabolite hydromethytriprolidine in biological samples. J Anal Toxicol. 13(3), 185-187.
12. Sonia Di Berardino, Renata Jasionowska. (2014). Rap-id and sensitive CZE (capillary zone electrophoresis) method for Quality Control analysis of Pharmaceuti-cals containing Pseudoephedrine, Triprolidine and Paracetamol. American Journal of Analytical Chemis-try.5;613-619.
13. Mahesh Kumar Moneab, K.B. Chandrasekh & Samir Vyasa. (2011). Degradation studies of Troprolidine:
Isolation, Characterization of oxidative
Degradationproducts and Development of a validat-ed stability indicating indicating method UPLC method. Journal of Chromatography & Related Tech-nologies. 34(8), 652-669.
14. Zayed, S.I. 2004. New plastic membrane and carbon paste ion selective electrodes for the determination of Troprolidine. Anal. Sci. 20:1043-1048.
15. C E Bye, J Cooper, D W Empey, A S Fowle, D T Hughes, E Letley, and J O'Grady (1980﴿ Effects of pseudoephedrine and triprolidine, alone and in com-bination, on symptoms of the common cold.Br Med J. 1980 Jul 19; 281(6234): 189–190.
16. Guidance for Industry: Analytical Procedure and methods Validation: Chemistry, Manufacturing and Controls Documentation; Draft Guidance. Rockville, MD. UD FDA. 2000,