Abstract— A study has been conducted to examine the influence of attitudes and behavior of the community for mitigation and flood hazard control on social impacts due to flood increase. The study was conducted in the watershed area of Tondano River that is located in the River Area Development PWS-9 in North Sulawesi Province. This study utilized the purposive sampling technique for data acquisition with 125 respondents living in the vicinity of the watershed. The analysis shows a negative influence between attitudes and behavior towards the social impact caused by flooding. The negative effect indicates that the higher in attitudes and behavior, the social impact caused will be lower. This means that if the community's attitudes and behavior go higher (or better) that are seen from the attitudes towards flood resulting activities, attitudes towards responsibility, and attitudes towards hazard prevention, the social impact due to flooding received by the community will be lower, which could be seen from the presence of residential pools, pools in the river, and other forms of damage.
Index Term— Tondano River, flood, social impact, natural hazard mitigation, community attitude
I. INTRODUCTION
RIVER is a multi-function natural resource vital to human life. The main functions of a river are as the source of drinking water, power generation, irrigation for rice/agricul-tural fields and aquaculture, transportation, supply of building materials, tourism and so on. In fact, this non renewable natural resource currently has a very concerning condition regarding its water debit and quality.
Besides its broad potential and important benefits, a river is often a source of danger to human. Flood could cause huge material losses as well as loss of life. Flooding makes up about 40 per cent of all natural disasters that occur worldwide [1].
This work was supported by the Ministry of Education and Culture, Republic of Indonesia through Postgraduate scholarship (BPPS) to M.K. M. Kumajas is a PhD candidate at the Graduate School of Environment and
Development Study, Brawijaya University, Malang 6514 Indonesia and a lecturer at the Dept. of Physics Education, State University at Manado, Tondano 95618, Indonesia (Corresponding author, phone: +62-431-321845;
fax: +62-431-321866; e-mail: [email protected]). Z. Kusuma and K. Hidayat are with the Graduate School of Environment and Development Study, Brawijaya University, Malang 65145, Indonesia.
J. Husain is with the Dept. of Soil Science, Faculty of Agriculture, Sam Ratulangi University, Manado 95115, Indonesia.
Many studies have been conducted to improve and implement the control on the function and the impacts caused by the river [2-13]. They were conducted comprehensively and intensively that also involved the surrounding and affected community for their reception and perception [5, 10, 14-16]. The study also has considered the risk on public health [1, 17-19].
Watershed is an area that is an integral part of the river and its tributaries, which serves to hold, store and drain water from rainfall to the lake or to the sea. Its border is a topographic separation between terrestrial and aquatic area that is still affected by the activities on the mainland. One or more watersheds and/or small islands covering an area of ≤2000 km2 form a unity of natural resources management area called the River Basins (Article 1 of Law no. 7/2004).
The Tondano watershed in North Sulawesi Province is located in the River Area Development PWS-9. The Tondano watershed occupies two districts and one township: Minahasa District, North Minahasa District and the City of Manado. Economically, the watershed has been beneficial to the communities from the upstream to the downstream. The utilization of Tondano River estuary has been increasingly diverse and growing from time to time.
In the area near the estuary nowadays, the Tondano River has been used as a source of drinking water for the Manado City population and river sand mining by people around the Kairagi Bridge. The need for drinking water and other uses will likely be increasing with the increasing number of population in Manado. On the other hand, the flooding of Tondano River has repeatedly caused material damages to the surrounding areas and to the public in general [20]. In recent years almost every flood has always submerged residential area in the city of Manado [11]. Prevention of environmental impacts of Tondano River, especially in areas along the estuary is still a problem to be solved and anticipated.
Theoretically, the increase in flooding will increase the force produced by the water flow carrying suspended load. On the other hand, the impact of the riverbed erosion will be increasing due to the increase in momentum of the flow with the base material transport (bed load transport). Measurements carried out by the Center for Environmental Management of the Ministry of Environment in the Tondano estuary area in 2007 concluded that the discharge of the sediment transport
Community Attitudes and Behavior and Its
Influence toward Social Impacts of Flood in
Tondano River Estuary, Indonesia
increased more significantly than the increase in flow rate in the event of flooding. This fact indicates erosion in the upstream side that also shows the high potential of environ-mental damage mainly due to increase in momentum and drag forces in the event of flooding.
This study examined the effect of community's attitudes and behavior for mitigation and flood hazard control purposes on social impacts due to flood increase.
II. THEORETICAL REVIEW
A. Community's Attitudes and Behavior towards Flood Floods are often considered as natural disasters when humans inhabit flood-prone areas. An increasingly rapid population growth has led to the disaster-prone areas being quite densely populated and had accepted the risk of flooding due to the difficulty of finding a more secure area.
Developed countries have long been fighting the flooding. The United States, for example, has spent billions of dollars since 1936 to protect people from flood disasters [21]. However, it remains an annual flood risk to prone area’s residents. Even the threat of flooding has grown up because the residential are built in the flood-prone areas faster than the speed of the engineers in designing better protection for them.
Rapid population growth combined with a lack of effective management of resources has led to the emergence of new types of flooding. Many upstream areas of the forest to "catch" the water are converted into animal pastures and farmlands in Indonesia (Anonymous, 2007), so that the reservoir basin capacity is becoming much less to keep the incoming water. The soil that is no longer bound by the tree’s roots is prone to landslides, increasing the risk of multiple disasters. The river banks previously filled with plants as a security "fortress" for surrounding area has been deforested, and then collapsed, causing river water to flow more easily towards the lower lands. Flooding also becomes more frequent, more sudden and its effects are more severe.
B. Community's Attitudes and Behavior towards Flood Mitigation
The community's participation is a technical process to provide wider opportunity and authority to the community to solve various problems together. This delegation of authority is based on the level of participation (level of involvement) of the community in the activities. Community participation aims to find better solutions to the problems in the community by opening up more opportunities for people to contribute so the implementation of the activities will run more effective, efficient, and sustainable.
Integrated watershed management involves the community. Therefore, the watershed planners and policy makers have to understand and pay attention to the issues, needs and wishes of the people who live and work in the watershed zone. Human activities are part of a variety of ecosystem functions; and it is impossible to understand the environment and manage the resources without understanding the user community. All members of the local community are interested parties and
participate in general and economic activities. The community is in fact a group of people who is a key to the integrated management of watersheds.
It is stated in the Government of Indonesia Act No. 7 year 2004 on Water Resources article 16 that the management for watershed that occupies multiple districts and cities is in the hand of the Provincial Government. The watershed management is but the management of water resources related to the aspects of water resource itself, the community and institutions [22]. Fig. 1 shows the interaction between the three aspects of the Integrated Water Resources Management (IWRM).
Fig. 1. The Integrated Water Resources Management (IWRM) and its impor-tant elements (adapted from Hidayat and Solichin [22]).
The flood authority is in general grouped into three:
a)The beneficiaries: the people who receive benefit/impact directly or indirectly;
b)The intermediaries: the community groups or individuals who can provide or facilitate the consultation on flood control, among others: consultants, experts, NGOs, and professionals in the field of natural resources; and
c)The decision/policy makers: the agency/institution author-ized to make decisions and legal basis such as government agencies and water resource board.
In line with public demands for openness in government programs, the accountability of government can be judged from the standpoint of the extent of public participation and other related parties (stakeholders) in programs development. Community participation is implemented starting from the concept stage of manufacturing activity, construction, opera-tion, maintenance, and evaluation and supervision. The deter-mining of stakeholders and sorting was done by the method of Stakeholder Analysis that was done through four stages of the process, which are: (a) identification of stakeholders, (b) assessment of stakeholder interest in flood control activities, (c) assessment of the degree of influence and interests of each
Natural Resources
Social and economic activities
IWRM
Community
Water infra-structure
Laws and regulations
stakeholder, and (d) the participation of stakeholders in the formulation of strategies at each phase of flood prevention activities.
III. METHODS
The research was conducted in the Tondano watershed area situated in the River Area Development PWS-9 in North Sulawesi Province. This study employed the purposive sampling technique for data collection on 125 respondents who live around the Tondano watershed.
The analysis tool used was the correlation analysis. In the questionnaires taken we had three indicators to measure the attitudes and behavior: attitudes toward activities that result in flooding, attitudes toward community responsibility, and attitudes toward flood prevention and mitigation. Whereas the impacts were measured by three indicators: the impact of the settlement flood, the impact of non residential flood, and impact on the damages caused.
In the study of relationships, two variables are said to be correlated if change in one variable is accompanied by change in the other – either in the same or reverse direction. In doing so, we employed the Perason’s Product Moment correlation using rough numbers of Pearson [23]. The relationship we would like to asses was between the attitudes and behavior variables (X) and the social impacts (Y). The Pearson correla-tion coefficient (r) is given by:
2 2
2
2
XY
N XY X Y
r
N X X N Y Y
(1)
The correlation is regarded as significant if the correlation Sig value is <0.05, whereas the correlation is non-significant if the correlation Sig value is >0.05.
The results of the survey using a 6-response-score question-naire (score of 1 to 6) were used to interpret the mean scores on five levels as follows [24]:
1.Average score between 1.00 and 1.99 indicates a very low level (very dangerous).
2.Average score between 2.00 and 2.99 indicating a low level (dangerous).
3.Average score between 3.00 and3.99 indicating a medium level (not dangerous neither harmless).
4.Average score between 4.00 and 4.99 indicates a high level (not dangerous).
5.Average score between 5.00 and 6.00 indicates a very high level (absolutely not dangerous).
IV. RESULTS AND DISCUSSION
A. Social Community Impact due to Increased Flooding The environmental condition of the surface was measured on four aspects. The first is the distance of the house from the river. The second is the distance of the creek from the house. The third is the height of the land from the river surface during
low tide and no flood. The fourth is the inundation condition of the land. Fig. 2 shows the distance of the houses from the river and its tributaries from the survey.
(a)
(b)
Fig. 2. The bar chart showing the distance of the houses from the river (a) and its tributaries (b) from the survey. Boxes on the charts indicate the safe distance according to the Indonesian Government Regulation (articles 11 and
12 of the Government of Indonesia Regulation No. 38 year 2011).
Fig. 2 reveals that the majority of respondents (20.8%) own a home located 20-40 meters from the river and 30.4% of respondents own a home located more than 40 meters from the tributaries. This shows that the distance of houses is far enough from the river and tributaries. Distance from the river score is 3.71 which is in the category of medium that is not dangerous neither harmless. While the distance from the tributaries score is 4.27 that is in the category of harmless. Thus, the environmental conditions of the settlement are still in the category of not yet dangerous.
The water levels during flooding and at the time of no flood are presented in Fig. 3.
surface height from the riverbed and the flood inundation level when in flood are categorized not dangerous.
(a)
(b)
Fig. 3. The levels of water at the time of no flood (a) and during the floods (b) obtained from the study.
Table I presents the puddle condition in each resource and the disruption potential due to flooding that were measured in two aspects, the puddle condition and the form of damage. It shows
that the new cattle farm area is inundated only 0.5 meter (rated by 12.8% of respondents). The fish ponds and mini gardens are flooded up to 1 meter. The houses, toilets, dug wells, drainage and garbage collection area have been flooded up to 1.5 meters. The boat mooring area and cloth washing spots were inundated up to 2 meters, and the fishing area and rivers crossing spots were inundated up to 2 meters.
The magnitude of the score shows the danger level of each inundated property/resource. There is one property/resource, i.e. the cattle farm area, in no danger state. Other eight properties/resources, i.e. the houses, fish ponds, washing spots, garbage stations, dug wells, and toilets, are in the medium level condition. Two properties/resources (the drainage and boat mooring) are in the danger category. The river crossings and fishing areas are in the category of very dangerous. Therefore, the properties/resources possessing high risks of flooding hazard is the drainage, boat moorings, fishing areas, and the river crossings with dangerous condition in term of flood impact.
Table II presents the forms of damage by flooding on each type of property/resource. The table shows that the houses, dug wells, and washing spots are safe from the flooding (not damaged). Water infiltration occurred in toilets, fish ponds and, mini gardens. The drainage, garbage collection stations, and the crossings are slightly damaged by the formation of water pools although it can still be used. The only property that could not be utilized is the boat mooring, whereas the fishing area was destroyed and partly washed away by the flood.
TABLEI
PUDDLE CONDITIONS ON EACH PROPERTY/RESOURCE (BOLD FIGURES ARE THE MAXIMUM VALUES)
Property/Resource Percentage of Answer on the Puddle Conditions Average Score*
0 m 0.5 m 1 m 1.5 m 2 m >2 m
Houses 9.6 18.4 20.8 26.4 15.2 9.6 3.48
Bathrooms/Toilets 2.4 8.8 25.6 30.4 23.2 9.6 3.92
Water wells 2.4 4.8 23.2 28.0 20.0 6.4 3.92
Drainage 0.8 9.6 26.4 26.4 23.2 13.6 4.02
Garbage/waste collection stations 0.0 12.8 24.8 30.4 23.2 8.8 3.90
New cattle farms 11.2 12.8 0.0 0.0 5.6 6.4 2.87
Fish ponds 0.0 3.2 8.0 3.2 5.6 0.0 3.56
Mini gardens 1.6 8.0 9.6 4.8 6.4 2.4 3.41
Boat moorings 0.0 1.6 6.4 19.2 33.6 19.2 4.78
Washing spots 0.0 23.2 18.4 19.2 25.6 9.6 3.79
Fishing areas 0.0 2.4 6.4 11.2 12.8 47.2 5.20
River crossing areas 0.0 0.0 6.4 4.8 6.4 42.4 5.41
TABLEII
The damage condition on each property/resource (BOLD FIGURES ARE THE MAXIMUM VALUES)
Property/Resource Percentage of Answer on the Damage Conditions Average Score*
1 2 3 4 5 6
Houses 32.0 29.6 10.4 8.8 11.2 8.0 2.62
Bathrooms/Toilets 8.0 32.0 27.2 8.0 14.4 3.2 2.98
Water wells 23.2 23.2 20.8 14.4 3.2 0.0 2.42
Drainage 19.2 20.8 39.2 8.8 12.0 0.0 2.74
Garbage/waste collection stations 4.8 24.0 43.2 13.6 12.8 1.6 3.10
New cattle farms 0.0 3.2 1.6 4.8 0.8 1.6 3.67
Fish ponds 0.0 11.2 4.8 4.0 0.0 0.0 2.64
Mini gardens 4.8 12.0 6.4 3.2 1.6 0.0 2.46
Boat moorings 0.0 0.0 12.8 19.2 14.4 6.4 4.27
Washing spots 61.6 19.2 16.0 3.2 0.0 0.0 1.61
Fishing areas 1.6 2.4 6.4 9.6 14.4 5.6 4.24
River crossing areas 3.2 11.2 21.6 15.2 6.4 2.4 3.29
*) The average scores represent the average score determined from the respondent answers on the 1-6 scale.
The forms of damage are: 1 = no damage, 2 = water infiltration, 3 = inundated but usable, 4 = inundated and unusable, 5 = par tial destruction, 6 = total destruction.
Table II presents the forms of damage by flooding on each type of property/resource. The table shows that the houses, dug wells, and washing spots are safe from the flooding (not damaged). Water infiltration occurred in toilets, fish ponds and, mini gardens. The drainage, garbage collection stations, and the crossings are slightly damaged by the formation of water pools although it can still be used. The only property that could not be utilized is the boat mooring, whereas the fishing area was destroyed and partly washed away by the flood.
The magnitude of the score shows the damage level on each property/resource caused by the flood. Table II shows that the washing spots are not damaged, while the wells, mini gardens, houses, fish ponds, drainage, and toilets are in no danger. The garbage stations, river crossings, and livestock area are in a mild damaged condition. The fishing area and boat moorings are in dangerous damaged condition. Thus, the fishing area and boat moorings damages caused by the flooding are the most dangerous.
TABLEIII
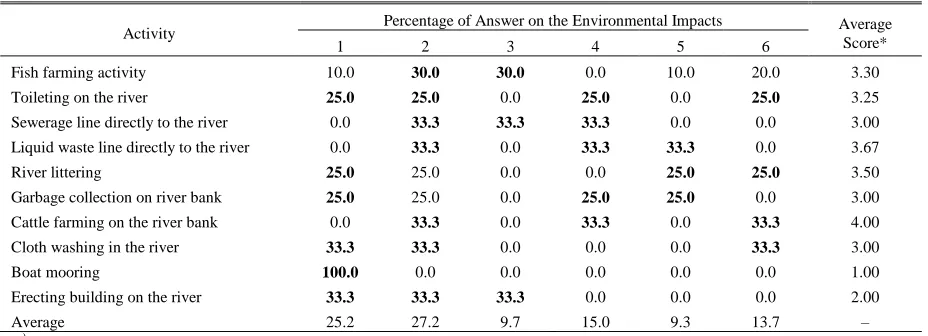
ENVIRONMENTAL IMPACTS DUE TO HUMAN ACTIVITIES IN THE RESIDENTIAL AREA
Activity Percentage of Answer on the Environmental Impacts Average Score*
1 2 3 4 5 6
Fish farming activity 10.0 30.0 30.0 0.0 10.0 20.0 3.30
Toileting on the river 25.0 25.0 0.0 25.0 0.0 25.0 3.25
Sewerage line directly to the river 0.0 33.3 33.3 33.3 0.0 0.0 3.00 Liquid waste line directly to the river 0.0 33.3 0.0 33.3 33.3 0.0 3.67
River littering 25.0 25.0 0.0 0.0 25.0 25.0 3.50
Garbage collection on river bank 25.0 25.0 0.0 25.0 25.0 0.0 3.00 Cattle farming on the river bank 0.0 33.3 0.0 33.3 0.0 33.3 4.00
Cloth washing in the river 33.3 33.3 0.0 0.0 0.0 33.3 3.00
Boat mooring 100.0 0.0 0.0 0.0 0.0 0.0 1.00
Erecting building on the river 33.3 33.3 33.3 0.0 0.0 0.0 2.00
Average 25.2 27.2 9.7 15.0 9.3 13.7 –
*) The average scores represent the average score determined from the respondent answers on the 1-6 scale.
Human activities on or near the river also have impacts to the environment. Table III presents the environmental impacts from activities in the surrounding residential areas.
We can see from Table III that the river flow disruption (1) is mainly caused by constructed toilets on the river, throwing garbage into the river, putting trash in a dump on the river bank, washing clothes in the river, mooring boats, and erecting buildings on the river.
Decline in the water quality or increase in environmental pollutants (2) is influenced by the fish farming in fish pond, toilets on the river, sewerage into the river, liquid waste channels into the river, cattle farming on the river banks, washing clothes in the river, and constructing buildings on the river. The shallowing of the river and the increasing pool area (3) are affected by the activities of fish farming in fish pond, sewerage into the river, and putting up buildings in the river. The existence of health risks or the emergence of certain diseases (4) are affected by the presence of toilets on the river, sewerage channels into the river, liquid waste channel into the river, putting garbage in landfills on the riverbank, and cattle farms on the river bank. The trash piling up in the Manado beach/bay (5) is due to discharging liquid waste directly into the river, throwing garbage into the river, and putting garbage in landfills on the river bank. The sea water quality degradation of Manado bay (6) is allegedly due to the activities of toilet constructions on the river, throwing garbage into the river, cattle farming on the river bank, and washing clothes in the river stream.
The community activities that cause the severest environmental damage are cattle farming on the river bank, followed by liquid waste discharging into the river and trashing rubbish into the river. The severest environmental impact due to human activities is the decreasing in the water quality and increasing environmental pollution substances (2). In the second place is the river flow disruption (1); and health problem with emerging certain diseases is ranked number three as the impacts of human activities near or on the river.
B. Understanding Public Attitudes and Behavior in the Context of Hazard Mitigation and Flood Control
In this study, flood impacts were seen from the following five events: flooding to resources, lost of resources, accumulation of garbage and mud, health problem, and disruption on water availability. The five impacts of flooding are due to the following causes: 21.44% of the community considered that the floods were caused by natural factors; 18.56% of the respondents observed it as a result of shitting in the river; 15.20% of them saw it was caused by building constructions on the river, 13.44% believed it was resulted from waste disposals in the river, 11.36% thought it was due to sewerage disposal to the river, 8.64% judged that it was due to
deforestation in the upstream area, 7.84% believed it was from waste disposal in upstream area, and 3,52% of the respondents saw it as a result of river deflection.
After finding out the cause of flooding, we will discuss how people react to it. Activities have impacts on the environment and require public attitudes toward the activities carried out by others. As noted in previous sub chapter there are activities of people that are suspected as the cause of the damages to environment, namely (1) fish pond, (2) toilets on the river, (3) sewerage/feces discharge into the river, (4) liquid waste release into the river, (5 ) throwing garbage into the river, (6) piling waste up in landfills in the riverbank, (7) cattle farm on the river banks, (8) washing clothes, (9) boat mooring, and (10) buildings (platforms) in the river. The analysis showed that 42.17% of the residents disagreed, but undecided. 25.83% of residents acted by giving explanation to ensure the sustainability of the stream function, 12.70% of residents agreed that it is beneficial to the community, 9.22% of residents did not act because they feel it will not affect the river, 7.65% of residents monitor and rebuke, and 2.43% of residents reported to the government.
About 48.61% of the people showed positive attitude towards the environmental impact caused by the human activities that are seen from their agreement, giving explanations, supervising and reprimanding, and even reporting to the government. The rest of 51.39% of residents showed negative attitude towards the environmental impact, because they did not agree yet undecided, did not react to anything or passive. This shows the low attitude of public toward the environmental impact caused by the residential activities near the river.
The increase responsibility toward the sustainability of the river can be seen from the improved flow, improved water quality, cleanliness of the river and surrounding land, mitigation of flood hazards, and the preservation of natural resources and the land around the river. Regarding the party responsible for the improvement of the river, 47.68% of residents pointed the government. But many people (24.48%) regarded that the improvement of the river flow is their responsibility. Some 21.28% of respondents said that it is a shared responsibility of both community and government.
This section will examine the third hypothesis of the study: good attitudes and behavior of the community towards both the mitigation and control of the flood.
C. Correlation of Community Attitudes and Behavior on the Social Impact
TABLEIV
CORRELATION COEFFICIENT BETWEEN THE COMMUNITY ATTITUDES AND BEHAVIOR AND THE SOCIAL IMPACTS
Attitudes and Behavior of the Community Social Impact on the Community
Correlation
Coefficient (r) Sig Remarks Attitudes toward flood resulting activities
Flood on residential area
–0.315 0.001 Significant
Attitudes of responsibility –0.494 0.001 Significant
Attitudes toward prevention of the social impacts –0.446 0.001 Significant Attitudes toward flood resulting activities
Flood on non residential area
–0.417 0.001 Significant
Attitudes of responsibility –0.583 0.001 Significant
Attitudes toward prevention of the social impacts –0.558 0.001 Significant Attitudes toward flood resulting activities
Property/resource damage
–0.295 0.001 Significant
Attitudes of responsibility –0.375 0.001 Significant
Attitudes toward prevention of the social impacts –0.371 0.001 Significant
We can take the followings from Table IV:
• In the examination of the people attitudes toward flood resulting activities, responsibility, and prevention of the social impacts of flood on the residential area, the correlation is negative with Sig <0.001. It shows a significant influence of the attitudes on the social impacts of flood inundation of the settlement area. This means that the higher the attitudes and behavior, the lower the social impacts due to flooding on the community. Conversely, the lower the attitude and behavior, the higher the social impacts due to flooding on the community, especially on the flooding on non residential area. The highest correlation value (i.e. –0.494) shows that the presence of pool in residential areas was caused primarily by the attitudes toward civil liability.
In the examination of the people attitudes toward flood resulting activities, responsibility, and prevention of the social impacts of flood on non residential area, the correlation is negative with Sig <0.001. It reveals a significant influence of the attitudes on the social impacts of flood inundation on non settlement area. This means that the higher the attitudes and behavior, the lower the social impacts due to flooding on the community. Conversely, the lower the attitude and behavior, the higher the social impacts due to flooding on the community. The highest correlation value (i.e. –0.583) shows that the presence of pool in non residential areas was caused primarily by the attitudes toward civil liability.
In the examination of the people attitudes toward flood resulting activities, responsibility, and prevention of the social impacts of property damaged by the flood, the correlation is negative with Sig <0.001. It tells a significant influence of the attitudes on the social impacts of property damage. This means that the higher the attitudes and behavior, the lower the social impacts due to flooding on the community. On the other hands, the lower the attitude and behavior, the higher the social impacts due to flooding on the community, especially by the property damage. The highest correlation value (i.e. –0.375) shows that the damage on the property by the flood was caused primarily by the attitudes toward community responsibility.
The results we have are in agreement with the fourth hypothesis of this study that suggested a correlation between
attitudes and behavior for flood hazard mitigation and control and the social impacts due to flooding. The hypothesis is accepted.
V. CONCLUSION AND FUTURE WORK
Our study concluded that there is a negative influence between attitudes and behavior towards the social impacts caused by flooding. This means that the higher attitudes and behavior toward flood resulting activities, attitudes toward responsibility, and attitudes toward prevention, the lower the social impacts due to flooding received by society. Thus the relationship between attitudes and behavior for flood hazard mitigation and control and the social impacts due to flooding is acceptable.
In the next study we will include the data on the community's attitudes and behavior on the management of natural resources along the estuary.
REFERENCES
[1] E. Euripidou and V. Murray, "Public health impacts of floods and chemical contamination," J Public Health (Oxf), vol. 26, pp. 376-383, 2004.
[2] N. W. Arnell, "Flood hazard management in the United States and the National Flood Insurance Program," Geoforum, vol. 15, pp. 525-542, 1984.
[3] S. D. Brody, J. E. Kang, and S. Bernhardt, "Identifying factors influencing flood mitigation at the local level in Texas and Florida: the role of organizational capacity," Nat Hazards, vol. 52, pp. 167-184, 2010.
[4] S. D. Brody, S. Zahran, W. E. Highfield, S. P. Bernhardt, and A. Vedlitz, "Policy learning for flood mitigation: a longitudinal assessment of the community rating system in Florida," Risk Anal, vol. 29, pp. 912-929, 2009.
[5] W. Kellens, R. Zaalberg, T. Neutens, W. Vanneuville, and P. De Maeyer, "An analysis of the public perception of flood risk on the Belgian coast," Risk Anal, vol. 31, pp. 1055-1068, 2011. [6] E. L. Kick, J. C. Fraser, G. M. Fulkerson, L. A. McKinney, and D.
H. De Vries, "Repetitive flood victims and acceptance of FEMA mitigation offers: an analysis with community-system policy implications," Disasters, vol. 35, pp. 510-539, 2011.
[7] E. T. Knocke and K. N. Kolivras, "Flash flood awareness in southwest Virginia," Risk Anal, vol. 27, pp. 155-169, 2007. [8] K. Li, S. Wu, E. Dai, and Z. Xu, "Flood loss analysis and
quantitative risk assessment in China," Nat Hazards, 2012. doi:10.1007/s11069-012-0180-y.
[10] B. McDermott and V. Cobham, "S29-01 The Queensland Response to the Current Flood Disaster: Provision of Timely Universal and Targeted Interventions to Children and Families," Asian J Psychiatry, vol. 4, p. S26, 2011.
[11] J. B. Nanlohy, R. Jayadi, and Istiarto, "Studi Alternatif Pengendalian Banjir Sungai Tondano di Kota Manado," Forum Teknik Sipil, vol. 18, 2008 (in Indonesian).
[12] H. Rashid, "Interpreting flood disasters and flood hazard perceptions from newspaper discourse: Tale of two floods in the Red River valley, Manitoba, Canada," Appl Geography, vol. 31, pp. 35-45, 2011.
[13] M. Siegrist and H. Gutscher, "Natural hazards and motivation for mitigation behavior: people cannot predict the affect evoked by a severe flood," Risk Anal, vol. 28, pp. 771-778, 2008.
[14] P. Bubeck, W. J. W. Botzen, and J. C. J. H. Aerts, "A Review of Risk Perceptions and Other Factors that Influence Flood Mitigation Behavior," Risk Analysis, 2012. doi:10.1111/j.1539-6924.2011.01783.x.
[15] E. Enarson, "What women do: gendered labor in the Red River Valley flood," Global Environmental Chang Part B: Environmental Hazards, vol. 3, pp. 1-18, 2001.
[16] C. E. Haque, M. Kolba, P. Morton, and N. P. Quinn, "Public involvement in the Red River Basin management decisions and
preparedness for the next flood," Global Environ Chang Part B: Environ Hazards, vol. 4, pp. 87-104, 2002.
[17] K. Alderman, L. R. Turner, and S. Tong, "Floods and human health: A systematic review," Environ. Int., vol. 47, pp. 37-47, 2012.
[18] L. C. Ivers and E. T. Ryan, "Infectious diseases of severe weather-related and flood-weather-related natural disasters," Curr Opin Infect Dis, vol. 19, pp. 408-414, 2006.
[19] D. G. C. McCann, A. Moore, and M.-E. Walker, "The water/health nexus in disaster medicine: I. Drought versus flood," Curr Opinion Environ Sustain, vol. 3, pp. 480-485, 2011.
[20] A. W. Coburn, R. J. S. Spence, and A. Pomonis, Disaster Mitigation, 2nd ed. Cambridge, UK: Cambridge Architectural Research Limited, 1994.
[21] G. O. Schawab, R. K. Frevert, T. W. Edminster, and K. K. Barnes, Soil and Water Conservation Engineering. Toronto: John Wiley & Sons, 1981.
[22] K. Hidayat and M. Solichin, "Strategi Pemberdayaan Penambang Galian C dalam Rangka Pengelolaan DAS Brantas Berkelanjutan," Universitas Brawijaya, Malang. 2010 (in Indonesian).
[23] M. Singarimbun and S. Effendi, Survey Research Methods. Jakarta: PT. Pustaka LP3ES, 1995 (in Indonesian).
![Fig. 1. The Integrated Water Resources Management (IWRM) and its impor-tant elements (adapted from Hidayat and Solichin [22])](https://thumb-us.123doks.com/thumbv2/123dok_us/1379620.1648536/2.612.340.558.231.397/integrated-water-resources-management-elements-adapted-hidayat-solichin.webp)