ISSN (e): 2250-3021, ISSN (p): 2278-8719 Vol. 04, Issue 04 (April. 2014), ||V5|| PP 47-59
A case study on the effectiveness of Multi-sites test handler to
improve of Production Output
Voon C. Khoo IEng MIMechE
1 1(Asia e University)
Abstract: - The conventional method allows testing of only one chip at a time (single-site testing). However, due to advancements in testing procedures, current test technologies are able to conduct dual-sites testing, quad-sites testing, octal-sites testing, 16-sites testing, 32-sites testing, and so on. In line with this, the multi-site testing approach is a method that increases the number of chips that can be tested in a single touch-up. This method allows more chips to be tested per hour, thus improving the testing throughput. In this research the author take the initiative to develop a multi-sites throughput model to investigate the effectiveness of multi-site testing approach on improving the testing throughput. In the case study, five multi-site configurations were applied. These configurations were single-site, quad-sites, octal-sites, ×16-sites, and ×32-sites. A hypothesis was analyzed by using one-way ANOVA and Post Hoc Test.
Keywords: - multi-site, test handler, semiconductor testing, multi-sites testing model
I. INTRODUCTION
The continuous decrease in the selling price of electronic devices limits the profit margin of manufacturers, and also leads to the constriction of the selling price of semiconductor chips.
The cost of fabricating semiconductor chips has been reduced over the past 20 years. From 2012 onwards, testing cost has become the deciding factor of profit margin in the manufacture of semiconductor chips. Consequently, reduction in testing cost has become the common goal of semiconductor manufacturers around the world. Failure to reduce testing cost can result in a semiconductor chip manufacturing company losing its competitiveness in the market. An effective way to reduce testing cost is to decrease testing time. Decreasing testing time also increases testing throughput. To achieve this objective, the performance and speed of the test equipment need to be improved. Therefore, the chip-transfer time and chip-testing sequence need to be developed to allow semiconductor chips to be tested rapidly.
To improve the testing process, a number of new technologies have been developed; one of them is the multi-site approach. Multi-multi-site testing is an effective and popular method for increasing throughput and reducing testing cost (Higgins, 2005). In this method, multiple semiconductor chips are tested parallel to a single test-equipment setup (Lew, 2006). This approach provides more benefits than the single-site test approach with regard to test throughput and testing cost reduction (Volkerink, 2002).
However, the advancement of technology leads to an increase in capital equipment investment. The failure of a new technology to provide the expected throughput outcome increases testing costs. Therefore, studying equipment efficiency in relation to capital equipment investment is important to ensure that the semiconductor industry advances in the right direction and to incur lower testing costs while maintaining adequate profit margins.
II. MULTI-SITETHROUGHPUTMODELDEVELOPMENT
Production output consists of three fundamentals: testing output (throughput), testing yield, and the equipment utilization percentage. Detailed explanations for these fundamentals are as follows.
Equation 1 was developed to calculate the production throughput whereby the throughput obtained is the tested good product by take into account the testing yield whereby the testing yield mean that the percentage of tested good.
The equation 1 was integrated with the Multi-sites efficiency (MSE) as well so that the comparison between the multi-sites versus the multi-sites efficiency (MSE) can be obtained.
where:
- tms is the multi-site test time, that is, the time spent to complete the testing of a semiconductor chip. - ims is the multi-site indexing time, that is, the semiconductor chip exchange time within the tested chip replaced with a new untested chip.
- n is the number of test sites, that is, the number of semiconductor chips tested in a single contact.
To achieve the integration with the MSE, the throughput equation developed by Evans (1999), shown as Equation 2, is enhanced by integrating the MSE model developed by Kelly (2008). The MSE proposed by Kelly is presented as Equation 3:
where:
- Δt is the change in testing time between single-site and multi-site testing; and - ΔN is the number of different test sites between single-site and multi-site testing.
Equation 3 is further derived, as shown in Equation 4.
where:
- tMS is the multi-site test time, and t1 is the single-site test time; and - N is the number of test sites for multi-site testing.
The test handler affects testing throughput. Therefore, the test handler indexing time has to be included as part of the MSE equation. In doing so, Equation 5 is derived by including the indexing time (i), as follows:
For the integration of the equations to work, one must have prior understanding of the relationship between the throughputs and MSE. To determine the relationship between MSE and multi-site, the variables of MSE, which is related to the throughput, need to be understood. Equation 2 and Equation 5 show that the multi-site test time (tms) and multi-site indexing time (ims) are common variables in both equations.
In Equation 5, tMS and iMS represent multi-site test time and indexing time. Therefore, to clearly derive the relationship between tms and ims in relation to MSE, the integration process shown in Figure 1 is carried out.
Figure 1 Deriving the Relationship between tms and ims with MSE
The final computation for the equation of tms and ims in relation to MSE is derived and shown in Equation 6.
Finally, Equation 6 is integrated into Equation 2 to obtain the computation for testing throughput, which includes MSE as part of the calculation. Figure 2 below shows the computation of the integration, and the complete integration is illustrated in Equation 7:
Figure 2 The Computation of the Integration of Equation 6 into Equation 2
where: UPHinsertions are represented by the testing output in one hour.
III. MULTI-SITETESTHANDLER
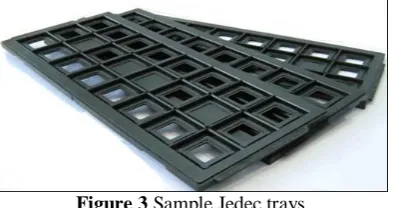
This research selected Pick and place test handler for the case study. Pick-and-place testing handling is one of the widely used methods of testing multi-sites. In this process, the semiconductor chip is already singulated from the lead frame to become an individual chip. The chip is placed on a Jedec tray to be carried from the assembly equipment to the test equipment. Figure 3 shows a photograph of Jedec trays.
Figure 3 Sample Jedec trays.
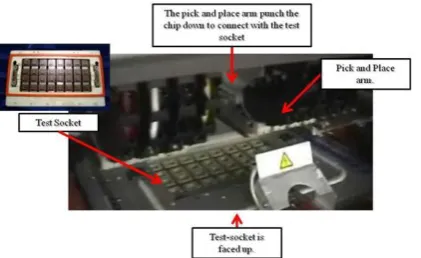
The Jedec tray is loaded with semiconductor chips and then placed into the pick-and-place handler in Area 1, as shown in Figure 4.
Figure 4 Process flow of pick-and-place testing handling.
Figure 5 Test area for pick-and-place testing handling.
The test site configuration setup for the case study is explained in the subsequent section.
The pick-and-place test equipment can be configured from single-site to X32-sites. The test sites are configured to obtain data for the case study from single-site to X32-sites. Figure 6 displays a photograph of the pick-and-place test equipment test sites that can support X32-sites.
Figure 6 Pick-and-place test sites.
The standard layout of the test site for the pick-and-place test equipment is configured in four columns and eight rows to obtain X32-sites. With such flexibility, the test site can be configured to single-site, quad-sites, octal-sites, X16-octal-sites, and X32-sites. The details of the configurations are described below. From the standard test site configuration (Figure 7), the experiment first configures the test handler to pick up only one chip and to perform single-site testing to simulate the indexing and test times of the conventional testing method. Figure 8 depicts the single-site configuration (gray color indicates the test site used for testing).
Figure 7 Standard layout of X32-sites.
Figure 8 Layout of single-site.
Figures 9 and 10 show the configuration of quad-sites and octal-sites, respectively.
Figure 10 Layout of octal-sites.
The test handler is configured to X16-sites (Figure 11) and X32-sites (Figure 12) when the quad-site and octal-site tests are completed.
Figure 11 Layout of X16-sites.
Figure 12 Layout of X32-sites.
The configurations of test sites are defined. The results of the analysis are discussed in the section that follows.
IV. ANALYSISRESULT
This study considers pure indexing time only and rejects any indexing time slowed down by external factors, including the carrier transfer process, loading and unloading process, equipment jamming, and delay caused by slowing of pick-arm 1. Production data are only accepted if no external factor, including handler and tester downtimes, is identified.
This study focuses on only the area shown within the circle in Figure 13.
Figure 13 Focus area of this research.
The indexing time is considered valid if no waiting time exists between the exchange times for the device being tested as it is replaced with a new device before testing. However, the indexing time is considered invalid given external factors that cause immediate replacement of a new chip after the device is completely tested.
The test time is considered valid if no external factors, including tester downtime and chip contacting problems, cause a high rejection rate of the tested chip.
i. Testing Throughput (UPHinsertion)
For the testing throughput, MSE must be obtained. MSE is calculated using Equation 5 as
follows:-The example of the calculation for single-site testing configuration is as follows:-
MSE = 100%.
The summary of MSE results is shown in Table 1 below:-
Table 1 MSE for Pick-and-Place Test equipment
Multi-sites efficiency
Number of Sites Multi-sites
Efficiency
Compare with Single-site
Compare with Quad-site
Compare with Octal-site
Compare with X16-site
Singles-site 100.00% 0.00%
Quad-site 47.42% -52.58%
Octal-sites 45.95% -54.05% -3.09%
X16-sites 44.70% -55.30% -5.74% -2.73%
X32-sites 31.47% -68.53% -33.63% -31.52% -29.59%
For the pick-and-place test-equipment setup, MSE for quad-site setup is reduced by 52.58% compared with single-site setup. Octal-site setup is reduced by 54.05% compared with single-site setup, and by 3.09% compared with quad-site setup. Furthermore, X16-site setup is reduced by 55.30% compared with single-site setup, by 5.74% compared with quad-site setup, and by 2.73% compared with octal-site setup. Finally, for X32-site setup, MSE is reduced by 68.53% compared with single-X32-site setup, by 33.63% compared with quad-X32-site setup, by 31.52% compared with octal-site setup, and by 29.59% compared withX16-site setup.
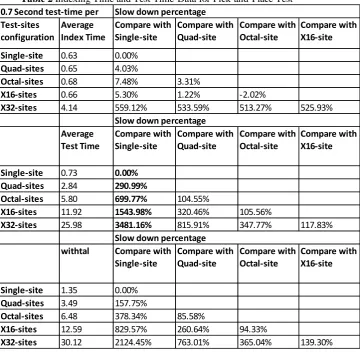
Table 2 Indexing Time and Test Time-Data for Pick-and-Place Test-equipment Test-sites configuration Average Index Time Compare with Single-site Compare with Quad-site Compare with Octal-site Compare with X16-site
Single-site 0.63 0.00%
Quad-sites 0.65 4.03%
Octal-sites 0.68 7.48% 3.31%
X16-sites 0.66 5.30% 1.22% -2.02%
X32-sites 4.14 559.12% 533.59% 513.27% 525.93%
Average Test Time Compare with Single-site Compare with Quad-site Compare with Octal-site Compare with X16-site
Single-site 0.73 0.00%
Quad-sites 2.84 290.99%
Octal-sites 5.80 699.77% 104.55%
X16-sites 11.92 1543.98% 320.46% 105.56%
X32-sites 25.98 3481.16% 815.91% 347.77% 117.83%
withtal Compare with
Single-site Compare with Quad-site Compare with Octal-site Compare with X16-site
Single-site 1.35 0.00%
Quad-sites 3.49 157.75%
Octal-sites 6.48 378.34% 85.58%
X16-sites 12.59 829.57% 260.64% 94.33%
X32-sites 30.12 2124.45% 763.01% 365.04% 139.30%
0.7 Second test-time per
Slow down percentage Slow down percentage
Slow down percentage
In Table 2, the test time for the pick-and-place test equipment is discussed as follows:-
Single-site Testing
The indexing time for single-site setup is 0.63 seconds, and the test time is 0.73 seconds. Thus, an average of 1.35 seconds in total is required to complete chip testing.
Quad-sites Testing
The indexing time for quad-site configuration is 0.65 seconds, this is slower by 4.03% than that for single-site testing. The test time to complete quad-site testing is2.84 seconds, which is slower by 290.99% compared with that for single-site testing. In total, an average of 3.49 seconds is required to complete quad-site testing, which is slower by 157.75% compared with that for single-site testing.
Octal-sites Testing
The indexing time for octal-site configuration is 0.66 seconds, which is slower by 7.48% compared with that for single-site testing, and by 3.31% compared with for quad-site testing. The test time required to complete octal-site testing is 5.80 seconds, which is slower by 699.77% compared with that for single-site testing, and by 104.55% compared with for quad-site testing. The overall time required to complete octal-site testing is 6.48 seconds, which is slower by 378.34% compared with that for single-site testing, and by 85.58% compared with that for quad-site testing.
X16-sites Testing
X32-sitesTesting
The indexing time for the X32-site configuration is 4.14 seconds, which is slower by 559.12% compared with that for single-site testing, by 599.58% compared with that for quad-site testing, by 513.27% compared with that for octal-site testing, and by 525.95% compared with that for X16-site testing. The test time required to complete the X32-site testing is 25.98 seconds, which is slower by 3,481.16% compared with that for single-site testing, by 815.91% compared with that for quad-site testing, by 347.77% compared with that for octal-site testing, and by 117.83% compared with that for X16-site testing. The overall time needed to complete the X32-site testing is 30.12 seconds, which is slower by 2124.45%compared with that for single-site testing, by 763.01% compared with that for quad-site testing, by 365.04% compared with that for octal-site testing, and by 139.30% compared with that for the X16-site testing.
After obtaining MSE percentages and determining the indexing time and testing time, the testing throughput for each test-site setup is calculated using Equation 7.
The example of the calculation for single-site testing is shown as follows: the value of N-1 is fixed as1 because no multi-site for single-site testing exists:
= 2,975 units per hour.
The example of the calculation for multi-site testing is shown as follows: the only difference between single-site testing and multi-site testing is that the value of N is replaced by the number of test sites for the particular configuration setup.
= 4,211 units per hour.
Throughput results are summarized in Table 3 below:-
Table 3 Testing Throughput for Pick-and-Place Test-equipment
Throughput
Number of Site Throughput Compare
with Single-site
Compare with Quad-site
Compare with Octal-site
Compare with X16-site
Single-site 2659 0.00%
Quad-sites 4126 55.19%
Octal-sites 4447 67.25% 7.77%
X16-sites 4576 72.12% 10.91% 2.92%
X32-sites 3825 43.86% -7.30% -13.99% -16.42%
For the pick-and-place test-equipment setup, the throughput per hour for single-site testing is 2,659 units per hour. Quad-site testing is able to increase the UPH by 55.19%, thus producing 4,126 devices in one hour. Octal-site testing produces 4,447 chips per hour, which is 67.25% better than single-site testing, and 7.77% better compared with quad-site testing. The X16-site testing is further improved by 2.92% compared with octal-site testing, by 10.91% compared with quad-site testing, and significantly, by 72.12% compared with single-site testing. However, the X32-site testing performance is reduced by 16.42% compared with the X16-site testing, by 13.99% compared with octal-site testing, and by 7.30% compared with quad-site testing. It has improved by 43.86% compared with single-site testing.
UPHinsertion=
3600 × 1
(1-100%)(1)(1.21)+1.21
3,600 × 4
(1-39.12%)(3)(1.21)+1.21
UPHinsertion=
UPHinsertion=
3600 X N
ii. Testing Yield Percentage
Testing yield is one of the factors affecting the cost-of-test. Testing yield percentage data collected from the pick-and-place test-equipment setup is shown in Table 4 below:-
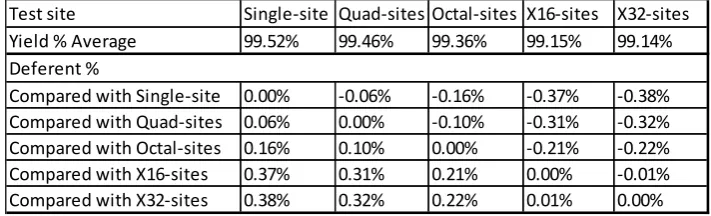
Table 4 Testing Yield Percentage for Pick-and-Place Test-equipment Test site Single-site Quad-sites Octal-sites X16-sites X32-sites Yield % Average 99.52% 99.46% 99.36% 99.15% 99.14%
Compared with Single-site 0.00% -0.06% -0.16% -0.37% -0.38% Compared with Quad-sites 0.06% 0.00% -0.10% -0.31% -0.32% Compared with Octal-sites 0.16% 0.10% 0.00% -0.21% -0.22% Compared with X16-sites 0.37% 0.31% 0.21% 0.00% -0.01% Compared with X32-sites 0.38% 0.32% 0.22% 0.01% 0.00% Deferent %
As shown in Figure 14 below, testing yield percentage is reduced when the number of test sites increases. Based on this scenario, this study concludes that position accuracy is inefficient for the pick-and- place test-equipment setup for multi-site testing.
0.989 0.99 0.991 0.992 0.993 0.994 0.995 0.996
Single-site Quad-sites Octal-sites X16-sites X32-sites
Yield % Average
Yield % Average
Figure 14: Testing Yield Percentage Graph for Pick-and-Place Test equipment.
Single-site testing has a yield of 99.52%, whereas quad-site testing achieves 99.46%, which is 0.06% less compared to the single-site testing. Octal-site testing has a yield of 99.36%, which is lower by 0.10% compared with quad-site testing yield, and by 0.16% compared with single-site testing yield. The X16-site testing yield further dropped by 0.21% compared with octal-site testing yield, by 0.31% compared with quad-site testing yield, and by 0.37% compared with single-quad-site testing yield. Finally, the X32-quad-site testing has a yield lower than 0.01% compared with X16-site testing yield, by 0.22% compared with octal-site testing yield, by 0.32% compared with quad-site testing yield, and by 0.38% compared with single-site testing yield.
iii. Production Output
After obtained of the testing throughput and the testing yield, then the production output was calculated with equation 1 as shown below:
The summary of the production output for the entire test-sites are tabulated in table 5:
Table 5 Testing Production Output
Number of Site Testing Throughput Testing Yield Production Output
Single-site 2659 99.52% 2646
Quad-sites 4126 99.46% 4104
Octal-sites 4447 99.36% 4419
X16-sites 4576 99.15% 4537
After obtained the production output as shown in table 5, following section discuss the hypothesis analysis.
iv. Hypothesis Analysis
An alpha level of 0.05 is used for the analysis. As previously discussed, five independent levels of configurations (a) are selected, namely, single-site, quad-sites, octal-sites, X16-sites, and X32-sites. Each independent level contains 30 data sets (n). In this case, the following data are determined:-
a = 5 independent levels, n = 30 sets of data, N = 150.
Therefore, the degrees of freedom are calculated as
dfBetween= 5 -1 = 4, dfWithin = 150 – 5 = 145, dfTotal= 150 – 1 = 149.
From the degrees of freedom between and within, which is (4,145), refer to the F-Table, with the critical value obtained as 2.3719. As indicated in the previous chapter, if the F-value is smaller than the critical value, then the null hypothesis is accepted; otherwise, the null hypothesis is rejected.
a) Hypothesis 1: Multi-site versus MSE Analysis of Hypothesis
The hypothesis conditions that need to be tested are listed below. H0: Improving the number of test sites has no effect on MSE.
H1: Improving the number of test sites has an effect on MSE.
The MSE data are rated as dependent levels on a scale of 1 to 10, as shown in Table 6 below:-
Table 6 Scale of MSE Dependence Level
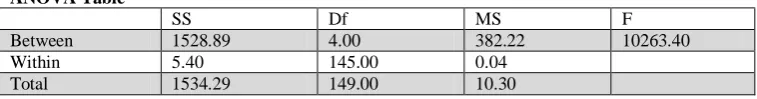
Table 7 ANOVA results for MSE
ANOVA Table
SS Df MS F
Between 1528.89 4.00 382.22 10263.40
Within 5.40 145.00 0.04
Total 1534.29 149.00 10.30
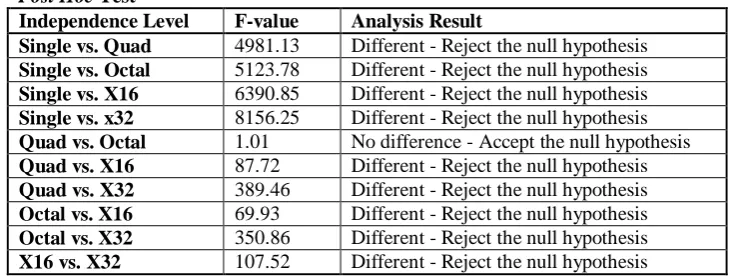
In this study, the Scheffe test is used for post hoc test analysis. A summary of the post hoc test is shown in Table 8 below:-
Table 8 Analysis Results of the Post Hoc Test Post Hoc Test
Independence Level F-value Analysis Result
Single vs. Quad 4981.13 Different - Reject the null hypothesis Single vs. Octal 5123.78 Different - Reject the null hypothesis Single vs. X16 6390.85 Different - Reject the null hypothesis Single vs. x32 8156.25 Different - Reject the null hypothesis Quad vs. Octal 1.01 No difference - Accept the null hypothesis Quad vs. X16 87.72 Different - Reject the null hypothesis Quad vs. X32 389.46 Different - Reject the null hypothesis Octal vs. X16 69.93 Different - Reject the null hypothesis Octal vs. X32 350.86 Different - Reject the null hypothesis X16 vs. X32 107.52 Different - Reject the null hypothesis
Table 8 above shows that all independence level comparisons, except for quad-sites with octal-sites, are greater than the critical value, thus indicating that the number of test sites does have an effect on MSE.
Table 6, on the dependence level scaling, shows that the greater the scale, the better the MSE in providing better understanding of the data. The X32-sites, which have a higher F-value compared with other test site setups, have the lowest dependence level compared with other test-site configurations. Thus, the X32-sites have the worse MSE compared with other test sites, followed by the X16-site configuration. Octal-sites and quad-sites maintain an almost similar efficiency, and an increase in the number of test sites does not have a significant effect on their efficiency.
The case study shows that the MSE of the pick-and-place test-equipment setup decreases when it is testing a certain number of semiconductor chips at any one time. This decrease affects the cost-of-test and profit margin.
b) Hypothesis 2: Multi-sites versus Throughput Improvement An analysis of hypothesis 2 is provided in the following paragraphs.
Analysis of Hypothesis
The hypothesis for the throughput analysis is designed as follows. H0: Improvement of test site has no effect on throughput.
H1: Improvement of test site has an effect on throughput.
The dependence level for testing throughput is rated using a scale of 1 to 10, as shown in Table 9 below:-
Table 10 ANOVA results for Testing Throughput ANOVA Table
SS Df MS F
Between 1604.43 4.00 401.11 5975.39
Within 9.73 145.00 0.07
Total 1614.16 149.00 10.83
Table 10 above shows that the F-value is 5975.39, which is greater than the critical value of 2.3719. In this case, the null hypothesis is rejected. ANOVA shows that improving the number of test sites has an effect on testing throughput. Thus, the throughput data is further analyzed through post hoc test to determine the throughput behaviour for the entire test-site setup.
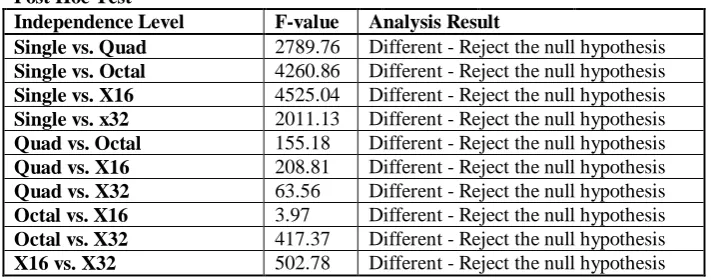
Table 11Post Hoc Test analysis Results for Testing Throughput Post Hoc Test
Independence Level F-value Analysis Result
Single vs. Quad 2789.76 Different - Reject the null hypothesis Single vs. Octal 4260.86 Different - Reject the null hypothesis Single vs. X16 4525.04 Different - Reject the null hypothesis Single vs. x32 2011.13 Different - Reject the null hypothesis Quad vs. Octal 155.18 Different - Reject the null hypothesis Quad vs. X16 208.81 Different - Reject the null hypothesis Quad vs. X32 63.56 Different - Reject the null hypothesis Octal vs. X16 3.97 Different - Reject the null hypothesis Octal vs. X32 417.37 Different - Reject the null hypothesis X16 vs. X32 502.78 Different - Reject the null hypothesis
By referring to Tables 11 and 9 above for the dependence level scale, this study finds that the greater the dependence level scale, the better the testing throughput improvement.
V. CONCLUSION
Thus, a conclusion can be drawn that the X16-sites have higher testing throughput improvement relative to the single-site setup, followed by the octal-sites. The X32-sites do not provide the expected results compared with the X16-sites and octal-sites. The quad-sites produce even more throughput compared with the X32-sites. The main reasons for these results have already been discussed in the previous section. However, the MSE does not necessarily have a direct effect on the testing throughput. The X16-site setup has the second worse MSE but it produces higher testing throughput compared with other test site configurations. This finding may be partly attributed to the testing sequence, which is further explained in the next paragraphs.
The main reason why the X32-sites do not provide the expected testing throughput and the MSE is ascribed to two factors. First, the test time, which requires 25.98 seconds to complete, is highest among all test-site configurations. The second factor is test-handler design limitations which are described as follows.
Figure 15: Pick-and-Place Testing Sequence for Single-site, Quad-sites, Octal-sites, and X16-sites
four chips. Head One will then make contact with the chip on the test site, and Head Two will stand by for testing. Once Head One is completed, the testing process and moves away from the test sites; then Head Two immediately replaces the chip onto the test sites. This sequence provides a short indexing time without a long waiting time for chip replacement.
Figure 16: Pick-and-Place Testing Sequence for X32-sites Testing.
Figure 16 above shows the sequence for the X32-site testing. The mechanical design remains the same (with two test heads). However, for the X32-site testing, both Heads One and Two need to come together on the test site highlighted in red. This sequence requires longer indexing time for the next chip replacement after the current chips are tested. The indexing time for the X32-site testing is approximately 4.2 seconds, which is slower by about 3.5 seconds compared with the sequence shown in Figure 5.38.
REFERENCES
[1] Goodall, I R.,Fandel, D., Allan, A., Landler, P., and Huff, H.R. (2002) “Long-term Productivity Mechanisms of the Semiconductor Industry,” Semiconductor Silicon 2002 Proceeding of American Electrochemical society, pp. 125 – 144.
[2] Bao, G. (2003) “Challenges in Low Cost Test Approach for ARM9 Core Based Mixed-Signal SoC Dragon ball,” Proceedings International Test Conference, pp. 512-519.
[3] The Malaysian Government Valuation and Property Service Department Report 2011, Pusat Maklumat Harta Tanah Negara (NAPIC), Putrajaya, 2011.
[4] Rivoir, J. (2003) “Lowering Cost of Test: Parallel Test or Low-cost ATE?” Proceedings of the 12th Asian Test Symposium.
[5] Evans, A.C. (1999) “Applications of Semiconductor Test Economics, and Multisite Testing to Lower Cost of Test,” Proceedings of the International Test Conference, pp. 113-123.
[6] Kelly, J. (2008) “Multi-site Efficiency and Throughput,” Technical Paper for Verigy.
[7] Horgan, J. (2004) “Test & ATE – Cost of Test,” retrieved Nov 20, 2011, from
www.edacafe.com/magazine/magazine_20040315.html.
[8] Fogiel, M, Microeconomics. New Jersey: Research and Education Association, 2003. [9] Babcock, D.L, Managing Engineering and Technology. New Jersey: Prentice-Hall, Inc, 1996. [10] Bruton, G.D, The Management of Technology and Innovation. OH: Thomson Higher Education, 2007. [11] Lee, D.R. and Mckenzie, R.B, Microeconomics for MBAs. New York: Cambridge University Press, 2006. [12] Noori, H, Managing the Dynamics of New Technology. New Jersey: Prentice-Hall, Inc. 1990.
[13] Turley, J, The Essential Guide to Semiconductors. New Jersey: Pearson Education, Inc. 2009. [14] Thamhain, H.J, Management of Technology. New Jersey: John Wiley & Sons, Inc. 2005.
[15] Samuelso, P.A. and Nordhaus, W.D, Economics. Singapore: McGraw-Hill Higher Education, 2002.
[16] Rivoir, J. (2004) “Parallel Test Reduces Cost of Test More Effectively Than Just a Cheap Tester,” Conference publication of Electronics manufacturing technology symposium, 2004. IEEE/CPMT/SEMI 29th International, pp. 263-272.
[17] Moore, G.E. (1965) “Cramming More Components onto Integrated Circuits,” Proceedings of IEEE, pp. 82-85. [18] Aizcorbe, M.A. (2002) Price Measures for Semiconductor Devices, U.S. Bureau of Economic Analysis (BEA) 2002
Working Paper Series.
[19] Lee, D.R. and Mckenzie, R.B. (2006) Microeconomics for MBAs. New York: Cambridge University Press. [20] Turley, J. (2009) The Essential Guide to Semiconductors. New Jersey: Pearson Education, Inc.
[21] Higgins, M. and MacNamee, C. (2006, May 12) SoC Test: Trends and Recent Standards,” Institute of Technology Blanchardstown Journal Issue, pp. 24-35.
[22] Lew, B.K. (2006) “Test Cost Saving and Challenges in the Implementation of x6 and x8 Parallel Testing on Freescale 16-bit HCS12 Micro-controller Product Family,” Proceedings of the 3rd IEEE International Workshop on Electronic Design, Test and Application.