Page 365 www.ijiras.com | Email: [email protected]
Comparative Study Of Surface And Ground Water Quality, Nyeri
County Urban-Rural Surroundings, Kenya
Kinyua A.N
Thuku T.
Githira P.
Siele W.
Department of Chemistry, JKUAT
I. INTRODUCTION
Adequate purity of water is of paramount importance to living things. It is the life blood of species. Every race and tribe everywhere and everyday makes use of water. Health experts have suggested and stressed the need to drink two litres of water every day. Water occupies about 70% of the earth’s surface and composes 65% of the human body [WHO]. Water is essential to urban and rural life. It plays an important role in the bodily intake of trace elements. Even though some trace elements are essential, at elevated levels these elements can cause morphological abnormalities reduce growth, increase mortality and mutagenic effects (Nkono and
Asubiojo, 1998). The concerns about trace elements are that they pose both environmental and health consequence problems (Almas et al., 2009). Water quality is important to humans as well as plants and animals that live in and around water bodies (Merritts et al., 1998). Chemical attributes of water are important indicators of water quality, they affect aesthetic qualities such toxicity. Among environmental pollutants, metals are of particular concern, due to its potential toxic effect and ability to bio-accumulate in aquatic ecosystems (Censi et al., 2006). Heavy metals refer to heavy metallic chemical elements that have relatively high density and are toxic or poisonous at low concentration. They include essential and non- essential chemical elements. Surface
Abstract: The main objective of this research was to establish the comparative quality of surface and ground waters by monitoring the trends of the water quality through analyzing its physicochemical parameters; pH, temperature, turbidity, EC, water nutrient loads of NH4+_N, NO3-_N, PO43- TP, SO42- and the levels of selected heavy metals (Cr, Zn, Cu,
Fe, Cd, and Pb). Water samples were collected along the Chania River and boreholes within the catchment area. Sampling point were selected based on the dominant human activity, accessibility of the sampling point and safety. This was done over two seasons that is wet and dry season. The physiochemical parameter were determined insitu by use of a portable 3505 multi-parameter meter while the nutrients load was determined by use of UV-Vis 1800 Shimadzu spectrophotometer and the concentration of each heavy metals determined by using the AAS-6200 Shimadzu instrument against the standard calibration curve. The results displayed that for the physiochemical expect for one of the boreholes for the pH and two boreholes and the surface water for the turbidity all the others were below the recommended WHO values in both seasons. For nutrients load both surface and ground water recorded values below the WHO recommended values for both seasons though the values were generally higher during the dry seasons than wet seasons. For heavy metals both surface and ground water recorded higher values than the WHO values for lead, chromium and cadmium although all values for iron were below the WHO standards but copper had some values higher for two boreholes and three points on the river. There was no significant difference between the surface and ground water.
Page 366 www.ijiras.com | Email: [email protected] and ground water are two separate entities, so they must be
regarded as such. However, there is an ever-increasing need for management of the two as they are part of an interrelated system that is paramount when the demand for water exceeds the available supply (Fetter 464).
Nyeri Municipality the main source of surface water with the environments of is River Chania. River Chania flows from the Aberdares through Nyeri Hill, Nyeri town to Sagana River. In the recent future, resident have started to extensively explore the use of ground water. Within this environ are a great number of industries such as the Highland, Cocacola Mt. Kenya Bottlers among others which are of great economic significance to the county. However the impacts of these economic activities to the surface and ground water quality are not documented.
II. METHODOLOGY
A. STUDY AREA
This study was carried out in Nyeri County, Kenya along the River Chania and the ground water to be considered was within a radius of 2km from the river. The sampling point were selected based on the dominant land use activity within the area such as agricultural activity, industrial activities, logging activities, other human activities and the presence of borehole for the provision of ground water along the river. Accessibility of the sampling points and safety was also taken into consideration.
B. SAMPLING
Grab (simple random) samples of surface water from the Chania River were taken and an equivalent number of ground water samples from within the same localities taken. During sampling the bottles were rinsed with sample three times and then filled from each of the designated sampling points. Samples were collected from this was done into seasons, i.e. during the rainy season and during a relatively dry season. The water was then be transferred into labeled 500ml plastic bottles pretreated with 5 % HNO3 and then immediately acidified with 10% HNO3, frozen for the preservation of nutrient analysis samples. This was then be stored in an ice box and transported to the laboratory for analysis. For the ground water, water was be drown from a well, put in a 500ml plastic bottle frozen as a preservation which has been rinsed thoroughly using the well water. Another set of water was then be transferred into labeled 500ml plastic bottles pretreated by addition of 3 drops concentrated nitric acid (72 %) in each bottle. This was then transported to the laboratory for elemental analysis.
C. ANALYTICAL ANALYSIS
a. THE PH, TEMPERATURE, AND ELECTRICAL CONDUCTIVITY
The water pH, temperature, and electrical conductivity was measured in situ at the points of sample collection using a
3505 multi parameter-water quality meter. The pH meter was calibrated before sample determination using pH 4 and pH 7 standard buffers.
b. TURBIDITY
Turbidity was determined by use turbid meter, type SGZ-B portable turbidity meter which was standardized to zero NTU using distilled water, then 200 NTU standard. The sample was shaken and poured into a cuvette and readings taken using the turbid meter.
c. AMMONIUM IN WATER
In distilled water, 10g ZnSO4.7H2O was dissolved and diluted to 100mL.Sodium hydroxide, 6N (24g NaOH ) was dissolved and diluted to 100mL. 50g EDTA was dissolved in 60mL water containing 10g NaOH. Cooled and dilute to 100mL. In 100mL 50g potassium sodium tartarate was dissolved. Ammonia was removed by boiling off 30mL solution, cooled and diluted to 100mL. 100g Hgl2 and 70g Kl was mixed well and dissolved in small quantity of water. This mixture was then added to a cooled solution of 160g NaOH in 500mL water and diluted to 1000mL, kept overnight, stored supernatant in coloured bottle. In distilled water, 3.819g of NH4Cl dried at 100°C was dissolved and diluted to 1000mL. 10mL of the solution was diluted to 1000mL. 1mL = 10µg NH3. 1 mL ZnSO4 solution and 0.4 or 0.5 mL NaOH was added 100mL of the sample to obtain the pH of 10.5. Allowed to settle and the supernatant filtered through 42 No. Whatman filter paper. To suitable aliquot of sample 3 drops of Rochelle salt solution or 1 drop of EDTA was added and mixed well. 3mL Nessler reagent if EDTA was used or 1mL if Rochelle salt solution was used added and made up to 100mL mixed well and percent transmission read after 10 minutes at 410nm using a blank prepared in the same way by taking distilled water instead of the sample.
d. NITRATE IN WATER
The concentration was determined against a standard calibration curve prepared from (AR) potassium nitrate (KNO3) made by dissolving 721.8mg anhydrous potassium nitrates in 1000ml distilled water with 1N hydrochloric added. 100ml stock nitrate solution was diluted to 1000ml. The samples and the standards were treated the same way. The absorbance read at a wavelength of 300nm using a UV-Vis 1800 Shimadzu spectrophotometer.
e. TOTAL PHOSPHOROUS (TP)
Page 367 www.ijiras.com | Email: [email protected] determined against a standard calibration curve prepared from
analytical grade potassium dihydrogen phosphate (KH2PO4).
f. ORTHOPHOSPHATE (PO43- -P)
Orthophosphate phosphorous was determined in the same way only that acid digestion was not be done.
g. SULPHATES IN WATER
A suitable volume of sample was diluted to 100mL into a 250mL Erlenmeyer flask. Exactly 5.0 mL conditioning reagent (stabilization reagent) prepared by Slowly adding 30 mL concentrated HCl to 300 mL distilled water, 100 mL 95% ethanol or isopropanol, 75 g NaCl in solution in a container and 50 mL glycerol and mixed was added. The flask was constantly stirred with the help of stirrer. 1-spatula BaCl2 crystals was added with stirring. Stirring for 1 minute continued after addition of BaCl2. The suspension added into an absorption cell of photometer and turbidity measured at 5±0.5 min. using a type SGZ-B portable turbidity meter. To correct for sample colour and turbidity, a blank to which BaCl2 is not added was ran. A calibration curve was prepared by using standard sulphate solution (147.9 mg anhydrous Na2SO4 dissolved in distilled water in a 1-liter volumetric flask and dilute to the mark with distilled water.) treated the way as the sample spaced at standards at 5-mg/L increments in the 0-40 mg/L sulphate range.
h. HEAVY METALS
The heavy metal in water were determined by the procedure adopted by Mzimela et al., (2003). Water sample 100ml were filtered through a cellulose acetate filter paper. This was then acidified with 1ml con nitric acid (AR) and then placed in a digester at 60°c and allowed to evaporate to 15mls. The sample was then transferred in to a 25ml volumetric flask and made up to volume with double distilled and deionized water. The concentration of heavy metals was determined in mg/l using an AAS-6200 Shimadzu instrument against the standard calibration curve which had been prepared by plotting the absorbance of appropriate amounts of analytical grade salts of the respective metal salts dissolved in distilled water and diluted to working standards solution, ranging from 0.1mg/L-100mg/L.
III. RESULTS AND ANALYSIS
The results in Table 1 below shows the mean values for physiochemical parameters of water while table 2 shows the mean concentration of selected nutrients and table 3 a summary of mean values for selected heavy metals in both surface (River Chania) and ground water in Nyeri County Kenya against guidelines on food safety by the WHO.
Point of sampling
Season Temp
0 c
pH E.C
µS
Turbidity NTU
1U WET 22.0 6.55 149 21
DRY 23.4 7.08 297 22.8
2U WET 22.2 5.19 51.2 7.0
DRY 23.0 7.2 65.1 8.0
3U WET 22.3 7.19 460 8.1
DRY 22.7 7.85 1147 8.8
4U WET 22.0 7.02 744 7.0
DRY 22.5 7.32 1242 6.5
5U WET 22.7 7.19 668 2.3
DRY 23.4 8.00 1087 1.0
6U WET 22.8 7.17 342 2.2
DRY 23.3 7.40 1194 2.0
7U WET 21.8 7.11 347 1.8
DRY 22.0 7.45 1470 1.0
1R WET 21.9 6.72 20.2 6.8
DRY 22.0 7.08 107.6 41.0
2R WET 21.9 6.74 24.8 7.8
DRY 22.1 8.56 93.8 36.6
3R WET 21.4 6.91 26.0 7.5
DRY 22.0 8.42 102.0 35.5
4R WET 22.3 6.79 26.2 7.6
DRY 22.4 8.54 118.0 148.3
5R WET 21.6 6.90 29.9 17.7
DRY 22.0 8.52 122.0 180.1
6R WET 22.3 6.84 30.7 17.6
DRY 22.4 8.52 121.7 185.8
7R WET 22.5 6.88 43.5 18.1
DRY 22.2 8.60 133.9 222.0
8R WET 21.5 6.90 32.10 19.2
DRY 22.4 8.45 131.6 225.1
WHO Cool 6.5-9.5 - 5.0
Table 1: Mean values for physiochemical parameters From the above data it’s clear that the temperature for both ground and surface water are good for healthy drinking water. For the pH all the values are within the recommended WHO standards safe for Borehole two during the wet season which was far below the recommended value. For the turbidity all the surface water was far above the recommended WHO standards in both wet and dry seasons. For the ground water, only borehole 5, 6, and 7 that displayed save drinking water in terms of turbidity for both seasons. Turbidity levels were higher during the dry seasons which would be accounted for due to increase in concentration after having suspended particles being transported during the wet seasons
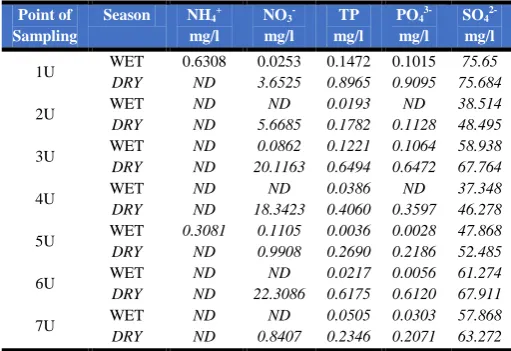
Point of Sampling
Season NH4+
mg/l
NO3-
mg/l TP mg/l
PO43-
mg/l SO42-
mg/l
1U WET 0.6308 0.0253 0.1472 0.1015 75.65
DRY ND 3.6525 0.8965 0.9095 75.684
2U WET ND ND 0.0193 ND 38.514
DRY ND 5.6685 0.1782 0.1128 48.495
3U WET ND 0.0862 0.1221 0.1064 58.938
DRY ND 20.1163 0.6494 0.6472 67.764
4U WET ND ND 0.0386 ND 37.348
DRY ND 18.3423 0.4060 0.3597 46.278
5U WET 0.3081 0.1105 0.0036 0.0028 47.868
DRY ND 0.9908 0.2690 0.2186 52.485
6U WET ND ND 0.0217 0.0056 61.274
DRY ND 22.3086 0.6175 0.6120 67.911
7U WET ND ND 0.0505 0.0303 57.868
Page 368 www.ijiras.com | Email: [email protected]
1R WET 1.0544 0.4005 0.0113 0.0044 46.578
DRY ND 1.5256 0.3269 0.2964 56.208
2R WET 0.7236 0.3123 0.0395 ND 55.490
DRY ND 1.6634 1.2805 0.6940 64.070
3R WET 0.4372 0.3618 0.0241 ND 51.022
DRY ND 1.5960 0.3425 0.3567 51.037
4R WET 0.4341 0.3210 0.0014 ND 34.802
DRY ND 2.073 0.3447 0.3280 47.106
5R WET 0.7689 0.2957 0.0042 ND 40.742
DRY ND 1.5440 0.3064 0.2855 58.011
6R WET 0.8597 0.3308 0.0087 ND 37.984
DRY ND 1.6505 0.3467 0.3189 45.628
7R WET 0.6499 0.4258 0.1261 ND 37.348
DRY ND 2.0817 0.3302 0.2893 49.382
8R WET 0.4593 0.4005 0.0192 ND 53.364
DRY ND 2.4637 0.3249 0.2987 56.563
WHO - 50 10 1.0 250
Table 2: Mean concentration of nutrients load From the above results it’s clear that nutrients load exceeds the recommend WHO limits. There was a clear display of high levels of nutrients in both ground and surface water during the dry season than during the wet season safe for ammonia which displayed the reverse of this. This may be explained by the fact that due to evaporations nutrient loaded by runoffs during the rain seasons displayed a higher concentration.
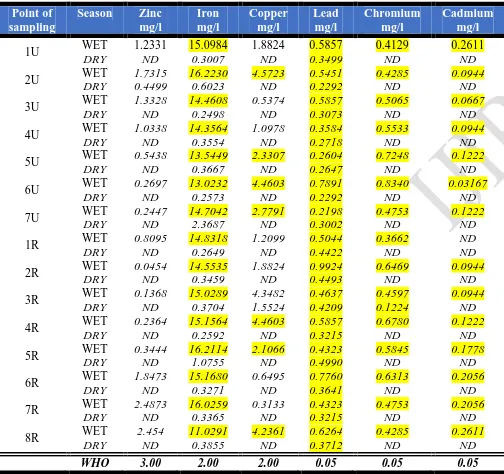
Point of sampling
Season Zinc
mg/l Iron mg/l
Copper mg/l
Lead mg/l
Chromium mg/l
Cadmium mg/l
1U WET 1.2331 15.0984 1.8824 0.5857 0.4129 0.2611
DRY ND 0.3007 ND 0.3499 ND ND
2U WET 1.7315 16.2230 4.5723 0.5451 0.4285 0.0944
DRY 0.4499 0.6023 ND 0.2292 ND ND
3U WET 1.3328 14.4608 0.5374 0.5857 0.5065 0.0667
DRY ND 0.2498 ND 0.3073 ND ND
4U WET 1.0338 14.3564 1.0978 0.3584 0.5533 0.0944
DRY ND 0.3554 ND 0.2718 ND ND
5U WET 0.5438 13.5449 2.3307 0.2604 0.7248 0.1222
DRY ND 0.3667 ND 0.2647 ND ND
6U WET 0.2697 13.0232 4.4603 0.7891 0.8340 0.03167
DRY ND 0.2573 ND 0.2292 ND ND
7U WET 0.2447 14.7042 2.7791 0.2198 0.4753 0.1222
DRY ND 2.3687 ND 0.3002 ND ND
1R WET 0.8095 14.8318 1.2099 0.5044 0.3662 ND
DRY ND 0.2649 ND 0.4422 ND ND
2R WET 0.0454 14.5535 1.8824 0.9924 0.6469 0.0944
DRY ND 0.3459 ND 0.4493 ND ND
3R WET 0.1368 15.0289 4.3482 0.4637 0.4597 0.0944
DRY ND 0.3704 1.5524 0.4209 0.1224 ND
4R WET 0.2364 15.1564 4.4603 0.5857 0.6780 0.1222
DRY ND 0.2592 ND 0.3215 ND ND
5R WET 0.3444 16.2114 2.1066 0.4323 0.5845 0.1778
DRY ND 1.0755 ND 0.4990 ND ND
6R WET 1.8473 15.1680 0.6495 0.7760 0.6313 0.2056
DRY ND 0.3271 ND 0.3641 ND ND
7R WET 2.4873 16.0259 0.3133 0.4323 0.4753 0.2056
DRY ND 0.3365 ND 0.3215 ND ND
8R WET 2.454 11.0291 4.2361 0.6264 0.4285 0.2611
DRY ND 0.3855 ND 0.3712 ND ND
WHO 3.00 2.00 2.00 0.05 0.05 0.05
Table 3: Mean values for concentration of heavy metals
ZINC
Figure 1
Zinc is very essential micronutrient in human being and only at very high concentration; it may cause some toxic effect. From the above it clear that the levels of zinc in both seasons in both ground and surface water were below the WHO standards. Though wet seasons displayed higher levels of zinc than during the dry season. This can be attributed to runoffs which may transport zinc ions into the river and into bore holes
IRON
Figure 2
Iron in drinking water is present as Fe2+ or Fe3+ in suspended form. It comes into water from natural geological sources, industrial wastes, and domestic discharge and also from byproducts. This may explain the cause of high levels of iron in the wet seasons over the dry.
LEAD
Figure 3
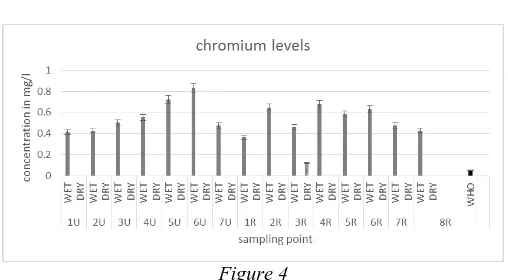
Page 369 www.ijiras.com | Email: [email protected] CHROMIUM
Figure 4
During the wet season, the levels of chromium in all the water samples wet above the recommended levels by the WHO.
CADMIUM
Figure 5
Like in the cases of all the heavy metals, the levels of chromium during the wet seasons were greater than during the dry season and well above the permissible level by the WHO.
IV. CONCLUSION AND RECOMMENDATIONS
From the above results it very clear that for physical parameter there a simultaneous change of parameters from wet to dry seasons for ground and surface water. There is also no significance difference between the levels of heavy metals in surface and ground water within the region. Though a thick line has been drawn between wet and dry seasons with the wet seasons displaying a high level concentration in all the surface and ground water sampled. The High heavy metals concentration has been reported could affect enzymatic and hormonal activities, as well as impede growth rate and may
also increase mortality rate (Bubb and Lester, 1991), thus the need to always assess and closely monitor water quality especially in the rural areas. This therefore is a wakeup call for the county government to ensure that water is thoroughly treated especially during the wet seasons to lower the levels of heavy metals to avert the crises which would be caused by bio- accumulation.
ACKNOWLEDGEMENTS
The authors would like to acknowledge the various institution within the county for allowing the use their ground water for this study.
REFERENCES
[1] Bubb, J. M. and Lester, J. N. The impact of heavy metals in lowland rivers and the implications for man and the environment. Science Total Environment, 1991; 100: 207- 233.
[2] Censi, P., Spoto, S. E., Saiano, F., Sprovieri, M., Mazzola, S., Nardone, G., Di Geronimo, S. I., Punturo, R., Ottonello, D., (2006). Heavy metals in coastal water systems. A case study from the northwestern Gulf of Thailand. Chemosphere, 64: 1167– 1176.
[3] Merritts, D., Dewet, A. and Menking, K. (1998). Environmental geology, an earth system science approach. W.H. Freeman and Company. New York, NY (1998).pp 215.
[4] Mzimela, H.M., Wepener, V. and Cyrus, D.P. (2003) Seasonal variations of selected metals in sediments, water and tissue of the groovy Mullet, Liza dumerelli from Mhlathuze estuary South Africa. Mar.Poll.Bul, 46,659-676.
[5] Nkono, N.A. and Asubiojo, O.I. 1998. Elemental composition of drinking water supplies in three states in southeastern Nigeria. Journal of Radioanalytical and Nuclear Chemistry, 227
[6] Ogola, J.S., Mitullah.W.V. and Omulo, M.A., (2001). Impact of gold mining on the environment and human health. A case study in the Migori Gold Belt, Kenya. Journal of Environmental Geochemistry and Health. 24, 141-158.