Optimization of Process Parameters in
Electro-Discharge Machining using Taguchi Method
Shivam Goyal Anbesh Jamwal
Assistant Professor U.G. Student
Department of Mechanical Engineering Department of Mechanical Engineering SRM University, NCR Campus, Ghaziabad, India SRM University, NCR Campus, Ghaziabad, India
Ravi Pandey
U.G. Student
Department of Mechanical Engineering SRM University, NCR Campus, Ghaziabad, India
Abstract
Electric discharge machining is the essential non-traditional machining process. Basically the EDM is mainly used for the hard metals or those materials which are difficult to machine by some other traditional processes. The electric discharge machining process based upon the thermo electric energy between the workpiece and electrode. In this the material removal is occurred electro thermally by a series of successive discharges that are between the electrode and workpiece. With the help of optimization techniques we can attain the best manufacturing environment, which is an essential need for industries to improve the manufacturing qualities of products at the lower cost. This research paper aims to investigate the optimal set of process parameters such as pulse on time, voltage, current in the Electric discharge machining process to achieve results like higher material removal rate, better surface finish and lesser tool wear rate. The experiment is done on the Mild steel AISI18 work piece and the electrode taken is of copper. Taguchi method is used to get the optimized result. Graphs and response table are used to find the optimal levels of the parameters in the Electric discharge machining. The result revealed that the current, voltage & pulse on time have a great influence on the MRR, TWR and surface roughness. At higher value of Voltage, lower value of current & lower value of pulse on time we get the best optimal values of MRR, Ra & TWR.
Keywords: Electric discharge machining, AISI18 steel work-piece, copper electrode, Current, Voltage, Pulse on time, Taguchi L9 orthogonal array, Miinitab-17, S/N ratio, Surface Roughness (Ra), Material Removal Rate(MRR), Tool Wear Rate(TWR)
________________________________________________________________________________________________________
I. INTRODUCTION
Electro Discharge Machining (EDM) is an electro-thermal non-traditional machining process in which electrical energy is used to generate electrical spark and material removal mainly occurs due to thermal energy of the spark. Electric discharge machining is mainly used to machine those materials which are difficult to machine with other traditional processes. There is no direct contact of the electrode and work piece in the EDM. So the machining problems like the stresses and the vibrations does not arise during the machining processes.
EDM is the thermal erosion process in which metal is removed by a series of recurring electrical discharges between a cutting tool acting as an electrode and a conductive work piece, in the presence of a dielectric fluid. This discharge occurs in a voltage gap between the electrode and work piece. Heat from the discharge vaporizes minute particles of work piece material, which are then washed from the gap by the continuously flushing dielectric fluid.
II. MATERIALS AND METHODS
Edm Machine (Press Mach-A25):
A EDM Machine “Press Mach-A25” made by TOOLCRAFT is used to carry out the experimentation. Table – 1
Specification of the EDM Machine (Press Mach A-25)
Pulse Generator A25
Working Current 5-9 Amp
Type of Pulse STD/EQUI-ENERGY
Surface Finish Cu-Steel ≤0.5 microns CLA
Electrode Wear ≤0.3 %
Selection of Machining Tool:
The cutting tool selected for present work is copper cylindrical electrode of diameter 12.50 mm. Density of copper is 8.96 gm. /cm3.
Selection of Work Piece Material:
The work piece used for current work is AISI 1018 steel. Density of AISI 1018 Steel is 7.87 gm/cm³. Table – 2
Composition of AISI 1018 Steel
Carbon, C 0.14 - 0.20 %
Iron, Fe 98.81 - 99.26 % (as remainder) Manganese, Mn 0.60 - 0.90 %
Phosphorous, P ≤ 0.040 %
Sulfur, S ≤ 0.050 %
Selection of Machining Parameters
The following process parameters, used in this work are shown in table: Table – 3 Machining Parameters
Polarity Positive Current 5-9 amp Voltage 40-50 volt Pulse on time 50-200µs
Duty factor 0.7
Process Parameters and Levels Used In the Experiment:
The machining process is done on the EDM by taking Current, Voltage & Pulse on time as process parameters. The parameters and the levels used in the process are shown in table:
Table – 4
Process Parameters and Levels Used In the Experiment Levels Voltage Current Pulse on time
Level 1 40 5 50
Level 2 45 7 150
Level 3 50 9 200
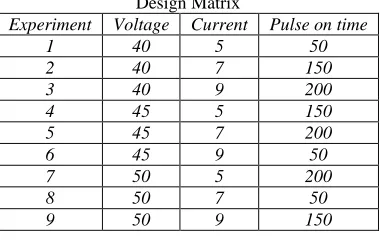
Design Matrix:
According to the present work there are three levels and three factors. So according to Taguchi approach we selected L9 orthogonal array. With the help of minitab-17 following design matrix has been formed.
Table – 5 Design Matrix
Experiment Voltage Current Pulse on time
1 40 5 50
2 40 7 150
3 40 9 200
4 45 5 150
5 45 7 200
6 45 9 50
7 50 5 200
8 50 7 50
9 50 9 150
III. RESULTS AND DISCUSSIONS
The design matrix is formed by using minitab 17 software. According to design matrix, experiments are performed. By using the readings of experiments we calculate MRR, Ra & TWR as follows:
Material Removal Rate (MRR):
The material removal rate is generally described as the volume of metal removed per unit time. To calculate MRR following equation is used to calculate the Material Removal Rate (MRR):
MRR(mm3⁄min.) =[Initial Weight of workpiece (gm. ) − Final Weight of workpiece (gm. )]
Surface Roughness (Ra):
Roughness measurement has been done using a portable stylus-type profilometer, Mitutoyo- Surftest SJ- 201P/M. The evaluation length of 2.5 mm is used to measure response Ra value in µm.
Tool Wear Rate (TWR):
The Tool Wear Rate is generally described as the volume of metal removed per unit time. To calculate TWR, following equation is used:
TWR(mm3⁄min.) =[Initial Weight of Tool (gm. ) − Final Weight of Tool (gm. )]
Density (gm. mm⁄ 3) × Machining Time (min. )
Response Table:
Response table for the experimental design matrix is shown in table. Table – 6
Response Table of MRR, Ra & TWR
S.N. VOLTAGE PULSE ON
TIME CURRENT
Change in Wt.
M/C
time MRR
Surface Roughness
Change in wt.
Tool Wear Rate
1 40 50 5 1.058 12 11.23142 3.4897 0.0031 0.032909
2 40 150 7 1.527 12 16.21019 6.1015 0.0045 0.047771
3 40 200 9 1.614 12 17.13376 7.3028 0.0057 0.06051
4 45 50 7 1.3 12 13.80042 3.7105 0.0041 0.043524
5 45 150 9 1.89 12 20.06369 7.4959 0.0054 0.057325
6 45 200 5 1.331 12 14.12951 6.2275 0.0039 0.041401
7 50 50 9 2.3 12 24.41614 5.9096 0.0048 0.050955
8 50 150 5 1.642 12 17.431 7.1047 0.0041 0.043524
9 50 200 7 2.135 12 22.66454 8.8339 0.0046 0.048832
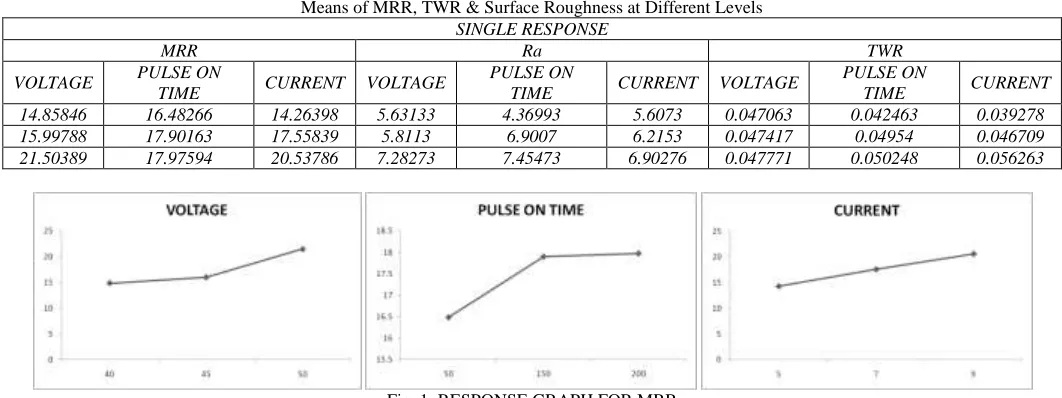
Analysis of Single Response Table:
The optimal settings and the optimal values for MRR, Ra & TWR are determined individually by Taguchi’s approach. Table shows these individual optimal values and its corresponding settings of the process parameters for the specified performance characteristics.
Table – 7
Means of MRR, TWR & Surface Roughness at Different Levels SINGLE RESPONSE
MRR Ra TWR
VOLTAGE PULSE ON
TIME CURRENT VOLTAGE
PULSE ON
TIME CURRENT VOLTAGE
PULSE ON
TIME CURRENT
14.85846 16.48266 14.26398 5.63133 4.36993 5.6073 0.047063 0.042463 0.039278
15.99788 17.90163 17.55839 5.8113 6.9007 6.2153 0.047417 0.04954 0.046709
21.50389 17.97594 20.53786 7.28273 7.45473 6.90276 0.047771 0.050248 0.056263
Fig. 1: RESPONSE GRAPH FOR MRR
Interpretation of Plots FOR MRR:
The data gathered from the experimental work is ploted. The above graphs shows the optimum level for MRR. These optimal values for MRR are plotted in three graphs: one based on voltage, and another two are based on current & pulse on time.
- BASED ON VOLTAGE: From the graph it is clear that with the increase in voltage, MRR also increases. - BASED ON PULSE ON TIME: With the increase in pulse on time, the value of MRR also increases.
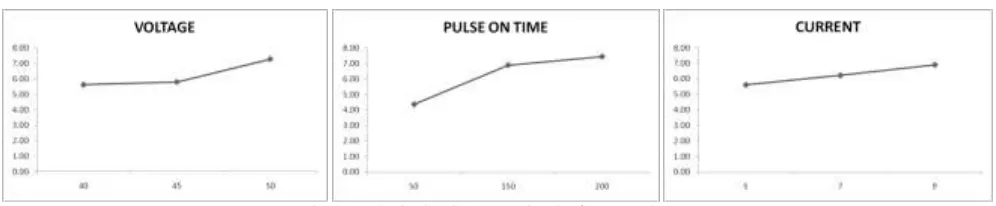
Fig. 2: RESPONSE GRAPH FOR Surface Roughness
Interpretation of Plots For Surface Roughness:
- BASED ON VOLTAGE: Surface roughness increases with the increase in voltage.
- BASED ON PULSE ON TIME: With the increase in pulse on time, the value of Surface roughness increases. - BASED ON CURRENT: As the value of current increases, surface roughness also increases.
Fig. 3: RESPONSE GRAPH FOR TOOL WEAR RATE
Interpretation of Plots for Tool Wear Rate:
- BASED ON VOLTAGE: As the value of voltage increases, Tool wear rate also increases. - BASED ON PULSE ON TIME: Tool wear rate increases with the increase in pulse on time. - BASED ON CURRENT: As the value of current increases, Tool wear rate also increases.
Analysis Of Multi-Response Stage:
The S/N ratio considers both the mean and the variability. In the present work, a multi- response methodology based on Taguchi technique and Utility concept is used for optimizing MRR, Ra & TWR. Taguchi proposed many different possible S/N ratios to obtain the optimal process efficiency. Two of them are selected for the present work. Those are,
- Larger the better S/N ratio for MRR
η1= −10 log10[
1 MRR2]
- Smaller the better type S/N ratio for Ra
η2= −10 log10Ra2
- Smaller the better type S/N ratio for TWR
η3= −10 log10TWR2
From the utility concept, the multi-response S/N ratio of the overall utility value is given by
ηobs= W1η1+ W2η2+ W3η3
Where W1, W2 & W3 are the weights assigned to the MRR, Ra & TWR. Weights are defined according to the importance and choice of the operator, customer’s requirements. Weights values taken for W1, W2 & W3 are as follows:
W1 for MRR = 0.35, W2 for Ra = 0.35 W3 for TWR = 0.30
The best combination for process parameters for simultaneous optimization of Material removal rate (MRR), Surface roughness (Ra), &Tool Wear Rate (TWR) is obtained by the mean values of the multi-response S/N ratio shown in Table.
Table – 8
Design Matrix with Multi-Response S/N Ratio S.
N. VOLTAGE
PULSE ON
TIME CURRENT MRR
η1 for MRR
Surface Roughness
η2 for Ra
Tool Wear Rate
η3 for
TWR ηobs
1 40 50 5 11.23142 21.0087 3.4897
-10.8558 0.032909 29.65378 12.44966
2 40 150 7 16.21019 24.19576 6.1015
-15.7087 0.047771 26.41677 10.89549
17.2698
4 45 50 7 13.80042 22.79785 3.7105
-11.3886 0.043524 27.22534 12.16082
5 45 150 9 20.06369 26.04822 7.4959
-17.4965 0.057325 24.83314 10.44305
6 45 200 5 14.12951 23.00254 6.2275
-15.8863 0.041401 27.65973 10.78861
7 50 50 9 24.41614 27.75354 5.9096
-15.4312 0.050955 25.85619 12.06969
8 50 150 5 17.431 24.82644 7.1047
-17.0309 0.043524 27.22534 10.89604
9 50 200 7 22.66454 27.10694 8.8339 -18.923 0.048832 26.22586 10.73212
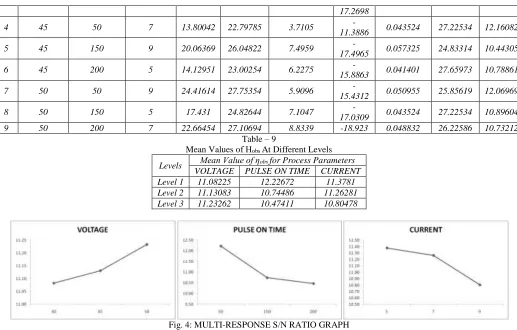
Table – 9
Mean Values of Ηobs At Different Levels
Levels Mean Value of ηobs for Process Parameters VOLTAGE PULSE ON TIME CURRENT
Level 1 11.08225 12.22672 11.3781
Level 2 11.13083 10.74486 11.26281
Level 3 11.23262 10.47411 10.80478
Fig. 4: MULTI-RESPONSE S/N RATIO GRAPH
Interpretation of Plots:
The multi response S/N ratio graphs show the optimal level of MRR, Ra & TWR with the variation in parameters i.e. Voltage, Curret & Pulse on time. As there are three process parameters, so there are three graphs: one based on Voltage and another two based on current & pulse on time.
Based on Voltage:
This graph is a plot between the process parameter i.e. Voltage on x-axis and the optimum values obtained from Multi-response table on the y-axis. This graph gives the combined result for MRR, Surface Roughness and TWR. As the voltage is increased from its initial value 40 volts the multi response value for MRR, Ra & TWR also increases. We get the best optimum value for MRR, Ra & TWR at voltage 50 volt.
Based on The Current:
This graph is a plot between the process parameter i.e. Current on x-axis and the optimum values obtained from Multi-response table on the y-axis. This graph also gives the combined result for MRR, Surface Roughness and TWR. From the graph the max. Value of multi response is at current value of 5 Amp. So we get the optimum values of MRR, Ra & TWR, at lower value of current.
Based on Pulse on Time:
This graph is a plot between the process parameter i.e. Pulse on time on x-axis and the optimum values obtained from Multi-response table on the y-axis. This graph also gives the combined result for MRR, Surface Roughness and TWR. With the increase in pulse on time the value obtained from multi response reduces. So we get the best optimum values for MRR, Ra & TWR at lower value of pulse on time i.e. 50µm.
IV. CONCLUSION
1) Individually MRR increases with increasing voltage, increasing current & increasing pulse on time. 2) With the increase in Voltage or current or pulse on time, Surface roughness increases.
3) The min. Tool Wear Rate is obtained at lower values of Voltage, Current & Pulse on time. So with the increase in Voltage or current or pulse on time, Tool Wear Rate increases.
4) At higher value of Voltage, lower value of current & lower value of pulse on time we get the best optimal values of MRR, Ra & TWR. So the machining parameters should be set as higher voltage, lower current and lower pulse on time.
REFERENCES
[1] Dr. S. Senthil, Unconventional Machining Process (A.R.S. Publications)
[2] Chandramouli S. , Eswaraiah K. and Shirinivas B. (2014), “Electrical Discharge Machining using the Taguchi method” , International Journal of Advanced Mechanical Engineering, ISSN 2250-3234 Volume 4, Number 4 (2014), pp. 425-434 (Research India Publication) .
[3] Raghuraman S. , Tiruppathi K. , Panneerselvam T. , Santosh S. (2013), “ Electric Discharge machining using the Taguchi method for the mild steel IS 2026” , International Journal of Innovative Research in Science, Engineering and Technology, Vol. 2, Issue 7, July 2013.
[4] Daneshmand S , Kahrizi F.E, Neyestanak L.A.A, Monfared V.(2014), “Optimization of electrical discharge machining parameters for niti shape memory alloy by using the Taguchi method”. Journal of Marine Science and Technology, Vol. 22, No. 4, pp. 506 512 (2014 ) DOI: 10.6119/JMST-013-0624-1. [5] Raut G.T. , Shinde M.Y.(2015), “ A review on the optimization of machining parameters in EDM”. International journal of innovative research in science.
Vol.4, Issue 3.
[6] Pradhan M. , Bhoi R.K. , Rana S. (2015). “Optimization of operating parameters for EDM process based on the Taguchi Method”. International Journal of Recent Technology and Engineering (IJRTE) ISSN: 2277-3878, Volume-4 Issue-4.
[7] Banker K. , Prajapati U. , Prajapati J. , Modi P.(2014). “Parameter optimization of Electro Discharge Machine of AISI 304 Steel by using Taguchi Method”. International Journal of Application or Innovation in Engineering Management. Volume 3, Issue 8, August 2014,ISSN 2319 – 4847.
[8] Pichai J. , Kamonpong J.(2012), “ Investigation of Electric Discharge Machining of Tungsten Carbide using EDM-C3 Electrode material”,European Journal of Scientific research 76(1), pp 133-142.
[9] Puertas, I., Lusis, C.J., 2003, ―A study on the machining parameters optimization of electrical discharge machining‖, Journal of materials processing technology, 521-526 .
[10] P.M. George, B.K. Raghunath, L.M. Manocha, Ashish M.Warrier, “ EDM machining of carbon- carbon composite- a Taguchi approach”, journal of Material processing Technology, pp.66-71, 2004
[11] S.R.Nipanikar, “parameter optimization of electro discharge machining of AISI D3 steel material by using taguchi method”, Journal of Engineering Research and Studies, ISSN0976-7916, Vol. 3, issue 3, pp.7-10, 2012