RESEARCH ARTICLE
ISSN: 2348-8948 Vol: 2; Issue: 9DEVELOPMENT OF ISOSORBIDE-5-MONONITRATE
SUSTAINED RELEASE MATRIX TABLET BY
STATISTICAL OPTIMIZATION TECHNIQUE
R B. PRAKASH RAO*, K.VIJAY1, C. NARENDRA2, JITENDRA3
*, 1 Karnataka College of Pharmacy,
Department of Pharmaceutical Technology, Bangalore, India
2, 3
Visveswarapura Institute of Pharmaceutical Sciences, Department of Pharmaceutics, Bangalore, India
Date Received: 06-Aug-2014
Date of Accepted: 26-Aug-2014
Date Published: 11-Sep-2014
710
Abstract:
The aim of the project is to prepare and optimize the sustained release matrix tablets of Isosorbide-5-mononitrate (ISMN). Elimination half-life of ISMN is 4-5 h and has to be administered 2-3 times a day. In order to reduce the dosage frequency and to increase patient compliance sustain release preparation was made. The tablets were formulated by wet granulation technique using HPMCK4M, Eudragit NE30D, and Ethylcellulose polymers. The constrained mixture experimental design was used to prepare systematic model formulations, which were composed of thee formulation variables: the content of HPMCK4M, Eudragit NE30D, and Ethylcellulose. Prepared tablets were evaluated for hardness, friability, % drug content. Drug release was evaluated in phosphate buffer pH-6.8 and the drug release responses were evaluated at 1 h, 2 h, 4 h, and 6 h. The result shows that the HPMC is a major release-retarding polymer. Result of optimized formula coincided well with the predicted value, indicating it was quite useful for optimizing pharmaceutical formulation. The analysis of the release profiles in the light of distinct kinetic models (zero-order, first-order, Higuchi, Peppas) shows that the value of release exponent n for all formulation ranging from 0.4633-0.7184, which indicate that the mechanism of release is anomalous diffusion. This is due to the coupling of diffusion and relaxation.
Keywords:
Sustained Release, Isosorbide-5-mononitrate, Higuchi, Peppas, Anamolous diffusion
Introduction
Isosorbide-5-mononitrate (ISMN) is an active metabolite of the vasodilator isosorbide-5-dinitrate and is used in the long-term management of the angina pectoris and heart failure. An elimination half-life of about 4-5 hours has been reported. The usual oral dose is 20 mg 2-3 times daily, although dose ranging from 20-120 mg daily have been given.1 Sustained release oral delivery systems are designed to achieve therapeutically effective concentrations of drug in the systemic circulation over an extended period of time, thus achieving better patient compliance and allowing a reduction of both the total dose of drug administered and the incidence of adverse side effects.2 Among the different approaches studied with this aim, matrix systems still appear as one of the most attractive from
both the economic as well as the process development and scale-up points of view.3 It has been shown that the suitable combination of more types of polymers as
matrix-forming materials enables appropriate
modifications of the release characteristics of the drug from the dosage form.4 The use of mixtures of polymers represents a potential way of achieving required release properties.5
In the development of extended release dosage form, an important issue was to design an optimized
pharmaceutical formulation with appropriate
The optimization procedure involved systematic formulations design to minimize the number of trials, and analyze the response surfaces in order to realize the effect of causal factors and to obtain the appropriate formulations with target goals as well as the acceptable component region as process control conditions in practical preparation.
2. Materials and Methods 2.1. Materials
ISMN was received as gift sample from M/S. Zydus Cadila limited, Ahmedabad, India. HPMC K4M, Eudragit NE30D, Ethylcellulose were obtained from M/S. Bangalore Pharmaceutical Research Laboratory, Bangalore, India. Potassium di-hydrogen orthophosphate, NaOH were of analytical grade and supplied by M/S. Qualigens Limited, India. Methanol and Water used were of HPLC grade and supplied by M/S Merck Limited, India. All other chemicals were purchased from commercial sources and were of analytical grade.
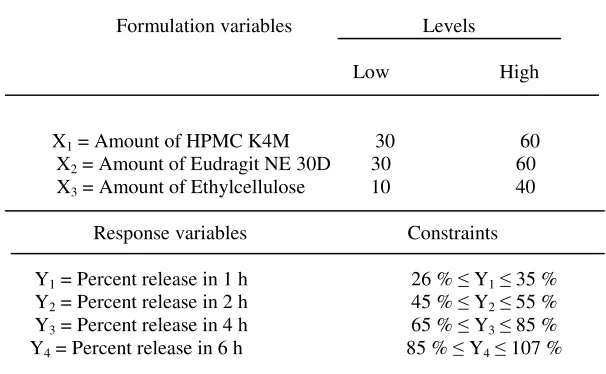
2.2. Experimental design
Here simplex design was utilized to optimize the formula. The formulation variables and their ranges were chosen from the knowledge obtained from the preliminary studies.9 HPMC K4M (X1), Eudragit NE30D
(X2), Ethylcellulose (X3) were chosen as formulation
variables and the drug release percent at 1 h, 2 h, 4 h, 6 h were selected as response variables. The levels of excipients were set at HPMC (X1): 30-60 mg; Eudragit
NE 30D (X2): 30-60 mg; Ethylcellulose (X3): 10-40mg.
(Table No 1)
2.3. Preparation of ISMN matrix tablet
Dissolve ethylcellulose in isopropyl alcohol and put aside for sometime to dissolve. Then add Eudragit NE 30D to the above solution and dissolve. Mix Isosorbide-5-mononitrate, lactose and hydroxypropylemethylcellulose in polythene bag and then granulate it with above solution in mortar and pestle. Then the wet component was passed through a 24-mesh sieve. Dry at 400C for 3 h in hot air oven (Model DTC, PROTROL, and India) and kept it for air-drying for 30 min. Then blended with magnesium stearate and talc and compressed using 9.5 mm diameter flat-faced punch (Cadmach, Zydus Cadila, India) under the 4-5 kg compression force.
2.4. In-vitro dissolution studies
The USP paddle method (Electrolab TDT-08L, India) was used for all the vitro dissolution studies. The in-vitro release studies were carried were carried out at 37 ± 0.5 0C for 8 h. The stirring rate was 100 RPM. The dissolution medium was a pH-6.8 Phosphate buffer (900 ml). The samples (10 ml) were withdrawn at predetermined time and replaced with an equivalent
amount of fresh medium. The samples were filtered through a 0.45µm nylon membrane filter and analyzed by HPLC method. Dissolution studies were performed two times for each batch of tablets and the results were registered as an average.
2.5. HPLC analysis
The samples were analyzed using High Performance Liquid Chomatography (LC-10AT VP, Shimadzu, Japan) using RP-18 Column (250 × 4.6 mm and 5 µm particle size- Phenomanex). A mobile phase consisting of water: methanol (80:20). A flow rate of 1 ml/min was employed and wavelength of UV detector was set at 220 nm. 20 µl samples were injected every time.
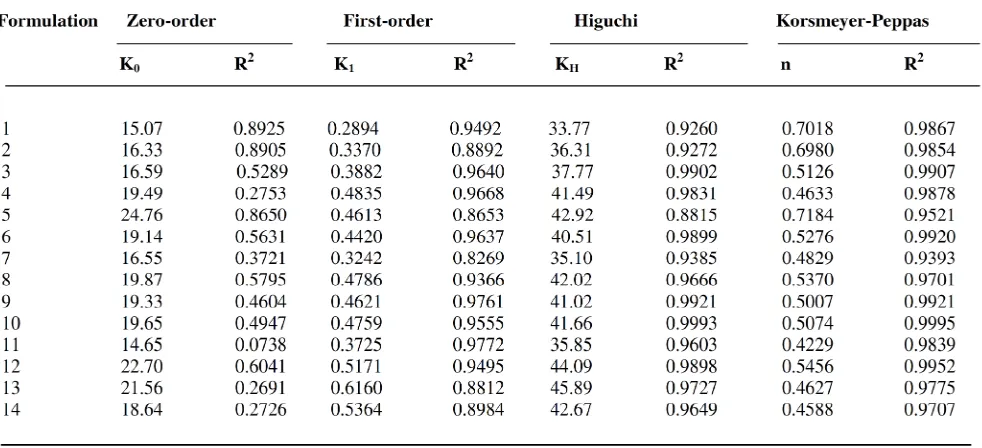
2.6. Curve fitting
The kinetics of ISMN release from matrix tablet was determined by finding the best fit of the dissolution data to distinct models: zero-order (eq. 1), Higuchi (eq. 2), first-order (eq. 3), Korsmeyer-Peppas (eq. 4) 10, 11 Mt = M0 + K0t ______(1)
Mt is the amount of drug released at time‘t’, M0 is the
concentration of drug in the solution at t = 0, K0 is the
zero-order release constant. Mt = kHt1/2 ________eq. (2)
Mt is the amount of drug release at time √t and kH is the
Higuchi release constant. Mt = M ∞(1-e
-k1t
) ________eq. (3)
Mt is the amount of drug released at time‘t’, M∞ being the total amount of drug in the matrix and k1 the
first-order kinetic constant. Mt/M∞ = kKPtn ______eq. (4)
Mt/M∞ is fraction of drug released at time‘t’, kKP the
release rate constant comprising the structural geometric characteristics of the tablets and n the release exponent. For the case of cylindrical tablets, n ≤ 0.45 corresponds to a Fickian diffusion release (case I diffusional), 0.45 < n ≤ 0.89 to an anomalous (non-Fickian) transport, n = 0.89 to a zero order (case II) release kinetics, and n > 0.89 to a super case II transport.
2.7. Regression analysis12
The effect of formulation variables on the response variable were statistically evaluated by applying one-way ANOVA using a commercially available software package DESIGN-EXPERT® version 6.05 (stat-ease Inc.). To describe the response surface curvature, the design was evaluated by linear model, which bears the form of equation,
Y = b1X1 + b2X2 + b3X3
Where, Y is the response variable, b1, b2, b3 are the
regression coefficients X1, X2, X3 are the formulation
variables.
2.8. Scanning electron microscopy 13
Avalabile online at www.ijpda.com
B.Prakash rao et al; Int.J.Pharm Drug Anal Vol: 2 Issue:9 Page:710-718
712
Fig.1 Contourgraph for release 1hFig.2 Contourgraph for release 2h
Fig.3 Contourgraph for release 3h
DESIGN-EXPERT Pl ot
Rel 4hr
Desi gn Poi nts X1 = A: K4M X2 = B: NE30D X3 = C: EC
A: K4M 60.00
B: NE30D 60.00
C: EC 40.00
10.00 30.00
30.00
Rel 4hr 73.043
77.1462
81.2494
85.3526
89.4557 2 2
2 2
2
Fig No. 6 SEM study of intact and dry tablet 1. SEM of intact tablet (fractured portion)
3. SEM of dry tablet (fractured portion)
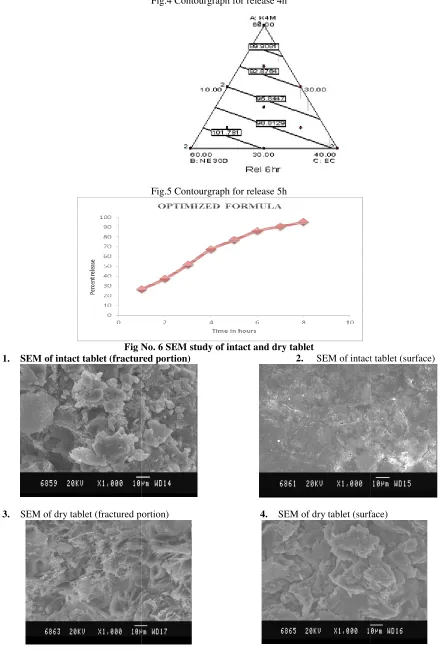
Fig.4 Contourgraph for release 4h
Fig.5 Contourgraph for release 5h
Fig No. 6 SEM study of intact and dry tablet
SEM of intact tablet (fractured portion) 2. SEM of intact tablet (surface)
SEM of dry tablet (fractured portion) 4. SEM of dry tablet (surface)
SEM of intact tablet (surface)
Avalabile online at www.ijpda.com
B.Prakash rao et al; Int.J.Pharm Drug Anal Vol: 2 Issue:9 Page:710-718
714
with JFC-1100E Ion sputtering device. The samples werefixed on a brass stub using double-sided tape and then gold coated in vacuum by a sputter coater. All the samples were examined with a SEM at an accelerating voltage of 20 kV. SEM was performed on intact and dry tablet (for that tablet was allowed to hydrate overnight in dissolution medium and then dried at 40 0C for 7-8 h in hot air oven (Model DTC, PROTROL, India) to observe the changes in surface topography due to some degree of swelling and erosion.
Results and Discussions
Effect of formulation variables on percentage ISMN release at different h
In order to evaluate the effect of formulation ingredients on the dissolution pattern, the causal factor and response variables were related using linear model with statistical analysis. The values of the coefficients X1, X2, X3 are
related to the effect of these variables on the response. The contour plots illustrating the simultaneous effect of the causal factors on individual response variables. A positive sign of co-efficient indicates a synergistic effect upon the response. The larger co-efficient means the causal factor has more potent influence on the response. The factors affecting the release were X1= K4M, X2=
NE30D, X3= EC. In case of release from formulation
within one hour the Linear equation is
Y1h = 0.21511 X1+ 0.60279 X2 + 0.38012 X3
The ANOVA of the mixture linear model for Y1h holds
significant with probability value of 0.0401 with R2 value 0.4428 and R-adjusted is 0.3414 in the model. The coefficients of factors are positive in which NE30D have the major effect, which indicates that NE30D is contributing for the release. In the other two factors, EC had more effect than K4M.
In case of release of drug from formulations within 2 h the Linear equation is
Y2h = 0.27555 X1 + 0. 73747 X2+ 0.68250 X3
The ANOVA of the mixture linear model for Y2h holds
significant with probability value of 0.0204 with R2 value 0.5074 and R-adjusted is 0.4178 in the model. The major contributing factors are NE30D and EC because of swelling property and the least contributing factor is K4M, which indicates that K4M is controlling the release by forming matrix.
In case release of drug from formulations within 4 hours, the equation is
Y4h = 0.38430 X1+ 1.205 X2+ 0.97281 X3
The ANOVA of the mixture linear model for Y4h holds
significant with probability value of 0.0053 with R2 value 0.6148 and R-adjusted is 0.5447 in the model. In case of release with in 4 hours the releasing factors are similar to release in the 2 hours. Overall the controlling factor for achieving the sustained dosage form is HPMC K4M,
which is forming matrix. Similar results are observed in case of release within 6 hours. For release of drug from formulation within 6 h, the equation is,
Y6h = 0.65 X1 + 1.25 X2+ 1.04 X3 The ANOVA of the
mixture linear model for Y6h holds significant with
probability value of 0.0024 with R2 value 0.6655 and R-adjusted is 0.6047 in the model.
The range of these responses was restricted to 26 ≤ Y1≤
35, 45 ≤ Y2≤ 55, 65 ≤ Y3≤ 85, 85 ≤ Y4≤ 107 (Table-1).
Under these conditions, these four responses were then combined to determine an all over optimum region. An optimum response was found with Y1, Y2, Y3, Y4 of
34.81%, 45.51%, 68.98%, 86.97% at X1, X2, X3 values
of 59.94, 30.04, and 10.02 respectively. To verify these values the optimum formulation was prepared according to the above values of the factor and subjected to the dissolution test. The dissolution profiles of the optimum formulation and the predicted profile are shown in table.
Conclusions: HPMC is the major release controlling polymer and each polymer has synergistic effect on release rate. The matrix tablet of isosorbide 5 mono nitrate can be prepared successfully. The mechanism of release kinetics (n value is nearly 0.5) is non-Fickian or nearly diffusion controlled. The hardness is 5 kg/cm2 which can withstand mechanical stress. FTIR studies revealed that there is no chemical interaction with other excipients. SEM studies revealed that gel is formed. The simplex model is significant with linearity.
Reference:
1. Martindale, 2002. The Extrapharmacopoeia, 33rd Ed. The Pharmaceutical press, London, p. 916. 2. Vergnaud, J.M., 1993. Controlled drug release from
oral dosage forms. Ellis Horwood Limited, London. 3. Lordi, N., 1986. Sustained release dosage forms. In:
Lachman, L., Lieberman, H.A., Kanig, J.L. (Eds.), The theory and practice of Industrial Pharmacy, 3rd. Lea and Febiger, Philadelphia, p. 430-478.
4. Rey, H., Wagner, K.G., Wehle, P., Schmidt, P.C., 2000. Development of matrix-based theophylline sustained release microtablets. Drug Dev. Ind. Pharm. 26, 21-26.
5. Juarez H, Rico G, Villafuerte L, 2001. Influence of admixed Carboxymethylcellulose on release of 4-aminopyridine from HPMC matrix tablets. Int. J. Pharm. 216, 115-125.
6. Singh S.K., Dodge J, Durrani M.J., Khan M., 1995. Factorial design in the feasibility of producing Microcel MC 101 pellets by extrusion spheronization. Int. J. Pharm. 115, 53-60.
mixtures. Int. J. Pharm. 131, 9-17.
8. Bouckaert, S., Massart, D.L., Massart, B., Rremon, J.P., 1996. Optimization of a granulation procedure for a hydrophilic matrix tablet design. Drug Dev. Ind. Pharm. 22, 321-327.
9. T. Higuchi, 1961. Rate of release of medicaments from ointment bases containing drugs in suspension. J. Pharm. Sci. 50, 874-875.
10. T. Higuchi, 1963. Mechanism of sustained-action medication. Theoretical analysis of rate of release of solid drugs dispersed in solid matrices. J. Pharm. Sci. 52, 1145-1149.
11. P.L Ritger, N.A. Peppas, 1987. A simple equation for description of solute release. II. Ficlian and anomalous release from swellable devices. J. Control. Release 5, 37-42.
12. R.K Geetanjali, P.S Dimpy, L.Y Hwang. Immune response to hepatitis B vaccination in drug using population: A systematic review and meta-regression analysis. Vaccines. 32, 2265-2274. 13. F.O Onofre, Y.J. Wang. Hydroxypropylated starches
of varying amylose contents as sustained release contents matrices in tablets. Int. J. Pharm.385, 104-112.
Table 1
Variables in the mixture design
Formulation variables Levels
Low High
X1 = Amount of HPMC K4M 30 60
X2 = Amount of Eudragit NE 30D 30 60
X3 = Amount of Ethylcellulose 10 40
Response variables Constraints
Y1 = Percent release in 1 h 26 % ≤ Y1≤ 35 %
Y2 = Percent release in 2 h 45 % ≤ Y2≤ 55 %
Y3 = Percent release in 4 h 65 % ≤ Y3≤ 85 %
Y4 = Percent release in 6 h 85 % ≤ Y4≤ 107 %
Avalabile online at www.ijpda.com
B.Prakash rao et al; Int.J.Pharm Drug Anal Vol: 2 Issue:9 Page:710-718
716
Table . 2 Formulations
S.No Ingredients F1 F2 F3 F4 F5 F6 F7 F8 F9 F10 F11 F12 F13 F14
1. ISMN 30 30 30 30 30 30 30 30 30 30 30 30 30 30
2. Lactose 170.8 170.8 170.8 170.8 170.8 170.8 170.8 170.8 170.8 170.8 170.8 170.8 170.8 170.8
3. Methocel K4M 60 45 45 30 30 30 50 35 35 40 60 30 30 45
4. Eudragit NE
30 D 30 45 30 60 45 30 35 50 35 40 30 30 60 45
5. Ethocel 10 10 25 10 25 40 15 15 30 20 10 40 10 10
6. Carbomer
934P 4 4 4 4 4 4 4 4 4 4 4 4 4 4
7. Talc 10 10 10 10 10 10 10 10 10 10 10 10 10 10
8. Mag. Stearate 18 18 18 18 18 18 18 18 18 18 18 18 18 18
Table No 3
The composition and responses of formulations ISMN matrix tablets
Table no 4
Avalabile online at www.ijpda.com
B.Prakash rao et al; Int.J.Pharm Drug Anal Vol: 2 Issue:9 Page:710-718
718
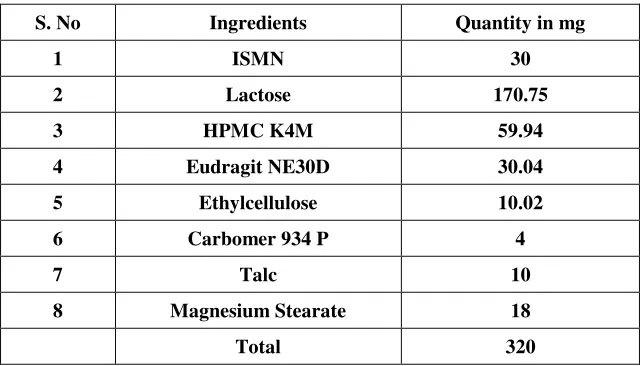
Table no 5Optimized Formula
S. No Ingredients Quantity in mg
1 ISMN 30
2 Lactose 170.75
3 HPMC K4M 59.94
4 Eudragit NE30D 30.04
5 Ethylcellulose 10.02
6 Carbomer 934 P 4
7 Talc 10
8 Magnesium Stearate 18
Total 320
Optimized release formula
Time (h) Percent release
1 26.62
2 37.24
3 51.46
4 67.25
5 76.59
6 85.93
7 90.46