87 2, XIX, 2016
DOI: 10.15240/tul/001/2016-2-006
Introduction
Multiple Criteria Decision Making (MCDM) is all about making choices in the presence of multiple, generally confl icting criteria. Many real-life problems are multi-objective by nature that requires evaluation of more than one criterion. Therefore, MCDM has become an important issue and many researches are devoted to help people make better decision (Montibeller & Franco, 2011; Wang et al., 2015). However, there is no consensus between authors on classification and categorization of MCDM methods. Vincke (1992) suggest the following categories: (1) multiple attribute theory, (2) outranking methods, and (3) interactive methods. Apart from the above, Carlsson & Fuller (1996) classifi es these methods into four quite distinct groups: (1) the outranking methods, (2) the value and utility theory approaches, (3) the interactive multiple objective programming approach, and (4) the methods based on group decision and negotiation theory. Comprehensive reviews of MCDM methods can be found in Figueira et al. (2005), Greco et al. (2010), Zavadskas and Turskis (2011), Liou and Tzeng (2012), Zavadskas et al. (2014) and Mardani et al. (2015), their comparative strengths and weaknesses are presented in Belton & Stewart (2002), Zopounidis and Doumpos (2002) and Zardari et al. (2015).
Following Perny (1998), Fernandez et al. (2010), two main categories of problems can be distinguished: preference oriented problems and similarity oriented problems. In preference oriented problems, the decision-maker (DM) wants to select the best alternative or rank all the alternatives from best to worst. In these problems, alternatives are evaluated and compared according to a set of criteria. Usually, higher ranking value means a better performance of the alternative, so the alternative with the highest rank can be considered as best
one, like in ELECTRE, TOPSIS, PROMETHEE and TODIM methods. The similarity oriented problems require sorting of the alternatives into either homogeneous clusters (relative classifi cation) or into pre-defi ned categories (absolute classification) (Perny, 1998). In case of relative classifi cation, alternatives are divided into clusters based on a set of criteria. According to this approach, most similar alternatives are grouped into a cluster and each alternative’s membership in a specifi c cluster is determined. Therefore, alternatives in the same cluster share many characteristics (i.e. are “similar” to one another), but are very dissimilar to alternatives not belonging to that cluster. In case of absolute classifi cation, alternatives are assigned to some predefi ned and preference-ordered classes. This group of decision problems is referred to as sorting. Profi les are used to defi ne the classes beforehand as, usually, the bound and limits of each class are determined.
In the outranking methods (OMs), the alternatives are compared pairwise or each alternative is compared to the ideal solution. OMs build a preference relation between alternatives evaluated on several attributes or criteria; in other words, comparison between alternatives is internal. Such methods have nothing to do with the distribution of data, and it is possible there is no one alternative fi ts into some classes have already defi ned. However, multiple criteria sorting methods assign alternatives to pre-defi ned ordered categories taking into account several criteria. Multiple criteria sorting methods differ from standard classifi cation in two main features (Zheng et al., 2014): (1) categories are predefi ned and ordered, and (2) the sorting model integrates preferences of a decision maker.
The outranking methods are able to provide models that assist for sorting purposes by
A NOVEL SORTING METHOD TOPSIS-SORT:
AN APPLICATION FOR TEHRAN
ENVIRONMENTAL QUALITY EVALUATION
Hassanali Faraji Sabokbar, Ali Hosseini, Audrius Banaitis,
Nerija Banaitiene
EM_2_2016.indd 87
88 2016, XIX, 2
employing the outranking relation concept. A representative example of MCDA sorting methods based on the outranking relations approach include methods such as ELECTRE TRI (Mousseau & Slowinski, 1998; Mousseau et al., 2001; Lourenço & Costa, 2004; Brito et al., 2010; Sánchez-Lozano et al., 2014; Bouyssou & Marchant, 2015) and ELECTRE-SORT (Ishizaka & Nemery, 2014), the extensions of the ELECTRE III method. As sorting methods, ELECTRE TRI (also called the non-compensatory sorting model (Bouyssou & Marchant, 2007a; 2007b)) and ELECTRE-SORT are used to assign alternatives to pre-defi ned categories (Mousseau et al., 2000; Ishizaka & Nemery, 2014). Similar schemes are also employed by other outranking relations sorting methods such as PROMSORT (Araz & Ozkarahan, 2005) and FlowSort (Nemery & Lamboray, 2008; Janssen & Nemery, 2013), which are based on the PROMETHEE method (Preference Ranking Organization Method for Enrichment Evaluation) (see Brans & Vincke, 1985), a well-known multiple criteria outranking method.
In recent years, many MCDM methods have been developed; the existing approaches have been improved and extended. During recent years, many researchers have investigated applicability of MCDM methods and tools to tackle problems that deal with environmental issues. Among numerous MCDM methods developed to solve real-world decision problems, Technique for Order Preference by Similarity to Ideal Solution (TOPSIS) continues to work satisfactorily in diverse application areas (Jiang et al., 2011; Behzadian et al., 2012; Wu, 2015).
The advantage of TOPSIS is its logicality, rationality and computational simplicity (Jiang et al., 2010; Chen et al., 2011). The classical TOPSIS method (see Jia et al., 2012; Ahmadi et al., 2014; Bilbao-Terol et al., 2014; Mulliner et al., 2016) and its extensions, such as interval TOPSIS (see Giove, 2002; Jahanshahloo et al., 2006; Dymova et al., 2013), fuzzy TOPSIS (see Awasthi et al., 2011; Awasthi & Chauhan, 2012; Bao et al., 2012; Ye & Li, 2014; Lee et al., 2014; Kusi-Sarpong et al., 2015; Şengül et al., 2015), interval-valued fuzzy TOPSIS (see Chen & Tsao, 2008; Ashtiani et al., 2009; Chen, 2015; Mokhtarian, 2015; Zhang & Xu, 2015), and grey TOPSIS (see Chen & Tzeng, 2004; Oztaysi, 2014; Siozinyte et al., 2014; Jiang et
al., 2015), have demonstrated their capabilities and potentials in dealing with MCDM problems of various fi elds.
Sustainability is a complex concept that requires comprehensive analysis (Książek et al., 2015; Xia et al., 2015). Multi criteria decision analysis has been regarded as a suitable set of methods to perform sustainability evaluations (Lazauskaite et al., 2015; Pourahmad et al., 2015). Among numerous MCDM methods employed to solve real world decision problems, Technique for Order Preference by Similarity to Ideal Solution (TOPSIS) continues to be commonly used across different application areas. Jia et al. (2012) utilized both fuzzy AHP and TOPSIS methods for evaluation of the low carbon development (LCD) level of 47 countries (areas). Bilbao-Terol et al. (2014) used TOPSIS for evaluating the countries’ sustainability and the sustainability performance of government bond funds. The proposed tool allows investors express their preferences regarding the
fi nancial and the ESG (environmental, social and governance) goals, thereby helps them make sustainable and responsible investment decisions. Awasthi et al. (2011) presented fuzzy TOPSIS based approach for evaluation and selection of sustainable transportation systems. Ahmadi et al. (2014) presented an integrated approach that combines the input-output analysis and the TOPSIS method to evaluate sustainability in terms of environmental protection in different sectors of the Iranian economy. Aghajani Mir et al. (2016) proposed an improved version of TOPSIS, which is applied to evaluate the environmental performance of municipal solid waste (MSW) management systems. The proposed model could be used to evaluate various environmental problems associated with solid waste management (e.g. waste reduction, transfer stations for MSW, resource recycling, decommissioning and implementation of waste treatment facilities). Mulliner et al. (2016) presented an empirical application and comparison of different MCDM approaches – the Weighted Sum Model (WSM), the Weighted Product Model (WPM), the revised Analytic Hierarchy Process (AHP), Complex Proportional Assessment (COPRAS) and TOPSIS – for assessing sustainable housing affordability. Therefore, TOPSIS is one of the most commonly used MCDM methods to solve problems associated with different environmental issues.
EM_2_2016.indd 88
89 2, XIX, 2016
In this paper, we propose a novel sorting method, TOPSIS-Sort, based on the TOPSIS method. TOPSIS was selected because of its logical concepts and simple computations. Similar to methods discussed previously (e.g. ELECTRE TRI, ELECTRE-SORT and PROMSORT); in the proposed TOPSIS-Sort approach an outranking relation is used for sorting purposes.
The remaining of this paper is organized as follows: In Section 1, we briefl y introduce the classical TOPSIS method. Section 2 elaborates the proposed novel sorting method TOPSIS-Sort. An application of the methodology for Tehran environmental quality evaluation is depicted in Section 3. Finally, our conclusions are presented.
1. Overviews of Sorting Theory
and TOPSIS
1.1 Problems of Sorting
The sorting problem involves the assignment of a set of alternatives
A={a
1, a
2, …, a
n}
into Kpredefi ned ordered classes
C
1, C
2, …, C
K. Here the order of classes is based on its importance, respectively,C
1 is the best class andC
K is the worst class. The defi ned classes can be denoted by linguistic variables such as ‘surely accepted’, ‘acceptable’, ‘rejected’, etc. (Norese & Viale, 2002)A set of reference points is used for sorting, and the alternatives are compared to these reference points. This set of reference points includes a value of reference profi les which specify the theoretical limits between the classes, such as in ELECTRE TRI (Roy & Bouyssou, 1993), or multi-criteria models of a valid (ideal) and a critical (anti-ideal) project, such as in n-TOMIC (Massaglia & Ostanello, 1991).
It is worth noting that sorting problems usually refer to absolute evaluation, i.e., the assignment of an alternative does not depend on the remaining ones (Figueira et al., 2005; Bouyssou & Marchant, 2015). In this case, each alternative is assigned to a class on the base of a predefi ned rule. On the contrary,
both choice and ranking problems are based on relative judgments, involving pairwise comparison between the alternatives (Doumpos & Zopounidis, 2002). Consequently, the evaluation result depends on the considered set of alternatives, i.e., each alternative is compared to the others to determine a preference relation.
1.2 TOPSIS; a Brief Reminder
Technique for order preference by similarity to ideal solution (TOPSIS) is one of the most widely used classical MCDM methods, was
fi rst developed by Hwang and Yoon (1981). A set of criteria
g
1, g
2,…, g
m is used to rank the alternativesa
1, a
2,…, a
n. Two reference points are determined as ideal solutionv
j+ and anti-ideal solutionv
j– on each criterion. The ideal solutionv
j+ represents the best value for thejth criterion and, conversely, the anti-ideal solution represents the worst value for the
jth criterion among all available alternatives. The alternatives with other values lie between these two extremes (
v
j+ andv
j–). The closer an alternative is to
v
j+, better performance on the attribute it represents. Contrarily, the farther an alternative is fromv
j+ and the closer tov
j–, lower value for the attribute it has. As depicted in Fig. 1, Alternative 1 is closer to the negative ideal solution, but farther from the positive ideal solution, whereas Alternative 2 is closer to the positive ideal solution but farther from the negative ideal solution. Thus, Alternative 2 is better choice than Alternative 1 according to the jth criterion. The positive ideal solution (
A
+) is composed of all best values attainable of criteria, and the negative ideal solution (A
–) consists of all the worst values attainable of criteria. Finally, all alternatives are ranked according to their distances from the ideal and the negative ideal solution, i.e., the best alternative has simultaneously the shortest distance from the ideal solution and the farthest distance from the negative ideal solution.Fig. 1: Distance of alternatives from the positive ideal and negative ideal solutions
Source: own
EM_2_2016.indd 89
90 2016, XIX, 2
The TOPSIS method consists of the following steps (Vahdani et al., 2011; Dymova et al., 2013):
1. Normalize the decision matrix
X = (x
ij)
n×musing the equation below.
(1)
2. Calculate the weighted normalized decision matrix
V = (v
ij)
n×m.(2)
where
w
i is the relative weight of the jth criterion, and∑
mi=1
w
j= 1
.3. Determine the positive ideal and negative ideal solutions.
(3)
where
J
and J’ are the set of benefi t criteria and cost criteria, respectively.4. Calculate the Euclidean distances of each alternative from the positive ideal solution and the negative ideal solution, respectively.
(4)
(5)
5. Calculate the relative closeness of each alternative to the ideal solution. The relative closeness of the alternative
A
i with respect toA
+ is defi ned as.(6)
6. Rank the alternatives according to the relative closeness to the ideal solution: the bigger is the
cl
i, the better is the alternativeA
i. The best alternative is the one with the highest relative closeness to the ideal solution.2. TOPSIS-Sort Method
The TOPSIS-Sort method, proposed by this paper, pertains to the extension of TOPSIS in order to sort the alternatives. The sorting of the alternatives requires their comparison to the reference profi les that distinguish the classes. For each class
k
, two reference profi les, the upper limit profi lep
k and the lower limit profi lep
k, are specifi ed. Upper limit is higher value than the lower limit, i.e., the upper limit of the profi le of the fi rst class is greater than the lower limit of the fi rst classp
1>
p
1, and the lower limit of the last class equals the values which are less than the upper limit of the last classp
k< p
k. In other words, all the data values greater than the lower limit of the fi rst class are assigned to the fi rst class, and all the data values less than the upper limit of the last class are properly placed to the last class.There are two ways to use profi les in the proposed model. The fi rst way is to defi ne the threshold values for each profi le based on the decision matrix
X
. Therefore, ‘good’ and ‘bad’ values are assigned to each attribute, and then the position of the attribute values of each alternative in the same interval is determined. The second way is to defi ne the profi les based on the normalized matrix ξ which is calculated using Eq. (7), and then the data can be arranged in the interval [0, 1]. Then, some certain intervals are defi ned for the profi les, for example, very good classC
1= {p
1= 0.9, p
1= 1}
, good classC
2= {p
2= 0.7, p
2= 0.9}
, etc.The decision maker’s preferences are a signifi cant determinant in solving MCDM problem and should be integrated into the decision model. Each criterion has its own domain of possible values. Taking into account this and DM’s preferences with respect to the criteria, the profi le values are determined for each class. The criteria can be classifi ed as either benefi ts or costs. As for the benefi t criteria, the values of the profi les of the higher classes are greater, but they decrease towards the lower classes as their appropriateness decreases. In the cost criteria, the values of higher classes are smaller, but they increase towards the lower classes, because the less costly alternative is the most appropriate one. This technique is very useful when there are some evaluation standards.
The TOPSIS method is based on determination of the distance of each alternative from the positive and negative ideal solutions
EM_2_2016.indd 90
91 2, XIX, 2016
according to the decision criteria. The profi les are defi ned as references in the decision matrix, and the distance of the profi les is measured from the positive and negative ideal solutions similar to alternatives (i.e.
cl
pk andcl
pk). These two values represent the relative closenessof the upper limit of the class
K
to the ideal solution as well as the relative closeness of the lower limit of the classK
to the ideal solution. The values ofcl
i, which lie within the intervalcl
pkandcl
pkfi t into the classK
(see Fig. 2).2.1 TOPSIS-Sort
Procedure
The TOPSIS-sort technique for sorting of multiple criteria alternatives includes the following steps:
1. Establish the decision matrix
X = (x
ij)
n×m.2. Determine a set of profi les
P = {(p
1, p
1),
…, (p
k, p
k)}
, wherep
k is the upper limit of the class K andp
k is the lower limit of the class K.3. Add the profi les to the decision matrix
ξ
= {X,P}
.4. Normalize the decision matrix ξ using the equation below.
, (7)
where
J
andJ’
denote the sets of benefi t criteria and cost criteria, respectively.5. Execute Steps 1 to 5 of the TOPSIS method.
6. Calculate the values of
cl
i for the decision matrix ξ.7. Determine the values of
cl
jp kand
cl
jp kfor the profi les of each
p
k, p
k wherecl
jp k
refers to the deviation of the upper limit profi le of the class K from the ideal solution, and
cl
jpk is the deviation of the lower limit profi le of the class
K from the ideal solution.
8. Compare the values
cl
ip kwith the values
cl
jp kin the profi les using the equation below.
(8)
9. The alternatives whose
cl
j values are greater thancl
jpk
and less than
cl
jp kare assigned to the class
K
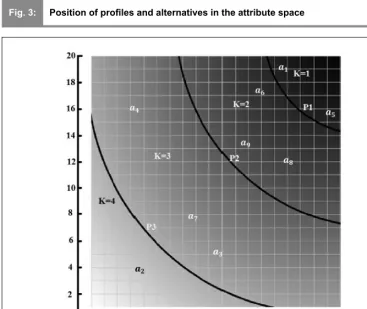
. At this stage the alternatives are sorted and assigned to the classes that are already defi ned.For example, Fig. 3 shows the positive and negative ideal solutions as well as the position of a few assumed alternatives. The curved lines denote a position of the profi les. P1 is the upper limit of Class 1, and all the values that lie within the interval higher than P1 fi t into Class 1. P2 is the lower limit and P1 is the upper limit of Class 2, and all the values that lie within this interval belong to Class 2. Alternatives 5 and 1 belong to Class 1, Alternatives 6, 8 and 9 belong to Class 2, Alternatives 4, 7 and 3 belong to Class 3, and Alternative 2 fi ts into Class 4.
3. An Empirical Case of Tehran
3.1 Classi
fi
cation of Environmental
Quality Management
Tehran is the capital city of Iran; it is located in the northern part of the country. Tehran is located on the southern slopes of the Alborz Mountains. With an estimated population of
Fig. 2: Distance of alternatives from the positive ideal and negative ideal solutions
and position of profi les
Source: own
EM_2_2016.indd 91
92 2016, XIX, 2
8.4 million, it is also Iran’s largest urban area and city, the largest city in Western Asia, one of the largest in Southern Asia, and the 19th largest city globally. The daily infl ow of people, commuting in and out of Tehran, increases the daytime population of the city up to more than 15 million.
Tehran is divided into 22 districts that show remarkable disparities from social, economic, cultural and political points of view. Tehran performs many of national and international functions as a capital city. The ministries, government institutions and other institutions, private companies and branch offi ces of foreign companies are located in the city. Tehran is the most important transportation hub in Iran in air, rail and road transportation. Almost half of the country’s industrial activity is concentrated in Tehran, and it is a signifi cant economic driver across the whole country. However, this has
signifi cant negative impacts on the environment. The Tehran Metropolis shelters about a quarter of the urban population of Iran, which in itself has led to expansion and escalation of pressures on the environment (Research & Planning Center of Tehran, 2012). Tehran’s air pollution is made even worse by the city’s geographic position. The city is semi-enclosed in three directions by high altitude mountains, blocking air movements. Therefore, Tehran is facing with numerous environmental problems and issues, such as air pollution mitigation and management, waste management, water and wastewater management, urban safety and greening.
An analysis and assessment of the environmental conditions in Tehran helps to identify the districts with the poor environmental quality. Priority should be given to these areas to maintain and improve the quality
Fig. 3: Position of profi les and alternatives in the attribute space
Source: own
EM_2_2016.indd 92
93 2, XIX, 2016
of environment. Tehran’s districts can be classifi ed into fi ve classes according to their environmental conditions: high suitable, suitable, moderately suitable, low suitable and very low suitable. The annual report of Tehran municipality was used to defi ne the criteria in order to assess the quality of environment. Five criteria were chosen for evaluation of the urban districts of Tehran. The thresholds of each class were identifi ed using data from the detailed plan of Tehran, Tehran comprehensive plan of greenery, Tehran comprehensive plan of environment and Tehran comprehensive plan of water and wastewater and the specialists’ opinion.
Air Pollution
Air pollution is one of the most challenging problems in Tehran. In December 2015, Teheran authorities have decided to close all schools and kindergartens in the capital for two days because of dangerous environmental situation caused by high air pollution. Iran has twice closed schools and government offi ces because of air pollution, most recently in 2010. According to the offi ce in charge of monitoring air quality, the air in Tehran was pure for only 219 days during the past 16 years (24.com, 2015). Based on AQI (Air Quality Index), during a 10-year period (1983–1993) Tehran experienced 1 dangerous day, 7 very unhealthy days, 67 unhealthy days, 926 unhealthy days for vulnerable people, and 2,481 healthy days out of 3,654 days (http://air.tehran.ir). Air pollution was unequally distributed within the city: the pollution was higher in the central areas where the activities were concentrated than in the surroundings.
The national government and local authorities endeavour to develop an effi cient air quality management system in Tehran. In order to improve, control and manage the air pollution in Tehran, eleven monitoring stations provide real-time information on air quality and identify the polluted districts. These results can be used by public and involved organizations responsible for the control of air quality.
Urban Green Space
Development of urban green space and landscapes are one of the effective ways for improving air quality, aesthetics and environment. Urban green spaces are known as the lungs of a city (Singh, 2015). Urban
greenery has a natural ability to fi lter pollution from the air and provide cooling effects during extreme heat (Tiwary et al., 2009; Zupancic et al., 2015). Urban green space improves the environmental quality of life, promotes public health and provides valuable ecosystem services, urban tourism, active and passive recreations to urban dwellers (de Vries, 2003; ECOTEC, 2008; Abraham et al. 2010). Green assets provide benefi ts both for people, by enhancing public use opportunities, and for the environment by improving urban ecosystem health.
Although the World Health Organization (2010) suggests a minimum of 9 sq. m of green space per capita, this amount is only suitable if the greenery is accessible, good quality and well-maintained. It should be noted that currently accepted standard in Iran for urban green space in cities is 7–12 sq. m. per capita (Ebrahimzadeh et al., 2013). However, access to green spaces is unequally distributed across different areas of Tehran. These problems are caused by the shortage of water and space for urban greenery development, poor soil quality, etc. Unfortunately, over the past years, the urban sprawl and endless construction projects have denuded the city of its green spaces. At present, the green space per capita in Tehran is about 9.2 sq. m, though this amount differs among the districts. This fi gure indicates that one of environmental challenges in Tehran is shortage of green space. Due to this, air pollution and other environmental problems are becoming crucial in the city. Thus, this criterion is of great importance for evaluation of the quality of urban environment.
Waste
According to the Tehran Waste Management Organization, every resident of Tehran produces 320 kilograms of solid waste per year. In other words, annually every resident produces an average 6 times more waste than his/her weight. While the average per capita production of solid waste in the world is 250–300 grams per day, Iran daily produces an average 600 grams per person. In northern Tehran, this amount reaches 1,200 grams. In central Tehran, especially District 20, where the commercial facilities are concentrated, the waste production rate reaches its peak. Statistics show that business districts of Tehran produce more waste, and the waste produced
EM_2_2016.indd 93
94 2016, XIX, 2
in the northern Tehran is at least 2 times more than the country average and 4 times more than the world average.
Water and Wastewater
Urban water is used to meet commercial, industrial, institutional and residential needs of the city. Water is involved in domestic and productive/irrigation activities. Citizens should be provided with suffi cient and safe water to meet their basic needs, i.e., for drinking, cooking, and personal and domestic hygiene. Tehran is located in a semi-arid region with little rainfall and frequent droughts. The mean annual precipitation is only 250 millimeters, most of which falls during winter and spring. Tehran is facing with a water shortage of more than 100 million cubic meters (MCM) per year in drought years. The most important freshwater resources in Tehran are the Karaj, Lar, Latian, Mamloo and Taleghan reservoirs. Tehran supplements surface water with groundwater to mitigate the water shortage, and at least 250 MCM of water is discharged from wells annually in Tehran (Tajrishy et al., 2014).
According to the Tehran Water and Wastewater Company, over 703 MCM of water is supplied to Tehran, and on average 85 MCM per month is extracted and supplied to the city, out of which 71.7 come from surface water and the rest from the groundwater. The total water consumption of the Tehran province was about 980 MCM in 2008. During summer months water consumption and demand for domestic water increases as the summer heat rises in densely populated Tehran.
Expansion of urban population and increased household water consumption and sewerage give rise to greater quantities of municipal wastewater. With emphasis on environmental health issues, there is an increasing awareness of the need to dispose the wastewater safely and benefi cially.
Ratio of Incident to Station
According to the Fire Organization, 12,620
fi res incidents have occurred in residential, commercial, administrative and industrial properties in Tehran during 2007. The highest number of fi res was in District 2, while District 13 experienced the least number of incidents. Population density, old electrical wires and connections, storage of fl ammable materials in residential places, using substandard electric
and gas appliances, and ignoring safety regulations, these are some of the causes of
fi re in residential property in Tehran.
3.2 Application of TOPSIS-Sort
Five criteria are used to classify Tehran’s districts on the quality of urban environment: urban green space per capita (
g
1), waste and soil pollution management (g
2), quality of environmental management of water and wastewater projects (g
3), air pollution management (g
4), ratio of incidents to station (g
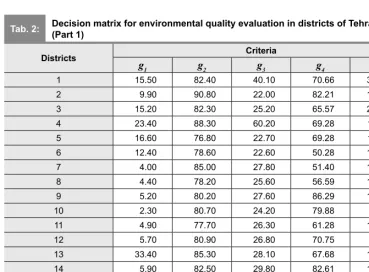
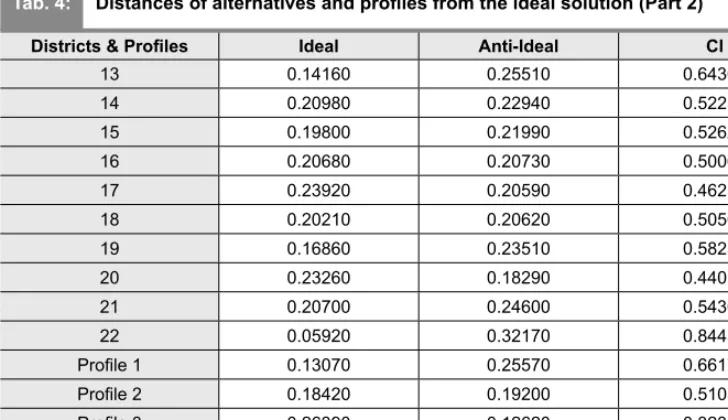
5). These criteria are taken into account in order to identify fi ve classes of districts, also to determine the costs and benefi ts of each alternative and the weight of the criteria. Therefore, Class 1 is considered as the best and then Classes 2 to 5 are ranked respectively. Taking into account the specialists’ opinion and data from the comprehensive plans of Tehran, the upper limit profi le and the upper limit profi le for each class was defi ned. The standards compatible with Tehran have been deployed in defi ning the profi les, so the profi les are independent from the alternatives and their scores. The profi les are shown in Tab. 2. The weight of all criteria is assumed the same (0.2). The scores of 22 districts of Tehran according to the criteria were collected and entered into the decision matrix (Tab. 2). Then, the matrix and the profi le were combined together (Tab. 3). Fig. 4 provides a graphical representation of the position of three districts (1, 6 and 21) according to the defi ned profi les. At the next step, the decision matrix and the profi le were normalized by Eq. (7). The weight normalized matrix is obtained by multiplying the normalized decision matrix with the weights vector. At the next step, the values of the positive and negative ideal solutions were determined for each criterion (Tab. 3).In the next step, the distance from the positive and negative ideal solutions is calculated using Eqs. (4) and (5) (Tab. 4). According to Eq. (6), the deviation of the alternatives
cl
j from the ideal solution is determined and the deviation of profi le from the ideal solution (cl
jpk andcl
jpk) is also calculated. Final step, the deviation of profi le from the ideal solution is calculated and then the alternatives are assigned to the classes through comparison betweencl
j of each alternative andcl
j of profi les. For example,cl
j of District 1 is 0.54753 which is less than Profi le 1, so it does not fi t into Class 1. This value is greater than Profi le 2 (0.51037),EM_2_2016.indd 94
95 2, XIX, 2016
so it belongs to Class 2. The
cl
j of Alternative 3 is 49,401 which is less than the lower limit of Class 1, so it does not fi t into Class 1. Now it is the turn of Class 2. This value is compared to the lower limit of Class 2. Alternative 3 does not fi t into Class 2, because it is less than the lower limit of Class 2. Alternative 3 belongs to Class 3, since it is greater than the lower limit of Class 3 but less than its upper limit. In this waycl
j of all alternatives are compared to thevalues of
cl
jp kand
cl
jp kin order to determine their related classes. It should be noted, that none of the alternatives fi ts into Classes 4 and 5 (see Fig. 5). Thus, all the alternatives are classifi ed; Class 1 turns out to be the best and Class 5 would be the worst. Sorting results of 22 districts of Tehran according to the set of criteria are shown in Tab. 5.
Criteria
g
1g
2g
3g
4g
5Cost/Benefi t benefi t benefi t benefi t benefi t cost
Weight 0.2 0.2 0.2 0.2 0.2
p
1 25 80 40 80 150p
2 20 75 30 60 300p
3 10 70 20 30 400p
4 0 65 10 20 700Source: own
Districts Criteria
g
1g
2g
3g
4g
51 15.50 82.40 40.10 70.66 313.69
2 9.90 90.80 22.00 82.21 130.61
3 15.20 82.30 25.20 65.57 269.37
4 23.40 88.30 60.20 69.28 119.03
5 16.60 76.80 22.70 69.28 116.82
6 12.40 78.60 22.60 50.28 199.55
7 4.00 85.00 27.80 51.40 188.94
8 4.40 78.20 25.60 56.59 126.37
9 5.20 80.20 27.60 86.29 108.82
10 2.30 80.70 24.20 79.88 97.95
11 4.90 77.70 26.30 61.28 122.58
12 5.70 80.90 26.80 70.75 82.75
13 33.40 85.30 28.10 67.68 126.14
14 5.90 82.50 29.80 82.61 149.32
15 14.00 88.50 24.60 90.71 335.24
16 11.40 81.80 26.50 61.04 139.62
17 3.50 78.90 22.40 60.82 99.42
Tab. 1: Specimanagementfi cations of the classifi cation for the quality of Tehran environmental
Tab. 2: Decision matrix for environmental quality evaluation in districts of Tehran
(Part 1)
EM_2_2016.indd 95
96 2016, XIX, 2
Districts Criteria
g
1g
2g
3g
4g
518 12.96 78.40 25.20 67.25 180.18
19 28.00 82.40 25.30 56.89 102.78
20 15.70 82.10 27.70 24.64 193.52
21 25.00 91.30 67.10 79.81 916.67
22 48.00 85.10 49.20 86.71 173.79
p
1 25 80 40 80 150p
2 20 75 30 60 300p
3 10 70 20 30 400p
4 0 65 10 20 700Source: own
Tab. 2: Decision matrix for environmental quality evaluation in districts of Tehran (Part 2)
Fig. 4: Profi les and classes of environmental quality evaluation and the position
of Tehran Districts 1, 6 and 21
Source: own
Districts & Profi les Criteria
g
1g
2g
3g
4g
51 0.0646 0.1805 0.1195 0.1558 0.0684
2 0.0413 0.1989 0.0656 0.1813 0.0285
3 0.0633 0.1803 0.0751 0.1446 0.0588
4 0.0975 0.1934 0.1794 0.1528 0.0260
5 0.0692 0.1682 0.0677 0.1528 0.0255
6 0.0517 0.1722 0.0674 0.1109 0.0435
Tab. 3: Profi les and normalized weight matrix (Part 1)
EM_2_2016.indd 96
97 2, XIX, 2016
Districts & Profi les Criteria
g
1g
2g
3g
4g
57 0.0167 0.1862 0.0829 0.1133 0.0412
8 0.0183 0.1713 0.0763 0.1248 0.0276
9 0.0217 0.1757 0.0823 0.1903 0.0237
10 0.0096 0.1768 0.0721 0.1761 0.0214
11 0.0204 0.1702 0.0784 0.1351 0.0267
12 0.0238 0.1772 0.0799 0.1560 0.0181
13 0.1392 0.1869 0.0838 0.1492 0.0275
14 0.0246 0.1807 0.0888 0.1821 0.0326
15 0.0583 0.1939 0.0733 0.2000 0.0731
16 0.0475 0.1792 0.0790 0.1346 0.0305
17 0.0146 0.1728 0.0668 0.1341 0.0217
18 0.0540 0.1717 0.0751 0.1483 0.0393
19 0.1167 0.1805 0.0754 0.1254 0.0224
20 0.0654 0.1798 0.0826 0.0543 0.0422
21 0.1042 0.2000 0.2000 0.1760 0.2000
22 0.2000 0.1864 0.1466 0.1912 0.0379
Profi le 1 0.1042 0.1752 0.1192 0.1764 0.0327
Profi le 2 0.0833 0.1643 0.0894 0.1323 0.0655
Profi le 3 0.0417 0.1533 0.0596 0.0661 0.0873
Profi le 4 0.0000 0.1424 0.0298 0.0441 0.1527
Ideal 0.2000 0.2000 0.2000 0.2000 0.0181
Anti-Ideal 0.0000 0.1424 0.0298 0.0441 0.2000
Source: own
Tab. 3: Profi les and normalized weight matrix (Part 2)
Districts & Profi les Ideal Anti-Ideal Cl
1 0.17230 0.20850 0.54753
2 0.20910 0.23320 0.52724
3 0.19850 0.19380 0.49401
4 0.11520 0.27680 0.70612
5 0.19480 0.22170 0.53229
6 0.22130 0.18410 0.45412
7 0.23570 0.18710 0.44253
8 0.23430 0.19890 0.45914
9 0.21540 0.23820 0.52513
10 0.23180 0.22890 0.49685
11 0.22850 0.20460 0.47241
12 0.21900 0.22340 0.50497
Tab. 4: Distances of alternatives and profi les from the ideal solution (Part 1)
EM_2_2016.indd 97
98 2016, XIX, 2
Districts & Profi les Ideal Anti-Ideal Cl
13 0.14160 0.25510 0.64306
14 0.20980 0.22940 0.52231
15 0.19800 0.21990 0.52620
16 0.20680 0.20730 0.50060
17 0.23920 0.20590 0.46259
18 0.20210 0.20620 0.50502
19 0.16860 0.23510 0.58236
20 0.23260 0.18290 0.44019
21 0.20700 0.24600 0.54305
22 0.05920 0.32170 0.84458
Profi le 1 0.13070 0.25570 0.66175
Profi le 2 0.18420 0.19200 0.51037
Profi le 3 0.26390 0.12620 0.32351
Profi le 4 0.33870 0.04730 0.12254
Source: own
District 1 2 3 4 5 6 7 8 9 10 11 12 13 14 15 16 17 18 19 20 21 22
Class 2 2 3 1 2 3 3 3 2 3 3 3 2 2 2 3 3 3 2 3 2 1
Source: own
Tab. 4: Distances of alternatives and profi les from the ideal solution (Part 2)
Tab. 5: Sorting of the districts of Tehran by the method TOPSIS-Sort
Fig. 5: Classifi cation of Tehran districts by the method TOPSIS-Sort
Source: own
EM_2_2016.indd 98
99 2, XIX, 2016
Conclusions
For solution of a MCDM problem, there exist different methods for outranking alternatives, in which the alternatives are compared pairwise or each alternative is compared to the ideal solution. The best and worst values of attributes as reference points are internally defi ned, and the alternative with the best performance on all attributes is regarded as ideal to which other alternatives are compared. The alternatives can also be compared pairwise against each of the criteria for preference, and a complete ranking of alternatives from the best to the worst one is provided. If reference points are externally defi ned for comparison, we achieve a set of methods that sort the alternatives into pre-defi ned categories.
The TOPSIS-Sort method, proposed in this paper, pertains to the extension of the classic TOPSIS method in order to sort the alternatives. In the proposed method, the profi le and reference points determine a range from the best to the worst values independently from the data. Application of the proposed approach was demonstrated by classifying 22 districts of Tehran into fi ve classes (but none of the districts
fi ts into Classes 4 and 5), representing areas with different levels of environmental quality. The results obtained by the TOPSIS-Sort give credence to its success, because the results of sorting confi rm our and specialists’ evaluation of the districts. This research provides appropriate results with respect to the development of sorting models in the form of outranking relations. The model, proposed by this study, is applicable to the other outranking methods such as ELECTRE, PROMETHEE, etc.
References
24.com. (2015). Iran closes capital’s schools due to air pollution. News24. Retrieved December 22, 2015, from http://www.news24. com/Green/News/iran-closes-capitals-schools-due-to-air-pollution-20151219.
Abraham, A., Sommerhalder, K., & Abel, T. (2010). Landscape and well-being: a scoping study on the health-promoting impact of outdoor environments. International Journal of Public Health, 55(1), 56-59. doi:10.1007/s00038-009-0069-z.
Aghajani Mir, M., Taherei Ghazvinei, P., Sulaiman, N.M.N., Basri, N.E.A., Saheri, S., Mahmood, N.Z., Jahan, A., Begum, R.A., & Aghamohammadi, N. (2016). Application of
TOPSIS and VIKOR improved versions in a multi criteria decision analysis to develop an optimized municipal solid waste management model.
Journal of Environmental Management, 166(15), 109-115. doi:10.1016/j.jenvman.2015.09.028.
Ahmadi, Z., Dehaghi, M.R., Meybodi, M.E., Goodarzi, M., & Aghajani, M. (2014). Pollution levels in Iranian economy sectors using input-output analysis and TOPSIS technique: An approach to sustainable development. Procedia - Social and Behavioral Sciences, 141(25), 1363-1368. doi:10.1016/j.sbspro.2014.05.235.
Araz, C., & Ozkarahan, I. (2005). A multicriteria sorting procedure for
fi nancial classification problems: The case of business failure risk assessment. In M. Gallagher, J. Hogan, & F. Maire (Eds.),
Intelligent Data Engineering And Automated Learning – IDEAL 2005, LNCS, 3578 (pp. 563-570). Berlin, Heidelberg: Springer. doi:10.1007/11508069_73.
Ashtiani, B., Haghighirad, F., Makui, A., & Montazer, G.A. (2009). Extension of fuzzy TOPSIS method based on interval-valued fuzzy sets. Applied Soft Computing, 9(2), 457-461. doi:10.1016/j.asoc.2008.05.005.
Awasthi, A., & Chauhan, S.S. (2012). A hybrid approach integrating Affi nity Diagram, AHP and fuzzy TOPSIS for sustainable city logistics planning. Applied Mathematical Modelling, 36(2), 573-584. doi:10.1016/j. apm.2011.07.033.
Awasthi, A., Chauhan, S.S., & Omrani, H. (2011). Application of fuzzy TOPSIS in evaluating sustainable transportation systems.
Expert Systems with Applications, 38(10), 12270-12280. doi:10.1016/j.eswa.2011.04.005.
Bao, Q., Ruan, D., Shen, Y., Hermans, E., & Janssens, D. (2012). Improved hierarchical fuzzy TOPSIS for road safety performance evaluation. Knowledge-Based Systems, 32, 84-90. doi:10.1016/j.knosys.2011.08.014.
Behzadian, M., Otaghsara, S.K., Yazdani, M., & Ignatius, J. (2012). A state-of the-art survey of TOPSIS applications. Expert Systems with Applications, 39(17), 13051-13069. doi:10.1016/j.eswa.2012.05.056.
Belton, S., & Stewart, T.S. (2002). Multiple criteria decision analysis: An integrated approach. Boston, MA: Kluwer Academic Publishers. doi:10.1007/978-1-4615-1495-4.
Bilbao-Terol, A., Arenas-Parra, M., Cañal-Fernández, V., & Antomil-Ibias, J. (2014). Using TOPSIS for assessing the sustainability
EM_2_2016.indd 99
100 2016, XIX, 2
of government bond funds. Omega, 49, 1-17. doi:10.1016/j.omega.2014.04.005.
Bouyssou, D., & Marchant, T. (2007a). An axiomatic approach to noncompensatory sorting methods in MCDM, I: The case of two categories. European Journal of Operational Research, 178(1), 217-245. doi:10.1016/j. ejor.2006.01.027.
Bouyssou, D., & Marchant, T. (2007b). An axiomatic approach to noncompensatory sorting methods in MCDM, II: More than two categories. European Journal of Operational Research, 178(1), 246-276. doi:10.1016/j. ejor.2006.01.033.
Bouyssou, D., & Marchant, T. (2015). On the relations between ELECTRE TRI-B and ELECTRE TRI-C and on a new variant of ELECTRE TRI-B. European Journal of Operational Research, 242(1), 201-211. doi:10.1016/j.ejor.2014.09.057.
Brans, J.-P., & Vincke, P. (1985). Note - A preference ranking organisation method.
Management Science, 31(6), 647-656. doi:10.1287/mnsc.31.6.647.
Brito, A.J., de Almeida, A.T., & Mota, C.M.M. (2010). A multicriteria model for risk sorting of natural gas pipelines based on ELECTRE TRI integrating Utility Theory. European Journal of Operational Research, 200(3), 812-821. doi:10.1016/j.ejor.2009.01.016.
Carlsson, C., & Fuller, R. (1996). Fuzzy multiple criteria decision making: Recent developments. Fuzzy Sets and Systems, 78, 139-153. doi:10.1016/0165-0114(95)00165-4.
Chen, M.-F., & Tzeng, G.-H. (2004). Combining grey relation and TOPSIS concepts for selecting an expatriate host country.
Mathematical and Computer Modelling, 40(13), 1473-1490. doi:10.1016/j.mcm.2005.01.006.
Chen, T.-Y. (2015). The inclusion-based TOPSIS method with interval-valued intuitionistic fuzzy sets for multiple criteria group decision making. Applied Soft Computing, 26, 57-73. doi:10.1016/j.asoc.2014.09.015.
Chen, T.-Y., & Tsao, C.-Y. (2008). The interval-valued fuzzy TOPSIS method and experimental analysis. Fuzzy Sets and Systems, 159(11), 1410-1428. doi:10.1016/j. fss.2007.11.004.
Chen, Y., Li, K.W., & Liu, S.-f. (2011). An OWA-TOPSIS method for multiple criteria decision analysis. Expert Systems with Applications, 38(5), 5205-5211. doi:10.1016/j. eswa.2010.10.039.
de Vries, S., Verheij, R.A., Groenewegen, P.P., & Spreeuwenberg, P. (2003). Natural environments-healthy environments? An exploratory analysis of the relationship between greenspace and health. Environment and Planning A, 35(10), 1717-1732. doi:10.1068/a35111.
Doumpos, M., & Zopounidis, C. (2002).
Multicriteria decision aid classifi cation methods, Applied Optimization, 73. New York, NY: Springer. doi:10.1007/b101986.
Dymova, L., Sevastjanov, P., & Tikhonenko, A. (2013). A direct interval extension of TOPSIS method. Expert Systems with Applications, 40(12), 4841-4847. doi:10.1016/j. eswa.2013.02.022.
Ebrahimzadeh, I., Maleki, S., & Hatami, D. (2013). Analysis of urban green space distribution and better organization of space and place it: case study of the region two of Izeh city, Iran. Indian Journal of Scientifi c Research, 4(2), 23-26.
ECOTEC (2008). The economic benefi ts of Green Infrastructure: the public and business case for investing in Green Infrastructure and a review of the underpinning evidence, Report for Natural Economy Northwest (NENW). ECOTEC Research and Consulting. Retrieved November 10, 2015, from http://www.forestry.gov.uk/ pdf/nweeconomicbenefitsofgiinvestigating. p d f / $ F I L E / n w e e c o n o m i c b e n e f i t s o f g i investigating.pdf.
Fernandez, E., Navarro, J., & Bernal, S. (2010). Handling multicriteria preferences in cluster analysis. European Journal of Operational Research, 202(3), 819-827. doi:10.1016/j.ejor.2009.05.034.
Figueira, J., Greco, S., & Ehrgott, M. (Eds.). (2005). Multiple criteria decision analysis: State of the art surveys. New York, NY: Springer. doi:10.1007/b100605.
Giove, S. (2002). Interval TOPSIS for multicriteria decision making. In M. Marinaro, R. Tagliaferri (Eds.), Neural Nets, LNCS, 2486
(pp. 56-63). Berlin, Heidelberg: Springer. doi:10.1007/3-540-45808-5_5.
Greco, S., Ehrgott, M., & Figueira, J.R. (Eds.). (2010). Trends in multiple criteria decision analysis. New York, NY: Springer. doi:10.1007/978-1-4419-5904-1.
Hwang, C.L., & Yoon, K.L. (1981). Multiple attribute decision making: Methods and applications. A State-of-the-art survey, LNEMS, 186. Berlin: Springer-Verlag. doi:10.1007/978-3-642-48318-9.
EM_2_2016.indd 100
101 2, XIX, 2016
Ishizaka, A., & Nemery, P. (2014). Assigning machines to incomparable maintenance strategies with ELECTRE-SORT. Omega, 47, 45-59. doi:10.1016/j.omega.2014.03.006.
Jahanshahloo, G.R., Hosseinzadeh Lotfi , F., & Izadikhah, M. (2006). An algorithmic method to extend TOPSIS for decision-making problems with interval data. Applied Mathematics and Computation, 175(2), 1375-1384. doi:10.1016/j.amc.2005.08.048.
Janssen, P., & Nemery, P. (2013). An extension of the FlowSort sorting method to deal with imprecision. 4OR, 11(2), 171-193. doi:10.1007/s10288-012-0219-7.
Jia, J., Fan, Y., & Guo, X. (2012). The low carbon development (LCD) levels’ evaluation of the world’s 47 countries (areas) by combining the FAHP with the TOPSIS method. Expert Systems with Applications, 39(7), 6628-6640. doi:10.1016/j.eswa.2011.12.039.
Jiang, J., Chen, Y.-W., Chen, Y.-W., & Yang, K.-W. (2011). TOPSIS with fuzzy belief structure for group belief multiple criteria decision making.
Expert Systems with Applications, 38(8), 9400-9406. doi:10.1016/j.eswa.2011.01.128.
Jiang, J., Chen, Y.-W., Tang, D.-W., Chen, Y.-W. (2010). TOPSIS with belief structure for group belief multiple criteria decision making.
International Journal of Automation and Computing, 7(3), 359-364. doi:10.1007/s11633-010-0515-7.
Jiang, Y.-X., Liu, Y.-S., Ying, G.-G., Wang, H.-W., Liang, Y.-Q., & Chen, X.-W. (2015). A new tool for assessing sediment quality based on the Weight of Evidence approach and grey TOPSIS.
Science of the Total Environment, 537(15), 369-376. doi:10.1016/j.scitotenv.2015.08.004.
Książek, M.V., Nowak, P.O., Kivrak, S., Rosłon, J.H., & Ustinovichius, L. (2015). Computer-aided decision-making in construction project development. Journal of Civil Engineering and Management, 21(2), 248-259. doi:10.3846/13923730.2014.996250.
Kusi-Sarpong, S., Bai, C., Sarkis, J., Wang, X. (2015). Green supply chain practices evaluation in the mining industry using a joint rough sets and fuzzy TOPSIS methodology.
Resources Policy, 46(1), 86-100. doi:10.1016/j. resourpol.2014.10.011.
Lazauskaite, D., Burinskiene, M., & Podvezko, V. (2015). Subjectively and objectively integrated assessment of the quality indices of the suburban residential environment. International Journal of Strategic
Property Management, 19(3), 297-308. doi:10.3846/1648715X.2015.1051164.
Lee, G., Jun, K.S., & Chung, E.-S. (2014). Robust spatial fl ood vulnerability assessment for Han River using fuzzy TOPSIS with α-cut level set. Expert Systems with Applications, 41(2), 644-654. doi:10.1016/j.eswa.2013.07.089.
Liou, J.J.H., & Tzeng, G.-H. (2012). Comments on “Multiple criteria decision making (MCDM) methods in economics: an overview”.
Technological and Economic Development of Economy,18(4), 672-695. doi:10.3846/202949 13.2012.753489.
Lourenço, R.P., & Costa, J.P. (2004). Using ELECTRE TRI outranking method to sort MOMILP nondominated solutions. European Journal of Operational Research, 153(2), 271-289. doi:10.1016/S0377-2217(03)00150-4.
Mardani, A., Jusoh, A., MD Nor, K., Khalifah, Z., Zakwan, N., & Valipour, A. (2015). Multiple criteria decision-making techniques and their applications - a review of the literature from 2000 to 2014. Economic Research-Ekonomska Istraživanja, 28(1), 516-571. doi:10.1080/1331 677X.2015.1075139.
Massaglia, R., & Ostanello, A. (1991). N-TOMIC: a support system for multicriteria segmentation problems. In P. Korhonen, A. Lewandowski, J. Walenius (Eds.), Multiple Criteria Decision Support, LNEMS, 356 (pp. 167-174). Berlin: Springer.
Mokhtarian, M.N. (2015). A note on “Extension of fuzzy TOPSIS method based on interval-valued fuzzy sets”. Applied Soft Computing, 26, 513-514. doi:10.1016/j. asoc.2014.10.013.
Montibeller, G., & Franco, L.A. (2011). Raising the bar: strategic multi-criteria decision analysis. Journal of the Operational Research Society, 62(5), 855-867. doi:10.1057/ jors.2009.178.
Mousseau, V., & Slowinski, R. (1998). Inferring an ELECTRE TRI model from assignment examples. Journal of Global Optimization, 12(2), 157-174. doi:10.1023/A:1008210427517.
Mousseau, V., Figueira, J., & Naux, J.-Ph. (2001). Using assignment examples to infer weights for ELECTRE TRI method: Some experimental results. European Journal of Operational Research, 130(2), 263-275. doi:10.1016/S0377-2217(00)00041-2.
Mousseau, V., Slowinski, R., & Zielniewicz, P. (2000). A user-oriented implementation of the
EM_2_2016.indd 101
102 2016, XIX, 2
ELECTRE-TRI method integrating preference elicitation support. Computers & Operations Research, 27(7-8), 757-777. doi:10.1016/ S0305-0548(99)00117-3.
Mulliner, E., Malys, N., & Maliene, V. (2016). Comparative analysis of MCDM methods for the assessment of sustainable housing affordability. Omega, 59(B), 146-156. doi:10.1016/j.omega.2015.05.013.
Nemery, P., & Lamboray, C. (2008). FlowSort: a fl ow-based sorting method with limiting or central profi les. TOP, 16(1), 90-113. doi:10.1007/s11750-007-0036-x.
Norese, M.F., & Viale, S. (2002). A multi-profile sorting procedure in the public administration. European Journal of Operational Research, 138(2): 365-379. doi:10.1016/ S0377-2217(01)00252-1.
Oztaysi, B. (2014). A decision model for information technology selection using AHP integrated TOPSIS-Grey: The case of content management systems. Knowledge-Based Systems, 70, 44-54. doi:10.1016/j. knosys.2014.02.010.
Perny, P. (1998). Multicriteria fi ltering methods based on concordance and non-discordance principles. Annals of Operations Research,
80(0), 137-165. doi:10.1023/A:1018907729570. Pourahmad, A., Hosseini, A., Banaitis, A., Nasiri, H., Banaitienė, N., & Tzeng, G.H. (2015). Combination of fuzzy-AHP and DEMATEL-ANP with GIS in a new hybrid MCDM model used for the selection of the best space for leisure in a blighted urban site. Technological and Economic Development of Economy, 21(5), 773-796. doi:10.3846/20294913.2015.1056279.
Research & Planning Center of Tehran. (2012). The state of environment report of Tehran. The collection of Research & Planning Center of Tehran’s projects in the promotion of life quality. Retrieved November 7, 2015, from http://en.tehran.ir/Portals/0/Document/The%20 State%20of%20Environment%20(SoE)%20 Report%20of%20Tehran%20.pdf.
Roy, B., & Bouyssou, D. (1993). Aide multicritère à la décision: Méthodes et cas. Paris: Economica.
Sánchez-Lozano, J.M., Antunes, C.H., García-Cascales, M.S., & Dias, L.C. (2014). GIS-based photovoltaic solar farms site selection using ELECTRE-TRI: Evaluating the case for Torre Pacheco, Murcia, Southeast of Spain. Renewable Energy, 66, 478-494. doi:10.1016/j.renene.2013.12.038.
Şengül, Ü., Eren, M., Shiraz, S.E., Gezder, V., & Şengül, A.B. (2015). Fuzzy TOPSIS method for ranking renewable energy supply systems in Turkey. Renewable Energy, 75, 617-625. doi:10.1016/j.renene.2014.10.045.
Singh, R.B. (Ed.). (2015). Urban development challenges, risks and resilience in Asian mega cities, Advances in Geographical and Environmental Sciences. Tokyo: Springer Japan. doi:10.1007/978-4-431-55043-3.
Siozinyte, E., Antucheviciene, J., & Kutut, V. (2014). Upgrading the old vernacular building to contemporary norms: multiple criteria approach.
Journal of Civil Engineering and Management,
20(2), 291-298. doi:10.3846/13923730.2014.9 04814.
Tajrishy, M., Abdolghafoorian, A., & Abrishamchi, A. (2014). Water reuse and wastewater recycling: Solutions to Tehran’s growing water crisis. In R.Q. Grafton, P. Wyrwoll, C. White, & D. Allendes (Eds.), Global Water: Issues and Insights (pp. 223-230). Canberra: ANU Press, The Australian National University.
Tiwary, A., Sinnett, D., Peachey, C.J., Chalabi, Z., Vardoulakis, S., Fletcher, T., Leonardi, G., Grundy, C., Azapagic, A., & Hutchings, T.R. (2009). An integrated tool to assess the role of new planting in PM10 capture and the human health benefi ts: a case study in London. Environmental Pollution, 157, 2645-2653. doi:10.1016/j.envpol.2009.05.005.
Vahdani, B., Mousavi, S.M., & Tavakkoli-Moghaddam, R. (2011). Group decision making based on novel fuzzy modifi ed TOPSIS method.
Applied Mathematical Modelling, 35(9), 4257-4269. doi:10.1016/j.apm.2011.02.040.
Vincke, P. (1992). Multicriteria decision-aid.
Chichester: Wiley.
Wang, C.-S., Yang, H.-L., & Lin, S.-L. (2015). To make good decision: A group DSS for multiple criteria alternative rank and selection. Mathematical Problems in Engineering, 2015, Article ID 186970, 15 pages. doi:10.1155/2015/186970.
World Health Organization (2010). Urban planning, environment and health: from evidence to policy action. Retrieved December 10, 2015, from http://www.euro.who.int/__data/ assets/pdf_fi le/0004/114448/E93987.pdf?ua=1.
Wu, J. (2015). A SD-IITFOWA operator and TOPSIS based approach for MAGDM problems with intuitionistic trapezoidal fuzzy numbers.
Technological and Economic Development of Economy, 21(1), 28-47. doi:10.3846/20294913 .2014.946982.
EM_2_2016.indd 102
103 2, XIX, 2016
Xia, B., Zuo, J., Skitmore, M., Chen, Q., & Rarasati, A. (2015). Sustainable retirement village for older people: a case study in Brisbane, Australia. International Journal of Strategic Property Management, 19(2), 149-158. doi:10.3846/1648715X.2015.1029564.
Ye, F., & Li, Y. (2014). An extended TOPSIS model based on the possibility theory under fuzzy environment. Knowledge-Based Systems, 67(0), 263-269. doi:10.1016/j. knosys.2014.04.046.
Zardari, N.H., Ahmed, K., Shirazi, S.M., & Yusop, Z.B. (2015). Weighting methods and their effects on multi-criteria decision making model outcomes in water resources management, Springer briefs in water science and technology. Cham: Springer. doi:10.1007/978-3-319-12586-2.
Zavadskas, E.K., & Turskis, Z. (2011). Multiple criteria decision making (MCDM) methods in economics: An overview.
Technological and Economic Development of Economy, 17(2), 397-427. doi:10.3846/202949 13.2011.593291.
Zavadskas, E.K., Turskis, Z., & Kildiene, S. (2014). State of art surveys of overviews on MCDM/MADM methods. Technological and Economic Development of Economy, 20(1), 165-179. doi:10.3846/20294913.2014.892037.
Zhang, X., & Xu, Z. (2015). Soft computing based on maximizing consensus and fuzzy TOPSIS approach to interval-valued intuitionistic fuzzy group decision making.
Applied Soft Computing, 26(0), 42-56. doi:10.1016/j.asoc.2014.08.073.
Zheng, J., Metchebon Takougang, S.A., Mousseau, V., & Pirlot, M. (2014). Learning criteria weights of an optimistic Electre Tri sorting rule. Computers & Operations Research,
49, 28-40. doi:10.1016/j.cor.2014.03.012.
Zopounidis, C., & Doumpos, M. (2002). Multicriteria classifi cation and sorting methods: A literature review. European Journal of Operational Research, 138(2), 229-246. doi:10.1016/S0377-2217(01)00243-0.
Zupancic, T., Westmacott, C., & Bulthuis, M. (2015). The impact of green space on heat and air pollution in urban communities: A meta-narrative systematic review. Vancouver, BC: David Suzuki Foundation. Retrieved December 20, 2015, from http://www.davidsuzuki. org/publications/Impactof GreenSpaceon-HeatandAirPollutionin UrbanCommunities.pdf.
Assoc. Prof. Hassanali Faraji Sabokbar, Ph.D. University of Tehran Department of Human Geography [email protected]
Ali Hosseini, Ph.D. University of Tehran Department of Geography and Urban Planning [email protected]
Prof. Audrius Banaitis, Ph.D. Vilnius Gediminas Technical University Faculty of Civil Engineering Department of Construction Economics
and Property Management [email protected]
Assoc. Prof. Nerija Banaitiene, Ph.D. Vilnius Gediminas Technical University Faculty of Civil Engineering Department of Construction Economics
and Property Management [email protected]
EM_2_2016.indd 103
104 2016, XIX, 2
Abstract
A NOVEL SORTING METHOD TOPSIS-SORT: AN APPLICATION FOR TEHRAN
ENVIRONMENTAL QUALITY EVALUATION
Hassanali Faraji Sabokbar, Ali Hosseini, Audrius Banaitis, Nerija Banaitiene
Many real-life problems are multi-objective by nature that requires evaluation of more than one criterion, therefore MCDM has become an important issue. In recent years, many MCDM methods have been developed; the existing approaches have been improved and extended. Multi criteria decision analysis has been regarded as a suitable set of methods to perform sustainability evaluations. Among numerous MCDM methods developed to solve real-life decision problems, Technique for Order Preference by Similarity to Ideal Solution (TOPSIS) continues to work satisfactorily in diverse application areas. In this paper, a novel sorting method (TOPSIS-Sort) based on the classic TOPSIS method is presented. In the TOPSIS-Sort approach an outranking relation is used for sorting purposes. The proposed approach uses characteristic profi les for defi ning the classes and outranking relation as the preference model. Application of the proposed approach is demonstrated by classifying 22 districts of Tehran into fi ve classes (but none of the districts fi ts into Classes 4 and 5), representing areas with different levels of environmental quality. An analysis and assessment of the environmental conditions in Tehran helps to identify the districts with the poor environmental quality. Priority should be given to these areas to maintain and improve the quality of environment. The results obtained by the TOPSIS-Sort give credence to its success, because the results of sorting confi rm our and specialists’ evaluation of the districts. This research provides appropriate results with respect to the development of sorting models in the form of outranking relations. The model, proposed by this study, is applicable to the other outranking methods such as ELECTRE, PROMETHEE, etc.
Key Words: TOPSIS-Sort, multiple criteria decision making (MCDM), outranking, sorting.
JEL Classifi cation: C02, C44, C61, C88, O18, Q56.
DOI: 10.15240/tul/001/2016-2-006
EM_2_2016.indd 104