Proc. IAHS, 373, 7–12, 2016 proc-iahs.net/373/7/2016/ doi:10.5194/piahs-373-7-2016
© Author(s) 2016. CC Attribution 3.0 License.
Open Access
spatial
dimensions
of
w
ater
management
–
Redistr
ib
ution
of
benefits
and
risks
Impact of urbanization on rainfall-runoff processes: case
study in the Liangshui River Basin in Beijing, China
Zongxue Xu1,2and Gang Zhao1,2
1College of Water Sciences, Beijing Normal University, Beijing 100875, China
2Key Laboratory of Water and Sediment Sciences, Ministry of Education, Beijing 100875, China
Correspondence to: Zongxue Xu ([email protected])
Published: 12 May 2016
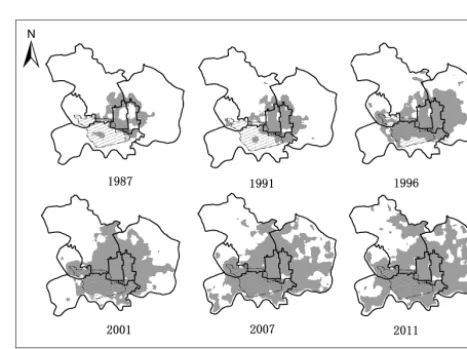
Abstract. China is undergoing rapid urbanization during the past decades. For example, the proportion of urban population in Beijing has increased from 57.6 % in 1980 to 86.3 % in 2013. Rapid urbanization has an adverse impact on the urban rainfall-runoff processes, which may result in the increase of urban flood risk. In the present study, the major purpose is to investigate the impact of land use/cover change on hydrological processes. The intensive human activities, such as the increase of impervious area, changes of river network morphology, con-struction of drainage system and water transfer, were considered in this study. Landsat TM images were adopted to monitor urbanization process based on Urban Land-use Index (ULI). The SWMM model considering different urbanized scenarios and anthropogenic disturbance was developed. The measured streamflow data was used for model calibration and validation. Precipitation with different return periods was taken as model input to anal-yse the changes of flood characteristics under different urbanized scenarios. The results indicated that SWMM provided a good estimation for storms under different urbanized scenarios. The volume of surface runoff after urbanization was 3.5 times greater than that before urbanization; the coefficient of runoff changed from 0.12 to 0.41, and the ratio of infiltration decreased from 88 to 60 %. After urbanization, the time of overland flow concentration increased while the time of river concentration decreased; the peak time did not show much differ-ence in this study. It was found that the peak flow of 20-year return-period after urbanization is greater than that of 100-year return-period before urbanization. The amplification effect of urbanization on flood is significant, resulting in an increase of the flooding risk. These effects are especially noticeable for extreme precipitation. The results in this study will provide technical support for the planning and management of urban storm water and the evaluation on Low Impact Development (LID) measures.
1 Introduction
Urbanization is an important index to reflect the development level of a country, but it also enhances the interaction be-tween human society and the environment. The unbalance of the water conservancy facilities transformation and the rapid urban development resulted in considerable urban wa-ter problems in China. From 2008 to 2010, different kinds of floods and inundation disasters occurred in 62 % of cities in China. For example, the heavy rainfall on 21 July 2012 in Beijing, resulted in 63 severe urban inundations and claimed the lives of 79 people.
un-certainty of anthropogenic disturbance, and the lack of high-quality datasets for calibration and validation may limit our research for the rainfall-runoff processes in an urban catch-ment. Thus, there is an urgent need to develop a hydrological model to identify the impact on urbanization with a support of long-term monitoring data in a typical urbanized catch-ment.
A variety of hydrological models have been developed and applied to simulate rainfall-runoff processes in urban area, including SWMM, MIKE, HSPF, STORM and IN-FOWORKS. For instance, Guan et al. (2015) used the SWMM model to simulate a series of scenarios in a devel-oping urban catchment. Koudelak and West (2008) and Peng et al. (2015) adopted the InfoWorks model to simulate sew-erage network flow in the city of Latvia and China, respec-tively. Guo et al. (2013) and Alam et al. (2014) used MIKE model to assess flood hazard combined sewer system in ur-ban areas.
In this study, SWMM model considering different urban-ized scenarios and anthropogenic disturbance was developed on the basis of remote sensing image and survey. The mea-sured streamflow data was used for model calibration and validation. Precipitation with different return periods was taken as model input to analyse the changes of rainfall-runoff process under different urbanized scenarios.
2 Study area description
Dahongmen catchment (Fig. 1) is located in the upstream of Liangshui River basin in Beijing, between 39◦480–39◦550N,
116◦90–116◦240E and with an area of 131 km2. The terrain in the catchment shows a downward trend from the western mountains to the eastern plains. The annual average precip-itation is 522.4 mm and 80 % of precipprecip-itation occurs during the period from June to September. Dahongmen catchment, which has experienced a rapid urbanization process over the past two decades, has gradually become a transport hub and core zone of Beijing metropolitan. Floods and inundation frequently occur in this area, which was further intensified after rapid urbanization. For the purpose to solve this prob-lem, a set of anthropogenic measures including water trans-fer, river and sewer system, and morphology changes were taken. However, these measures further changed the local rainfall runoff processes.
3 Model and data description
3.1 SWMM model
The EPA Storm Water Management Model (SWMM) is a dy-namic rainfall-runoff simulation model used for single event or long-term (continuous) simulation of runoff quantity and quality from primarily urban areas. It was first developed in 1971 and continued to be widely used throughout the world for planning, analysis and design related to storm water,
com-Figure 1.Location, river systems, and hydrometeorological sta-tions in the Dahongmen catchment.
Figure 2.Urbanization processes in the Dahongmen catchment.
bined sewers, and other hydraulic structures in urban areas. The main components of SWMM include surface runoff, in-filtration, surface concentration, channel and pipe concentra-tion and LID controls. Further technical details of the model are given by Rossman et al. (2015).
3.2 Data description
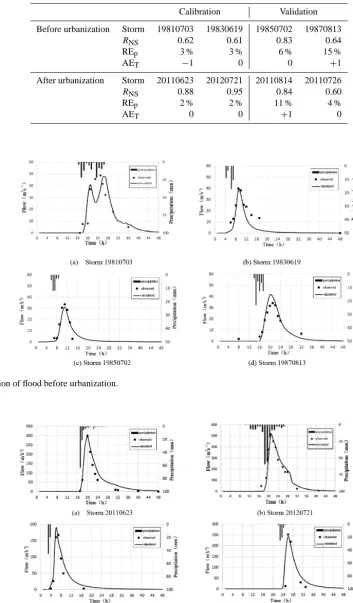
Ad-Table 1.Results of parameter identification.
Parameters in SWMM Before urbanization After urbanization
Manning coefficient Pervious zone 0.43 0.36
Impervious zone 0.07 0.04
Channels 0.025 0.048
Pipeline – 0.02
Horton coefficient Maximum infiltration 124.6 142.4
minimum infiltration 74.7 89.6
Decay coefficient 11.4 23.2
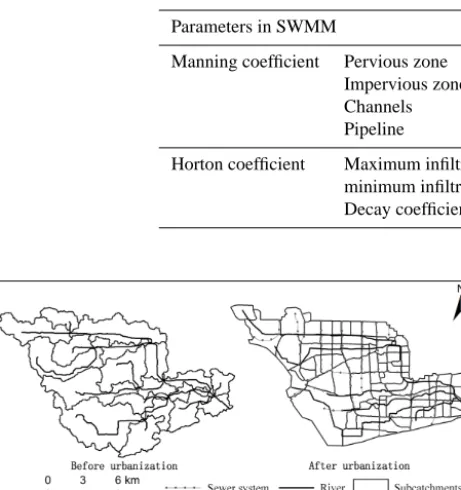
Figure 3.Model development in different urbanization cases.
ministration (NASA, ASTER GDEM) and Beijing Munici-pal Institute of City Planning and Design. Hourly precipita-tion series at 4 staprecipita-tions (Fig. 1) and streamflow data at DHM station from 1980 to 2012 were obtained from the Hydro-graphic Station of Beijing. Hourly inflow data of YAM sta-tion were obtained from the Liangshui River Basin Authority.
4 Model development
4.1 Catchment subdivision
Catchment subdivision should reflect the urbanization pro-cess and has great impacts on the rainfall runoff simulation. Before urbanization, DEM and D8 algorithm were used to extract the subcatchment (Fig. 3). But for highly developed urban area, catchment was divided by design drainage areas provided by the Beijing Municipal Institute of City Planning and Design.
4.2 Model accuracy evaluation
According to the standard for hydrological information and hydrological forecasting in China, Nash–Sutcliffe efficiency coefficient (RNS), relative error of flood peak discharge (REp) and absolute error of flood peak appearance (AET) were used for measuring the accuracy of model performance.
RNS=1− N P
i=1
qtobs−qtsim2
N P
i=1
qtobs−qobs2
, (1)
whereqtobsis observed discharge sequence,N is the number of observed discharge data andqobsis the average of the ob-served discharge.
REp= q
obs p −qpsim
qobs
p
×100 %, (2)
whereqpobsis the observed peak flow,qpsim is the simulated peak flow.
AET=Tpobs−Tpsim, (3)
whereTpobs is the observed occurrence time of flood peak, Tpsimis the simulated occurrence of flood peak.
5 Results analysis
5.1 Model calibration and validation
Most of the parameters in SWMM model have its specific physical meaning, which can be measured theoretically. Due to the limitation of data, these parameters are usually de-termined by empirical method or optimization method. In this study, the genetic algorithm (GA) was adopted to op-timize the sensitive parameters in SWMM model, and Nash– Sutcliffe efficiency (RNS) was used as the objective function. Results of parameter identification are given in Table 1.
Table 2.Error statistics of simulation results.
Calibration Validation
Before urbanization Storm 19810703 19830619 19850702 19870813
RNS 0.62 0.61 0.83 0.64
REp 3 % 3 % 6 % 15 %
AET −1 0 0 +1
After urbanization Storm 20110623 20120721 20110814 20110726
RNS 0.88 0.95 0.84 0.60
REp 2 % 2 % 11 % 4 %
AET 0 0 +1 0
Figure 4.Simulation of flood before urbanization.
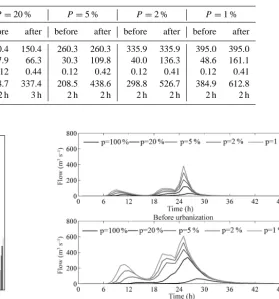
Table 3.Changes of rainfall-runoff processes in different scenarios.
Hydrological Various P =100 % P=20 % P =5 % P =2 % P =1 %
before after before after before after before after before after
Precipitation (mm) 47.7 47.7 150.4 150.4 260.3 260.3 335.9 335.9 395.0 395.0 Runoff (mm) 5.5 14.6 17.9 66.3 30.3 109.8 40.0 136.3 48.6 161.1 Runoff-Coefficient 0.12 0.31 0.12 0.44 0.12 0.42 0.12 0.41 0.12 0.41 Peak flow (m3s−1) 30.6 64.3 118.7 337.4 208.5 438.6 298.8 526.7 384.9 612.8
Peak time (h) 3 h 5 h 2 h 3 h 2 h 2 h 2 h 2 h 2 h 2 h
Figure 6.24-h rainfall processes at different frequency.
As can be seen, Nash–Sutcliffe efficiency is greater than 0.6 and the relative error of the peak flow is smaller than 15 % in both calibration and validation periods, which means that SWMM provided a good estimation both pre- and post-urbanization. Moreover, the simulation results after urban-ization are much better than before, particularly on the oc-currence time of flood peak.
5.2 Rainstorm scenario analysis
According to the hydrological handbook in Beijing, the de-sign storms with different return periods (p=100 %, p= 20 %,p=5 %,p=2 %,p=1 %) were calculated based on design rainfall formula and the 24-h rainfall distribution. The results of design storms are given in Fig. 6. Changes of floods in different urbanization scenarios were simulated with these input precipitation data and the results are shown in Fig. 7 and Table 3.
According to Table 3, the urbanization process has a sig-nificant amplification effect on runoff generation. Taking 100-year return-period (p=1 %) as an example, the surface runoff after urbanization is 395 mm, which is 3.55 times than
Figure 7.Changes of floods in different urbanization scenarios.
that before urbanization. The runoff coefficient increased from 0.12 to 0.41, and the infiltration after urbanization cov-ers 65 % of that before urbanization; however, the peak flow after urbanization is 1.68 times than that before urbanization. Therefore, the amplification effect of urbanization on low-frequency flood is obvious, resulting in an increase of the flooding risk in urban area.
6 Conclusions
In this study, the SWMM model considering different urban-ized scenarios and anthropogenic disturbance was success-fully applied to simulate the rainfall-runoff process in Da-hongmen catchment, Beijing. The measured streamflow data was used for model calibration and validation. Precipitation with different return periods was used as model input to anal-yse the changes of flood characteristics under different ur-banized scenarios. Major conclusions can be summarized as follows:
1. SWMM model has good performance for the simulation of rainfall-runoff process before and after urbanization. Nash–Sutcliffe efficiency is greater than 0.6, and the rel-ative error of flood peak discharge is smaller than 15 % both during calibration and validation periods.
2. The volume of surface runoff after urbanization was 3.5 times greater than that before urbanization; the coeffi-cient of runoff changed from 0.12 to 0.41, and the ratio of infiltration decreased from 88 to 60 %. The amplifi-cation effect of urbanization for low-frequency precip-itation is more obvious and the peak flow of 20-year return-period (5 %) after urbanization is higher than that of 100-year return-period (1 %) before urbaniza-tion, leading to a higher flood risk in urban area.
3. The occurrence time of flood peak shows little change after urbanization. The concentration of overland flow accelerates and the river concentration had grown over time after urbanization. Therefore, the occurrence time of flood peak did not appear in advance or even de-layed on high-frequency precipitation (p=100 % and p=20 %), mainly due to the growing number of artifi-cial river barrages in the study area.
Acknowledgements. This study was financially supported by the key project of Beijing Natural Science Foundation (8141003).
References
Alam, S., Willems, P., and Alam, M.: Comparative Assessment of Urban Flood Risks Due to Urbanization and Climate Change in the Turnhout Valley of Belgium, J. Adv. Res., 3, 14–23, 2014. Brun, S. E. and Band, L. E.: Simulating runoff behavior in an
ur-banizing watershed, Comput. Environ. Urban, 24, 5–22, 2000. Chang, H.: Basin Hydrologic Response to Changes in Climate and
Land Use: the Conestoga River Basin, Pennsylvania, Phys. Ge-ogr., 24, 222–247, 2003.
Chester, L., Arnold, J. C., and James, G.: Impervious Surface Cov-erage: The Emergence of a Key Environmental Indicator, J. Am. Plann. Assoc., 62, 243–258, 1998.
Guan, M., Sillanpää, N., and Koivusalo, H.,: Modelling and assess-ment of hydrological changes in a developing urban catchassess-ment, Hydrol. Process., 29, 2880–2894, 2015.
Guo, F., Hanfei, Q. U., Zeng, H., Cong, P., and Geng, X.: Flood hazard forecast of Pajiang River flood storage and detention basin based on MIKE21, J. Nat. Disasters, 22, 144–152, 2013. Koudelak, P. and West, S.: Sewerage network modelling in Latvia,
use of InfoWorks CS and Storm Water Management Model 5 in Liepaja city, Water Environ. J., 22, 81–87, 2007.
Nirupama, N. and Simonovic, S. P.: Increase of Flood Risk due to Urbanization: A Canadian Example, Nat. Hazards, 40, 25–41, 2007.
Peng, H. Q., Liu, Y., Wang, H. W., and Ma, L. M.: Assessment of the service performance of drainage system and transformation of pipeline network based on urban combined sewer system model, Environ. Sci. Pollut. R., 22, 15712–15721, 2015.
Rossman, L. A.: Storm Water Management Model User’s Man-ual Version 5.0, EPA United States Environmental Protection Agency, 2015.