ORIGINAL ARTICLE DOI 10.1007/s10086-005-0724-9
N. Lundgren (*) · O. Hagman · J. Johansson
Division of Wood Technology, Luleå University of Technology, Skellefteå Campus, Skellefteå SE-931 87, Sweden
Tel. +46-910-58-5707; Fax +46-910-58-5399 e-mail: [email protected]
Nils Lundgren · Olle Hagman · Jan Johansson
Predicting moisture content and density distribution of Scots pine by
microwave scanning of sawn timber II: evaluation of models generated on a
pixel level
Received: October 18, 2004 / Accepted: March 14, 2005 / Published online: February 1, 2006
Abstract The purpose of this study was to use images from
a microwave sensor on a pixel level for simultaneous predic-tion of moisture content and density of wood. The micro-wave sensor functions as a line-scan camera with a pixel size of 8 mm. Boards of Scots pine (Pinus sylvestris), 25 and 50 mm thick, were scanned at three different moisture con-tents. Dry density and moisture content for each pixel were calculated from measurements with a computed tomogra-phy scanner. It was possible to create models for prediction of density on a pixel level. Models for prediction of mois-ture content had to be based on average values over homo-geneous regions. Accuracy will be improved if it is possible to make a classification of knots, heartwood, sapwood, etc., and calibrate different models for different types of wood. The limitations of the sensor used are high noise in ampli-tude measurements and the restriction to one period for phase measurements.
Key words Microwave scanning · Wood · Density ·
Mois-ture content
Introduction
There is an increasing need in the wood industry for preci-sion on-line measurement of moisture content (MC) and density. This information could be used for individual dry-ing of the boards or for quality and stress graddry-ing. A micro-wave signal will be affected by several properties such as density, MC, temperature, and grain angle when it is trans-mitted through wood. These properties have influence on attenuation, phase shift, and polarization of the signal. Moisture measurements can be improved by combining measurements of both attenuation and phase shift1
or measurements of phase shift at two frequencies.2
Another
possibility is to use measurements of different microwave parameters for concurrent prediction of several wood properties from one noninvasive measurement. This has been done, for example, by Bolomey et al.3
and Choffel et al.4
The present study is based on work by Johansson et al.5 in which multivariate models to predict MC and density for boards of Scots pine (Pinus sylvestris) were calibrated using average values over the boards. The purpose of the present work was to evaluate and develop this method with models generated on a pixel level wherein each pixel was treated as one observation.
Theory
Consider a plane electromagnetic wave propagating through wood in the z-direction. If losses due to conduc-tance and reflections are ignored, the attenuation and wave-length are governed by the factor e-gz, with the complex propagation constant,6
g =jw e e m m* 0 ¢ 0 =a+jb, (1)
where w is the angular frequency of the wave, e* =e¢- je≤ is the complex dielectric constant, m¢艐 1 is the relative perme-ability of wood, and e0 = 1/(m0c02
) is the permittivity of free space where c0 is the speed of light in free space.
The real part of g can be defined as an attenuation constant,
a=w eÈ ¢
(
+ d -)
Î
Í ˘
˚ ˙ c0
2 1 2
2 1 tan 1 (2)
and the imaginary part of g as a phase constant,
b=w eÈ ¢
(
+ d +)
Î
Í ˘
˚ ˙ c0
2 1 2
2 1 tan 1 (3)
and 4 can be approximated as
a= b e¢ d
1
2 0 tan (5)
and
b=b e¢Ê + d
Ë
Á ˆ
¯ ˜
0
2
1 1
8tan . (6)
King7
suggested that a should be used for prediction of MC and b should be used for prediction of density. However, tabulated values from Torgovnikov8
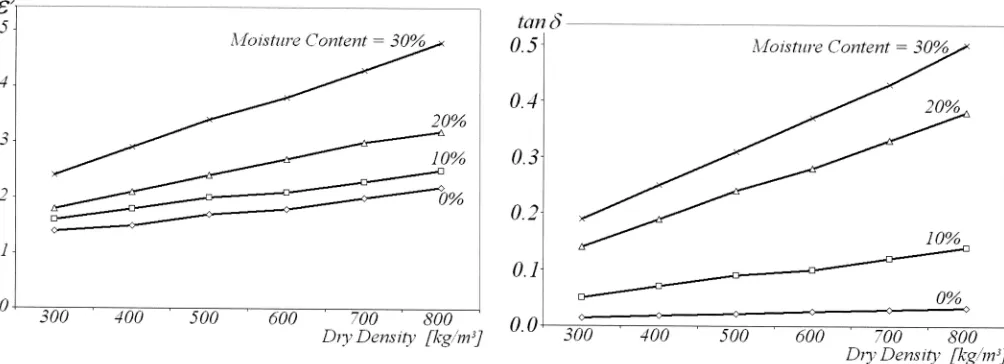
plotted in Figs. 1 and 2 show that both e¢ and tand are correlated to wood density and moisture content. The complex relation between micro-waves and wood properties indicates that multivariate methods are beneficial for simultaneous prediction of mois-ture content and dry density.
in Fig. 3.
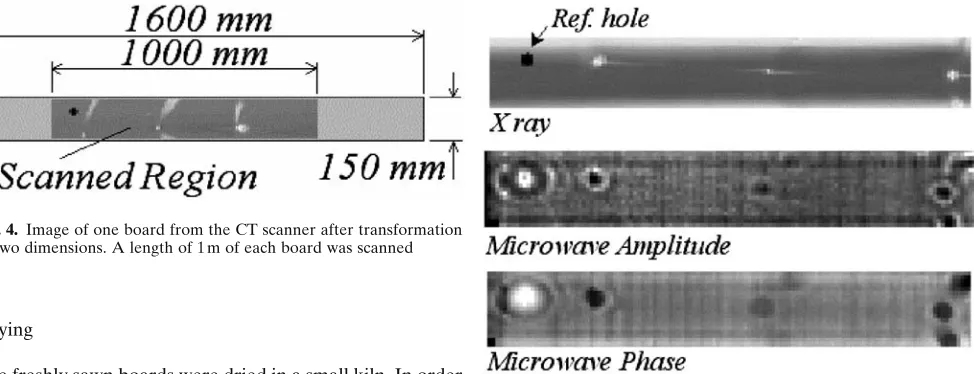
The boards originated from two different parts of Sweden. Half of the boards of each dimension were sawn at a mill in Skellefteå (Wallmarks) situated in the northern part of Sweden. The other 48 boards were sawn at a mill in Ljungby (Vida), situated in the southern part of Sweden. Before scanning, each board was cut to a length of 1600 mm, and a 25-mm hole was drilled as a reference point.
The moisture content (MC) in some of the freshly sawn boards exceeded the dynamic measurement range of the microwave scanner. There was also a large variation in the moisture distribution at higher moisture contents. There-fore, this study is limited to measurements below the fiber saturation point (FSP), which corresponds to a MC of ap-proximately 30%. The boards were dried from green condi-tion to 7% MC. At three different moisture levels, the boards were removed from the kiln and scanned with mi-crowaves and X-rays. Figure 4 shows an X-ray image of the scanned region from one board. The light regions in the image represent areas with high density.
Fig. 1. Real part of the dielectric constant (e¢) perpendicular to the grain as a function of dry density and moisture content at 10 GHz (data
from Torgovnikov)8 Fig. 2. Loss tangent (tand) perpendicular to the grain as a function of dry density and moisture content at 10 GHz (data from Torgovnikov)8
Fig. 3. Cross sections from
Drying
The freshly sawn boards were dried in a small kiln. In order to determine the average moisture content for the boards, they were weighed after each drying step. The target mois-ture content at each drying step was set to 20%, 12%, and 7%. After the last scanning, the dry weight of each board was estimated from five samples taken at even intervals along the board. The moisture content was assumed to be evenly distributed in the boards after the last drying to 7% MC. From that assumption the dry density in each pixel was calculated using the density measured in a computed to-mography (CT) scanner. The dry density was used to calcu-late MC in each pixel from the measured density in the remaining observations. No corrections were made for shrinkage, because the maximum shrinkage was less than one pixel.
X-ray scanner
A CT scanner (Siemens Somatom ART) was used to scan the boards every 8 mm with a 5-mm-wide X-ray beam. The scanner measures density in three dimensions with high accuracy.9
The images from the CT scanner were trans-formed to two dimensions by taking mean values of density variations through the boards.
Microwave scanner
Using a transverse feeding direction, the boards were scanned with a microwave sensor (Satimo 9.375 GHz) in combination with a computer and a conveyer described by Johansson.10 The system produces images with a pixel size of 8 ¥ 8 mm. The sensor is based on electromagnetic trans-mission through the wood and a modulated scattering tech-nique, which is described by Bolomey and Gardiol.11
The sensor measures the real and imaginary part of the electro-magnetic field in two orthogonal polarization angles. From these variables, the linear and decibel amplitude and the phase shift were calculated. All of these five variables were measured and calculated in four different polarization angles: horizontal, vertical, plus 45 degrees and minus 45 degrees. This gives a total of 20 variables describing attenu-ation, phase shift, and polarization of the transmitted field.
Figure 5 shows an example of attenuation and phase shift measured in one direction with the microwave sensor com-pared with density measured with X-rays.
Multivariate models
Models for prediction of dry density and moisture content were calibrated using partial least squares (PLS) regression as described by Martens and Næs12
using the Simca P+ 10.0 software from Umetrics. Average dry density and MC of the wood were calculated from CT images for each pixel in the microwave image and were used as response variables. The variables from the microwave scanner were used as predictors. Each variable was centered and scaled to unit variance. Using the PLS algorithm means that uncorrelated principal components (PC) are formed as linear combina-tions of the correlated variables from the microwave scan-ner. The numbers of PCs were optimized by the software to two or three depending on the response variable. The avail-able amount of memory restricted the number of observa-tions to 200 randomly selected pixels from each board. No distinction was made as to whether the points came from heartwood, sapwood, or knots. About 80% of the observa-tions were used as a training set for calibrating the models. The remaining, randomly selected observations were used as a test set for verification of the models. This gave about 23 000 observations in the training set and 5700 observa-tions in the test set for each thickness.
Results
Moisture content
Models based on values from randomly selected pixels turned out to be weak and noisy with a correlation
coeffi-Fig. 4. Image of one board from the CT scanner after transformation
to two dimensions. A length of 1 m of each board was scanned
Fig. 5. Example of images from X-ray scanning and microwave
cient R2
of approximately 0.20. To avoid this problem, the models for MC shown in Figs. 6 and 7 are based on average values over five homogeneous regions from each board with sizes varying from 0.0025 to 0.015 m2
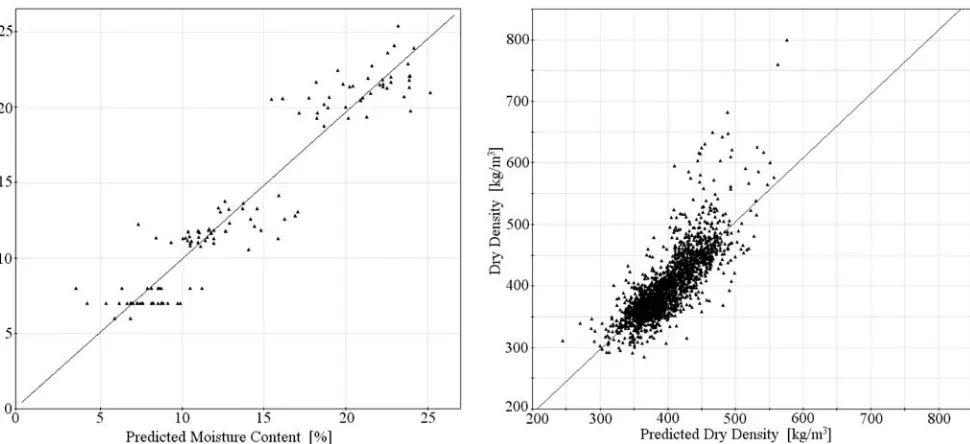
. This reduces the num-ber of observations for each thickness to about 550 in the training set and 130 in the test set used for the verification that is shown in the figures. The model for prediction of MC for 25-mm boards has a correlation coefficient R2
= 0.72 and estimated root mean square error RMSEP = 1.8% MC. The model for 50-mm boards has R2=
0.90 and RMSEP = 2.0% MC.
Density
The models for prediction of dry density shown in Figs. 8 and 9 are based on values from 200 pixels in each board. The model for prediction of dry density for 25-mm boards has R2=
0.71 and RMSEP = 38 kg/m3
. The model for 50-mm boards has R2 =
0.64 and RMSEP = 32 kg/m3 . The randomly selected pixels also contain some high-density values from knots that the model is not able to describe properly.
Fig. 6. Measured versus predicted moisture content for 25-mm boards
based on mean values over five regions from each board
Fig. 7. Measured versus predicted moisture content for 50-mm boards
based on mean values over five regions from each board
Fig. 8. Measured versus predicted dry density for 25-mm boards based
on values from randomly selected pictures
Fig. 9. Measured versus predicted dry density for 50-mm boards based
Discussion
The 50-mm boards consisted mainly of heartwood, with the exception of three boards that showed up as outliers in the model and were excluded from the dataset. One board was also excluded because of rot. It would have been desirable to classify the amount of sapwood in the 25-mm boards in order to find correlations. This was not done, but five boards consisting mainly of heartwood were identified as outliers in the dataset and were excluded. There was no significant difference between the two groups of boards originating from different parts of Sweden.
The variables describing phase shift are periodic and the variation was more than one period between measurements at different MC. This made it impossible to compare these measurements without calibration to a known reference. Therefore, models for MC were mainly based on variables describing amplitude. It can be deduced from Eq. 5 in com-bination with Fig. 2 that MC should have a strong influence on amplitude. However, reflection and scattering at bound-aries where the changes in dielectric properties are large caused large local variations in amplitude. This explains why models for MC could not be based on pixel values. Variations in phase shift caused by differences in dry den-sity were less than one period. Therefore, the variables describing phase shift could be used as strong predictors for dry density.
Conclusions
A good model for prediction of density can be calibrated from pixel values. It is possible to calibrate a satisfactory model for moisture content from average values over ho-mogenous regions, but not from pixel values. Edges, knots, and other regions where properties change will cause errors in the models. These errors can be reduced by taking the
average over a large area. If algorithms that classify the regions could be created, it would be possible to use differ-ent prediction models for differdiffer-ent regions. An improved microwave sensor for wood scanning should measure phase shift over several periods, for example, by using two fre-quencies. It should also produce less noise in the amplitude measurements.
References
1. Kraszewski A (1980) Microwave aquametry – a review. J Micro-wave Power 15:209–220
2. Zhang Y, Okamura S (1999) New density-independent moisture measurement using microwave phase shifts at two frequencies. IEEE Trans Instru Measurement 48:1208–1211
3. Bolomey JC, Cottard G, Lhiaubet GC, Ciccitelli J, Portala JF (1992) On-line control in wood and paper industries by means of rapid microwave linear sensor. Proceedings of 22nd European Microwave Conference, Espoo, 24–27 Aug 1992, Topic 16 4. Choffel D, Goy B, Martin P, Gapp D (1992) Interaction between
wood and microwaves – automatic grading application. In: Lindgren O (ed) 1st International Seminar on Scanning Technol-ogy and Image Processing on Wood. Luleå University, Skellefteå, Sweden, pp 1–8
5. Johansson J, Hagman O, Fjellner B-A (2003) Predicting moisture content and density distribution of Scots pine by microwave scan-ning of sawn timber. J Wood Sci 49:312–316
6. Von Hippel A (1954) Dielectrics and waves. Wiley, New York 7. King RJ (1978) Microwave electromagnetic nondestructive testing
of wood. Proceedings of 4th Symposium on Nondestructive Testing of Wood. Washington State University, Pullman, pp 121– 134
8. Torgovnikov GI (1993) Dielectric properties of wood and wood-based materials. Springer, Berlin Heidelberg New York
9. Lindgren LO (1991) Medical CAT-scanning: X-ray absorbtion coefficients, CT-numbers and their relation to wood density. Wood Sci Technol 25:341–349
10. Johansson J (2001) Property predictions of wood using micro-waves. Licentiate Thesis, Luleå University of Technology, LIC 2001:35
11. Bolomey JC, Gardiol FE (2001) Engineering applications of the modulated scatterer technique. Artech House