DOI 10.1007/s12544-015-0156-6
ORIGINAL PAPER
Review of remote sensing methodologies for pavement
management and assessment
E. Schnebele·B. F. Tanyu·G. Cervone·N. Waters
Received: 10 October 2013 / Accepted: 9 February 2015 / Published online: 7 March 2015 © The Author(s) 2015. This article is published with open access at SpringerLink.com
Abstract
Introduction Evaluating the condition of transportation infrastructure is an expensive, labor intensive, and time consuming process. Many traditional road evaluation meth-ods utilize measurements taken in situ along with visual examinations and interpretations. The measurement of dam-age and deterioration is often qualitative and limited to point observations. Remote sensing techniques offer non-destructive methods for road condition assessment with large spatial coverage. These tools provide an opportunity for frequent, comprehensive, and quantitative surveys of transportation infrastructure.
Methods The goal of this paper is to provide a bridge between traditional procedures for road evaluation and remote sensing methodologies by creating a comprehensive reference for geotechnical engineers and remote sensing experts alike.
Results A comprehensive literature review and survey of current techniques and research methods is provided to facilitate this bridge. A special emphasis is given to the
E. Schnebele ()·G. Cervone·N. Waters
GeoInformatics and Earth Observation Laboratory (GEO), Department of Geography and Institute for CyberScience, The Pennsylvania State University, 302 Walker Building, University Park, PA 16802, USA
e-mail: [email protected] B. F. Tanyu
Department of Civil, Environmental, and Infrastructure Engineering, George Mason University, 4400 University Drive, Fairfax, VA 22030, USA
N. Waters
Emeritus of Geography at The University of Calgary, 2500 University Drive, Calgary, AB T2N 1N4, Canada
challenges associated with transportation assessment in the aftermath of major disasters.
Conclusion The use of remote sensing techniques offers new potential for pavement managers to assess large areas, often in little time. Although remote sensing techniques can never entirely replace traditional geotechnical methods, they do provide an opportunity to reduce the number or size of areas requiring site visits or manual methods.
Keywords Road assessment·Remote sensing·Civil
engineering
1 Introduction
We define “remote sensing” as any surveying method which does not require physical contact with the road sur-face or subsursur-face. This paper does not intend to imply that remote sensing may be used to replace all traditionalin situ
methods. However, if used appropriately, remote sensing may provide tools for rapidly surveying broad areas. Once problem areas are identified, specific conditions may then require the use of traditional road assessment methods.
Because remote sensing is capable of rapidly collect-ing information over wide areas, it has become a valuable method for assessing damage to infrastructure and build-ings following major disasters. Using remote sensing for the analysis of road structure or accessibility following disasters is a new research agenda.
1.1 History of roads and the need for assessment
Unlike the stone roads constructed in ancient times, roads today are not designed or constructed to last forever, mainly for economical reasons. In most US states, roads are typi-cally designed to last 15 to 20 years. Though, with frequent and proper maintenance, the design life may be extended considerably [84]. Typically, the cost of reconstruction of a deteriorated road due to lack of maintenance may be more than three times the cost of preserving a frequently main-tained road [1]. Road conditions are an important factor in the US economy and leading civil engineering institutions, such as the American Society of Civil Engineers (ASCE), continue to produce articles regarding the need to improve roads and other infrastructures. According to [1], currently half of the major roads in the US are considered in poor con-dition with almost 25 % of roads in urban areas (and in some areas even up to 60 %) considered poor. Researchers such as [119] have been reviewing the conditions of America’s highways since 1983 to provide awareness to the general public and legislators.
The cost of maintenance and rehabilitation is high. In 2008, an estimated $182 billion were spent in the US on cap-ital improvements and maintenance of federal highways.1 Although billions are spent annually, many consider this insufficient. For example, the ASCE currently gives the nation’s transportation infrastructure (which includes not only roads and bridges, but dams, rail, levees, etc.) an overall grade of D (on a traditional grading scale ranging from A-F) and estimates $2.2 trillion in improvements are needed.2
The development of road and bridge inspection and maintenance standards were developed in the US fol-lowing the collapse of the Silver Bridge in 1967. In 1971, the National Bridge Inspection Standards (NBIS)
1http://www.fhwa.dot.gov
2http://www.infrastructurereportcard
were implemented as a result of the Federal-Aid High-way Act of 1968.3 The development of a rating method for pavement resulted in the US Army Corps of Engineers Pavement Condition Index (PCI) which “measures pave-ment structural integrity and surface operational conditions” which are “calculated based on measured pavement distress types and severity levels” [113]. More recently, in 1987 the US Department of Transportation’s Strategic Highway Research Program sponsored the Long-Term Pavement Per-formance Program (LTPP) to identify, collect, and catalog pavement defects and signs of deterioration [87].
A pavement’s condition is assessed from data which mea-sure information such as the rideability, surface distress, structure, and skid resistance of the road [57]. Many of the methods utilized for the NBIS, PCI, and LTPP require point data gatheredin situ. For example, a measurement of pavement condition using the PCI requires a manual sur-vey and application of the American Society for Testing and Materials (ASTM) standards (ASTM standards are used to promote health and safety as well as the reliability of products, materials, and systems4), while the Distress Iden-tification Manual for the LTPP provides descriptions of all types of distresses such as cracks, potholes, rutting, and spalling in flexible and rigid pavements as well as methods for measuring these distresses [87].
Because road networks in Europe and the US are so extensive, it is not feasible to use traditional approaches to survey all existing roadways for their rideability and integrity of road structure. Remote sensing methods offer tools to replace or complement existing traditional methods and can serve many needs of transportation civil engineers. In addition to the difficulties associated with creating a com-prehensive evaluation of the over 6,000,000 km of roads in the US from point data, other factors also restrict fre-quent, cost effective, and comprehensive road evaluations. Some of these limiting factors include time (roads need to be closed off during inspections causing transportation disruption), site work on highways can be hazardous for inspectors, manual collection methods which often require trained and experienced inspectors, and the use of destruc-tive techniques. Also, many inspections are descripdestruc-tive in nature making comparative measuring difficult.
Remote sensing techniques provide alternative meth-ods for transportation assessment along with high spatial and temporal resolutions. These techniques can be imple-mented from various platforms, including moving vehicles, unmanned aerial vehicles (UAVs), airplanes, and satellites. Along with multiple platform options, sensors use differ-ent parts of the electromagnetic spectrum and contribute to the identification and the measurement of the surface and
3http://www.fhwa.dot.gov
subsurface defects. These techniques offer non-destructive evaluation methods as compared to traditional procedures such as coring and field surveys. The use of remote sens-ing in transportation research is becomsens-ing an important and economically advantageous area of exploration.
In addition, the utilization of remote sensing methods is not limited to the identification and analysis of pavement defects and distress from weathering or service loads. There are many applications, such as tasking data collection from air- and space-borne platforms, which allow for regional scale identification of destruction during and after natu-ral or anthropogenic disasters. Currently, the utilization of multi-source and multi-spectral data can provide enhanced identification of infrastructure destruction, as well as timely information regarding the trafficabililty of road networks after a disaster.
2 Road types and profiles
For most people, roads are just a layer of asphalt or con-crete that is constructed over dirt (soil) to create a smooth surface to allow vehicular traffic. In reality, roads consist of several layers of material selected, designed, and con-structed following specific US Federal and State design and material guidelines or specifications. Roads are generally categorized as unpaved or paved with paved roads typically classified as flexible, rigid, or composite systems. The subsurface layer varies with road type and plays a major role in the performance of the road [60]. In order to assess road conditions, it is important to understand typical road profiles.
2.1 Unpaved roads
Unpaved roads are typically constructed using a mixture of gravel placed and compacted over finer-grained soil such as clay or silt (or mixtures of these soils) (Fig.1a). The finer-grained soil may be naturally deposited as part of the geological cycle or constructed as a fill as part of an arti-ficially constructed structure such as an embankment or on top of an earth retaining structure. These finer-grained soils form the foundation of the roadway and are referred to as the subgrade [72]. The thickness, gradation, and type of gravel placed over the subgrade will vary based on the availabil-ity of the material close to the construction site as well as the subgrade type. If the subgrade consists of very soft soils, then a gravel with a maximum grain size is used to mini-mize the total deflection (rutting). If the size of the aggregate becomes too coarse, additional finer grained aggregate is mixed in with the coarser aggregate to fill voids and create a smoother surface. The thickness of the gravel layer is usu-ally selected based on the local experience, although there
are generally accepted unpaved road design methodologies [43]. It should be noted it is not uncommon to have gravel layers above subgrade in excess of 1m if the subgrade or the gravel are not of high quality.
2.2 Paved roads
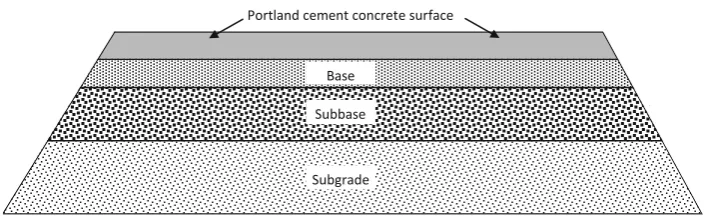
Paved roads are typically categorized as either a flexi-ble or rigid pavement system. Sometimes, as part of the reclamation, the old road is not completely removed prior to construction of the new road and is referred to as a composite pavement [60]. The major difference between flexible and rigid pavement systems is the application of a bituminous surface layer (e.g., asphalt layer) in a flex-ible pavement or a Portland cement concrete layer in a rigid pavement system. In general, regardless of the type, pavement systems are constructed with the highest quality materials on the top where traffic stresses are greatest [60]. The thickness of the layers within the pavement system will typically decrease as constructed over subgrade due to the increased cost of the materials.
Following the subgrade layer is the application of a sub-base layer. This layer is constructed to provide foundational support for the subsequent, higher layers if the subgrade is insufficient. The subbase is constructed by one of the following methods: (1) physically improving the subgrade with compaction and placing a coarse aggregate over the existing soil; (2) removing a portion of the soft subgrade and replacing it with more suitable soil; (3) adding chemi-cal additives into the ground followed by compaction. The materials used for the subbase layer are similar to the mate-rials used for unpaved roads but it is important to note, for approximately the last 20 years, transportation engi-neers also commonly use materials other than natural soils. Sometimes the soil will be reinforced with fabric-like mate-rials such as woven or nonwoven geotextiles or matemate-rials resembling plastic (e.g., geogrids or geocells) [32,67,132]. Additionally, the natural soil can be completely replaced with recycled materials (e.g., industrial by-products such as foundry sand, foundry slag, bottom ash, or fly ash) [122]. The thickness of the subbase layer is usually constructed in the order of 450-600 mm but will vary based on the properties of the subgrade.
For flexible pavements, the layers above the base layer consist of (from the bottom up) a binder course and a surface course (Fig.1b). The binder course consists of a mixture of larger aggregates and asphalt and is typically constructed to be between 50-100 mm thick. The surface course is the top of the pavement and is usually constructed from dense asphalt. As the crown of the pavement system, this layer must be constructed to resist distortion under traffic, be rea-sonably waterproof, smooth, and provide skid resistance. On rigid pavements, the layer above the base layer typically consists of 150-300 mm thick Portland cement concrete (Fig.1c). The surface of the rigid pavement is much stiffer than the surface of the asphalt pavement and is custom-arily constructed directly over the base course (sometimes without having a subbase layer underneath). Although the concrete for rigid pavements is constructed in several dif-ferent ways, these types of pavement systems will contain some form of reinforcement elements such as dowels, wire mesh, or deformed bars within the concrete.
Composite pavement is typically a combination of both flexible and rigid pavement. Usually, concrete is used at
the bottom of the two layers, providing a strong foun-dation to support heavy traffic with the asphalt on top providing a smooth riding surface. As with other pavement systems, these types of systems may also include a base layer depending on the subgrade conditions. Due to the high cost of constructing these systems, composite pavements are limited to less than 1 % of the paved roads in the US [60].
3 Common road defects
Roads are considered problematic typically when they start to indicate issues related to their (1) structural adequacy, (2) skid resistance, or (3) surface defects. Some of these prop-erties are more suited for remote sensing evaluations than others.
3.1 Structural adequacy
Structural adequacy is associated with the load transfer efficiency of the road and is evaluated using measured
Fig. 1 Profiles of unpaved, flexible, and rigid pavements
B.) Flexible pavement profile
C.) Rigid pavement profile
Portland cement concrete surface
Subgrade Subbase Base Asphalt surface
Subgrade Subbase Base Binder
A.) Unpaved road profile
Subgrade Gravel Road surface
deflections inflicted at the surface of the pavement. The deflections are created by applied loads such as static or slowly moving loads (e.g., Benkelman beam, Califor-nia travelling deflectometer, and LaCroix deflectometer), steady-state vibration (e.g., Dynaflect and road rater), or impulse loads (e.g., falling weight deflectometers). The measured deflections are used to backcalculate elastic mod-uli or the load-transfer efficiency of the subsurface layers. Predicting this type of behavior via remote sensing, without being able to apply pressure to the surface, is difficult.
3.2 Skid resistance
Skid resistance is a property of the pavement which cre-ates enough surface friction for vehicles to maintain control, especially during wet conditions. Although skid resistance is also a function of the driver and vehicle characteristics, surface conditions such as bleeding or polished asphalt or smooth macro-texture are used as indicators to identify the potential for skid resistance hazards. Skid resistance of a road is typically measured with a locked wheel trailer pro-cedure where the trailer is pulled at a certain constant speed while the braking system of the test tire is actuated to lock the tire on a wet road surface.
Recently, remote sensing has been applied to measure the macro and micro-texture of the surface. [138] used multiple laser scanners to identify surface macro-texture at a 1 mm resolution collected at highway speeds. [21] used spectral and fractal analysis to identify micro-texture changes due to a differential loss of mineral constituents from tire pol-ishing. [83] illustrate how 3D photogrammetry can capture micro-texture changes from polishing.
3.3 Surface defects
Surface defects are visible indicators of road serviceability and are closely related to roughness, which is often uti-lized for road condition evaluations. There are a variety of available remote sensing applications for the identification, measurement, and classification of surface defects and thus, also to provide estimations of road roughness. The follow-ing subsections describe the usual features associated with surface defects that may be identified with remote sensing methods.
3.3.1 Unpaved roads
Below is a summary of the most common visible defects/deformations which typically affect unpaved road performance [8,41,44,60,96,104,125,133].5
5http://www.wrapair.org
– Potholes: Bowl-shaped holes caused by the move-ment of loose surface material under traffic loads. They become problematic if their depth and diameter becomes greater than 25 mm and 200 mm, respectively. – Rutting: Longitudinal deflections along the wheel-path caused by permanent deformation or compaction of road material under traffic loading. Unpaved roads con-structed over a subgrade with a high clay content or with minimal surface coarse aggregate are prone to rutting in wet conditions.
– Corrugations: Evenly spaced transverse ridges caused by traffic actions in conjunction with lose of aggregate. They often occur in areas with heavy acceleration and deceleration traffic actions.
– Erosion and gravel loss: This occurs from a sweeping action of traffic or free flowing water across road sur-face. It may severely alter the cross-section of the road causing safety concerns and poor rideability.
– Pulverization: A break down of surface aggregate par-ticles under traffic load creating excessive dust with rolling wheels. Although pulverization may not hinder the riding quality of the road surface, it may create safety hazards and discomfort both to the drivers and in areas within the vicinity.
3.3.2 Flexible pavement
Below is a summary of the most common visible defects/deformations which typically affect flexible pave-ment performance [27,41,60,96,104,112,125].
– Cracking: There are three types of cracking common to flexible pavement: surface, fatigue, and movement (term used for the purpose of this paper) cracking.
Surface cracking is associated with aging and deteri-oration of the surface bituminous layer due to shrinking and hardening. It is not associated with applied load and may appear along the full-width of the pavement. Thermal cracking, a subset of surface cracking, is com-mon in northern regions of the US where temperatures can fall below−23◦C. Thermal cracking forms when the thermal stress on the pavement is greater than the fracture strength. Thermal cracking may also occur in milder climates if the asphalt becomes hardened due to aging or if the road was constructed with hard asphalt.
Movement cracking is associated with the movement of the subsurface layers such as the subgrade, concrete slab below the asphalt, culvert, or bridge joints. It typ-ically appears transverse or longitudinal and follows the dimensions of the problematic area underneath the surface.
– Potholes: Bowl-shaped holes similar to those in unpaved roads, typically form as a result of untreated cracks. They are problematic if depth and diameter becomes greater than 25 mm and 150 mm, respectively. – Rutting: These surface deformations occur along the wheel-path as similarly observed in unpaved roads. They are caused mainly by the deformation of the sub-surface layers as a result of the sub-surface traffic load propagating to subsurface layers.
– Swelling: An upward bulge on the pavement surface usually caused by frost action or by swelling subgrade soils. Swelling can appear as a localized bulge or a long gradual wave.
– Shoving: These defects are similar to rutting, however, they typically occur in areas where vehicles frequently stop and start. They are result of shear forces induced by traffic loading and form as localized longitudinal or transverse displacements.
– Raveling: This is the result of traffic abrasive action and is indicated by a progressively damaged sur-face downward into the pavement layers, such as the binder course, and aggregate loss within the binder course.
– Bleeding of asphalt: Shiny black surface caused by liquid asphalt typically migrating in hot temperatures along the pavement surface. It has a large impact on skid resistance of the asphalt.
– Polished asphalt: Wearing off of the sharp edges in the surface aggregate from traffic. It results in a smooth slippery surface and has a large impact on skid resis-tance of the asphalt.
As a result of some or all of these defects, the flexible pavement may lose its smoothness (become too rough), skid resistance, macro-texture (ability to drain under wet conditions), and overall rideability quality.
3.3.3 Rigid pavement
Below is a summary of the most common visible defects/deformations which typically affect rigid pavement performance [22,26,34,36,41,60,93,134].
– Cracking: In general, there are four types of crack-ing in rigid pavement: surface, durability, cluster, and diagonal cracking.
Surface cracking is associated with aging and dete-rioration of the surface concrete layer and does not
protrude deeply into the concrete slab. It may form as a series of random cracks, longitudinally parallel to the pavement centerline, or pop-outs of small pieces of pavement broken loose from the surface.
Durability cracking forms adjacent to joints, cracks, or free edges of the pavement and is initiated at the intersection of cracks and a free edge. It usually appears as closely spaced, crescent-shaped, dark colored, hair-line cracking. It is mainly attributed to the response of the material properties to freeze-thaw cycles and aggregate pore structure.
Cluster cracking is a closely spaced transverse crack-ing occurrcrack-ing in groups of three or more with spaccrack-ing ranging between 150-600 mm. This is more of a charac-teristic of continuously reinforced concrete pavements and is typically associated with changes in conditions below the surface, such as settlement within subsur-face layers, poor drainage conditions, and high base friction. However, it may also form as a result of inadequate concrete thickness, lack of concrete con-solidation, and construction of concrete during high temperatures. It usually occurs early in the life of the pavement.
Diagonal cracking indicates an existing foundation problem (settlement or expansion) and forms in a direc-tion oblique to the pavement centerline.
– Blow-ups: A localized upward movement of the con-crete pavement surface at cracks or joints typically occurring in high temperatures and precipitation. They occur in older systems where the expansion space within the concrete pavement is insufficient for expan-sion. Depending on the magnitude of the blow-up, the road may have to be closed to traffic.
– Faulting: Created by a movement along the joint or a crack creating an elevation difference. The name is taken from the movement observed in nature after earthquakes, however, the cause of this type is not typ-ically associated with earthquakes (although they may also form after earthquakes). Faulting occurs when the concrete slab losses its support due to erosion or set-tlement of the subsurface layers. It is one of the most prominent defects and has a direct impact on road rideability.
– Spalling: Breaking, cracking, or disintegration of the slab edges within 0.6 m of a joint or crack. Spalling is generally associated with a surface weakness within the concrete but if allowed to progress and deepen, will be an indicator of a structural weakness within the concrete.
of the transverse cracks and is also aided by corrosion of the steel within the concrete.
– Pumping: This results from water seeping into the pave-ment system or ejecting out of the system through the cracks or joints. In some cases it is detectable by deposits of fine material left on the pavement surface. It is caused by inadequate concrete slab thickness and erodible underlying layers.
– Joint seal damage: This results from joint deterioration, enabling a significant amount of water to infiltrate into the joint from the surface, weed growth at the joint, or intrusion of particles into the joint. It may lead to devel-opment of closely spaced transverse cracks or large numbers of interconnected cracks near the joint.
As for the flexible pavements, based on these defects the road may show low rideability quality or eventually be closed to traffic.
4 Traditional assessment of road surface defects
Many road authorities still utilize methods requiring in-person “walk and look” measurements while others use mechanical devices to measure certain surface defects. Manual walking surveys may include 100 % of the area to be surveyed, measured, recorded, and sometimes mapped. [87] provide a comprehensive manual regarding walking surveys of road surface defects using visual inspections and
in situfield measurements. The US National Cooperative Highway Research Program (NCHRP) Synthesis 334 sum-marizes the methods of capturing surface distresses utilizing both in-person surveying as well as semi-automated and automated methods including riding surveys [81]. Tradi-tional riding surveys estimate the severity of road defects while driving along the shoulder at slower speeds or, less accurately, while driving on the pavement at normal speeds.
The transition from manual to automated data collec-tion has increased over the past 20 years. According to the NCHRP Synthesis 203, in 1994 40 states in U.S. were sur-veying surface defects predominantly using manual meth-ods [47]. In 2004, of the 45 state agencies surveyed, only 17 were still utilizing manual survey methods [81]. The remaining 28 state agencies were implementing some form of digital or analog video surveillance along with automated systems. As of 2007, several well-established firms were providing commercially available semi-automated methods [117]. [124] recently presented a software package based on photogrammetric methods to fully assess the severity of potholes using automated systems. Today, most departments of transportation (DOTs) are open to vendor demonstra-tions to implement fully automated systems. Some DOTs,
such as the Virginia Department of Transportation, have developed data collection requirements to guide vendors on how to generate automated data of acceptable quality [136]. It is clear that many state and local agencies are imple-menting more automated and remote sensing methods but currently there is no single, well-accepted automated system embraced by all DOTs to evaluate surface defects.
Traditional methods provide accurate and valuable infor-mation but obtaining these data can be time consuming. Furthermore, when the interpretation of the severity of the damage is determined based on judgment (even though there are well established rating criteria), the results can vary. Therefore, the integration of more automated and semi-automated remote sensing methods is inevitable and may provide valuable results when generated/interpreted by a computer. The outcome of these surveys is likely to be less expensive, more consistent, faster, and cover wider areas.
The remainder of this article offers an overview of available remote sensing tools to provide industry and gov-ernment agencies guidance in the selection of appropriate methods for accomplishing specific road assessments.
5 Overview of remote sensing methods
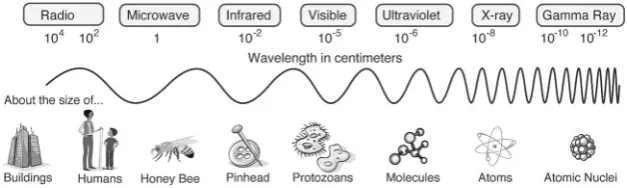
The Sun is the primary source of energy for the Earth. This energy, or electromagnetic (EM) radiation, travels through space in the form of waves which are absorbed, reflected, or scattered by the Earth’s atmosphere and its surface. The amount of energy emitted or absorbed by an object is a func-tion of temperature, and every object with a temperature above 0 degrees Kelvin emits EM radiation. Plank’s equa-tion defines a theoretical relaequa-tionship between temperature and EM energy emitted, which is used to define blackbod-ies. Stars most closely approximate the theoretical black-body emission, whereas all other objects, called greybodies, have emissions lower than this theoretical maximum.
Peak emission is a function of temperature, with wave-length decreasing as temperature increases. Therefore, the sun which has an approximate temperature of 6000 degrees Kelvin peaks in the visible region of the EM spectrum, whereas the Earth, with an average temperature of about 300 degrees Kelvin peaks in the thermal infrared region. This relationship is governed by the Wien law [50].
5.1 Remote sensing techniques
Fig. 2 Electromagnetic Spectrum as a function of frequency. Length of the wave signal is compared to physical objects. Source: NASA
photographs, are the most common method of remote sens-ing for pavement analysis. The use of ground penetratsens-ing RADAR (GPR) has long been employed by geotechnical engineers to detect subsurface anomalies. While variations in temperature identified in the infrared region can be used to locate defects and cracks in pavement. Techniques such as laser scanning and hyperspectral imagery also contribute to identifying and locating defects and distress, often more rapidly than manual surveying. Sensors, mounted on various types of platforms, gather electromagnetic radiation emitted or reflected from the object or area of interest. The spatial, temporal, and spectral resolutions of the remote sensing data collected vary depending on the type of sensor and platform utilized.
5.2 Remote sensing platforms
Data can be collected remotely from any number of places or platforms. The following section summarizes the most common platforms used to gather remote sensing data.
5.2.1 Satellite
Imagery collected from satellites provides the largest spatial coverage of any remotely sensed data and is used in mul-tiple disciplines ranging from the earth sciences to military reconnaissance. Although these data can cover extremely vast regional or continental areas in a single image; data col-lection, quality, and usability can be limited by revisit times, atmospheric interferences, and spatial resolution.
A satellite’s orbit and inclination will determine data coverage and availability. For example, geostationary satel-lites orbit the Earth above the equator traveling at a speed equal to the Earth’s rotation in order to maintain a constant location above the Earth. These high orbit satellites (e.g., GOES6) are extremely useful for meteorological applica-tions because they offer continuous coverage over the same area. They are limited by their inability to gather infor-mation over polar regions as well as their low spatial resolutions. Because of this low spatial resolution, they are not suitable for road studies.
6http://goes.gsfc.nasa.gov
Alternatively, polar orbiting satellites, such as MODIS’s Terra and Aqua7or Landsat ETM+8, are useful for mapping, earth science, or surveillance tasks because they acquire information over every part of the Earth’s surface. They offer a variety of temporal and spatial resolutions depending on their altitude and velocity.
5.2.2 Airplane
Aerial platforms offer higher spatial resolutions than many satellite products with greater tasking flexibility. They are commonly used for remote sensing applications in multi-ple disciplines, from military to environmental. Airplanes can be fitted with various sensors and recording devices and gather operational data from altitudes ranging from approximately 300-13,000 m9[20].
5.2.3 Unmanned aerial vehicle
Unmanned aerial vehicles (UAV) are capable of provid-ing high resolution, near real-time imagery often with less expense than manned aerial or spaceborne platforms. For example, [35] illustrated how a UAV system can cap-ture images to map roads and vehicles and provide infor-mation regarding traffic, accidents, or natural disasters within 2 hours of the event. [150] were able to identify defects such as rutting, washboarding, and potholes on unpaved roads using pattern recognition and image clas-sification techniques from 2D images collected from a UAV. [152] developed a UAV based system to collect 3D high resolution photogrammetric imagery of road surface distresses for unpaved roads. Their quick response times, high maneuverability and resolutions make them impor-tant tools for disaster assessment [123]. [10] designed a low cost UAV with a photogrammetric payload for use after natural disasters to estimate and identify infrastructure damages.
7http://modis.gsfc.nasa.gov
8http://landsat.gsfc.nasa.gov
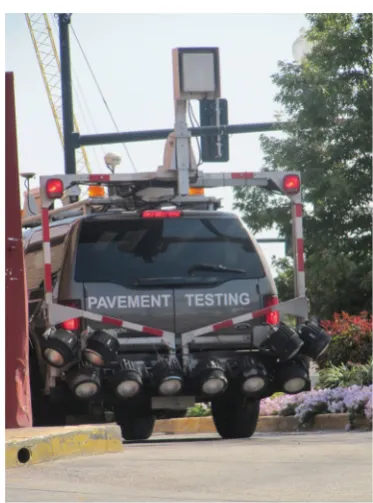
Fig. 3 Road assessment in Washington, DC
5.2.4 Vehicle
Multi-purpose survey vehicles are employed worldwide for pavement evaluation (Fig.3). Sophisticated survey vehicles offer integrated platforms where multiple conditions such as texture, cracking, rutting can be captured.10 Vehicular plat-forms are useful because continuous, high resolution data can be gathered at highway speeds without traffic disrup-tion. They are also capable of collecting data under trees and bridges which would otherwise be obscured from aerial or satellite views.
Data collection is gathered using various methods includ-ing laser scanners, photo or video cameras, GPR, thermal, or acoustics to identify distresses. [40] designed an auto-matic pavement distress survey system mounted onboard a vehicle. They collected data by illuminating the road sur-face with an argon laser light, scanning the illuminated surface using a laser scanner, and recording the profile data in video. GPR data is also collected from vehicu-lar platforms. [77, 109] utilized a van-mounted, air-horn antenna to collect GPR data for road evaluations. [131] illustrated how 3D LiDAR data of the pavement surface can be gathered at highway speeds from van-mounted equipment.
10http://yottadcl.com
6 Remote sensing methods applicable to road assessment
6.1 Unpaved roads
Although approximately a third of the roads in the US are unpaved, few studies specifically address remote sensing methods for assessing unpaved road conditions.11While the costs associated with their initial construction are less com-pared to flexible or rigid pavements, unpaved roads require more frequent assessment because their condition can dete-riorate quickly. This additional monitoring often results in increased expenses [11].
Many of the common defects found on unpaved roads (as described in Section 3.3.1) can be identified using remote sensing methods. Digital photos taken from low altitude manned aerial, UAV, or vehicular platforms provide data with appropriate resolutions for identifying distress such as potholes, ruts, and corrugations as well as changes in road surface elevation [13]. The monitoring of unpaved roads is also accomplished by gathering data from lasers, accelerometers, and videos [11].
Using data collected from the visible region of the EM spectrum (eg. photographs), and techniques such as pat-tern identification, it is possible to identify common defects like rutting, washboarding, or potholes, as well as changes in texture or color which can be indicative of a loss in aggregate materials [106]. Construction of 3D profiles using lasers can contribute to the identification of the road crown as well as potholes. For example, [152] used a UAV and photogrammetric methods to create a 3D model of sur-face distress, such as ruts and potholes, with a resolution up to 5mm for unpaved roads. Unpaved roads will deteri-orate rapidly in conditions of excessive water or moisture. [92] illustrated how a Noise-Modulated Ground Penetrat-ing Radar (GPR) may provide a fast, quantitative approach to identifying moisture in unpaved roads, which is useful for determining if roads are able to sustain heavy vehicu-lar traffic after flooding as well as identifying possible road failures from excessive moisture.
6.2 Paved roads
6.2.1 Visible
Visual methods of pavement assessment, either manual or automatic, are the most common approaches to detecting and classifying surface defects as well as identifying large scale damage from natural or human disasters. These data are collected in multiple ways including, 1D and 2D line scanners on-board moving vehicles as well as from aerial
and satellite photos or images. Automatic detection meth-ods are faster and easier to apply to multiple images than manual image interpretation. Automatic interpretation com-prises image processing and pattern recognition techniques to identify defects and distresses [58, 86]. When multi-temporal images are available, change detection techniques are commonly used to identify large scale infrastructure damage after disasters [115].
Image processing methods can be used to isolate the defect(s) from the background and create a binary image. The identification and classification of pavement distress is then interpreted from the binary image [42, 69, 97, 148]. Wavelet and Fourier transforms as well as segmenta-tion algorithms are common image processing techniques used for pavement and concrete assessment. Two primary segmentation methods utilized for pavement distress iden-tification are edge-detection and thresholding [100, 115, 127]. [61,101] applied edge-detection algorithms such as Canny and fast Haar tranforms for crack identification [17]. [68] utilized image segmentation and texture analysis to identify potholes. [110] developed a methodology which included the use of wavelets, segmentation, and threshold-ing to detect and classify four types of crackthreshold-ing: longitudnal, transverse, block, and alligator, in flexible pavement [100].
The detection of cracks using image processing tech-niques is difficult because not only do cracks represent a very small portion of the overall image, but also, the road surface texture can disguise irregularities [18]. The automatic detection of pavement distress becomes more complex for images with changes in lighting or with shad-ows, for roads with variations in surface textures, as well as for roads with variations in their surface’s reflectivity. Also, a simple visual interpretation does not provide information of subsurface failures.
[120] proposed a method for pavement inspection which combines a camera with a laser range finder. They col-lected pairs of images taken from the same perspective, but with different lighting, to determine crack depth while also increasing the accuracy of the distress assessment. By utiliz-ing two lightutiliz-ing schemes, the issues related to poor lightutiliz-ing, shadows, and reflectivity from the surface were reduced.
Digital imagery and processing can be expensive and hampered by lighting restrictions. Photogrammetry is a low-cost option which offers 3D information and is now being used for pavement assessment. [2, 65] demonstrate how low-cost photogrammetry can accurately recreate pavement surfaces and locate cracks and potholes in 3D.
6.2.2 Ground penetrating radar
Ground penetrating radar (GPR) employs electromagnetic energy in the microwave range, utilizing wavelengths (3m-200mm) to examine subsurface features with either a
ground-coupled antenna (3m-60cm) or air-coupled antenna (300-200mm) [109]. Because of differing dielectric con-stants - especially due to the sensitivity of RADAR to water - changes in materials, moisture contents, and voids may be detected in the returned signal.
GPR can be an effective tool for assessment because it can be operated on-board a moving vehicle traveling at highway speeds, allowing for rapid assessment of road conditions. The most popular and useful applications of GPR in pavement management include the measurement of pavement layer thickness and void discovery [77,90,109].
Appraising pavement thickness provides crucial informa-tion for establishing load ratings and estimating pavement life by detecting changes in the pavement structure.In situ
testing of pavement thickness requires lane closures and can be expensive and time consuming. Using GPR, the thick-ness of each pavement layer is estimated as a function of the RADAR velocity and the round trip travel time of the signal. Although GPR is a successful tool for measuring the thickness of asphalt pavement [135], the inherent char-acteristics of Portland cement concrete (PCC) pavement do not yield similar results. PCC has higher moisture and salt contents resulting in RADAR attenuation [15, 77]. Also, the similarity between the dielectric constants of PCC and base materials make distinguishing between the two layers difficult.
Locating voids - both water and air, can be extremely valuable, as moisture between asphalt layers or between the asphalt and base layers is a precursor of pavement deterio-ration. Moisture related surface distress includes cracking, potholes, rutting, shoving, and raveling [66]. [37] found GPR to be useful for identifying cracks in flexible pavement and measuring crack depths ranging from 50mm to 160mm. This non-destructive technique can be more favorable than the traditional, destructive coring methods for crack depth measurement. [28,49] were able to identify moisture in the subgrade of flexible pavements using GPR. The early identi-fication of cracks and their depth as well as areas of moisture is crucial for early maintenance and remediation. Recent testing of GPR with a multiple antenna array illustrated its application in identifying moderate to severe stripping, a common cause in pavement delamination [51].
Although GPR can provide valuable data, the signal is complex and requires skilled technicians to interpret the results. Moreover, it only identifies or detects changes in subsurface features, without providing their dimensions.
6.2.3 Infrared thermography
accurate horizontal dimensions. In contrast, it is possible to obtain horizontal measurements of voids using infrared thermography, but the technique does not provide depth or thickness measurements [139].
Infrared thermography operates by measuring the amount of radiation emitted from an object in the infrared range (9–14μm). The measured radiation is a function of the object’s emissivity and temperature, along with surround-ing weather and atmospheric conditions. IR thermography is used in multiple medical, construction, and military applications for the identification of thermal irregularities or contrasts.
[102] found IR thermography to be useful for evalu-ating defects in asphalt pavements. As asphalt ages, the decrease of its oily constituents instigates an increase in sur-facing limestone. By utilizing limestone’s high absorption at 11.2 μm they were able to identify areas of deteri-oration. This technique is not applicable in urban areas because of reflected radiation from the heat island effect. [91] identified cracks and regions of delamination in airport pavements by identifying areas with at least a 0.5◦C temper-ature differentiation which was exhibited between defects and surrounding materials. IR thermography was also uti-lized by [31] to identify non-emergent defects in asphalt pavement.
Reflected radiation from the surrounding area, atmo-spheric absorption of radiation, and outdoor features such as wind, rain or sunlight all affect local temperatures and will increase the complexity of IR thermographic interpretation [23].
6.2.4 LiDAR and terrestrial laser scanning
Similar to RADAR technology, which uses microwave or radio waves, LiDAR (Light Detection and Ranging) cap-tures details by illuminating an area using light from the near-infrared region (approximately 1.0μm) and measur-ing the travel time between the transmission of the signal and its reflection or scatter back. The infrared light is com-monly emitted at a rate of 5,000 pulses per second [4,19]. This results in a dense cloud of points in x, y, and z posi-tions which are highly accurate and precise. LiDAR is often used for mapping topography and the creation of digital ele-vation models. When mounted on a moving vehicle, road surfaces can be mapped using the dense and accurate 3D LiDAR point cloud [89]. Unlike other techniques, such as photogrammetry, LiDAR is not restricted by the sun angle and can be implemented during the day or night.
Recently, LiDAR has been applied in pavement evalua-tion projects. [19] illustrates how LiDAR and a grid-based processing approach can be applied to pavement distress features, such as potholes, to identify and estimate their vol-ume to calculate the amount of fill material needed. LiDAR
3D surface models can be used to identify uneven or low areas susceptible to drainage problems and flooding within a 2cm elevation accuracy [131].
Terrestrial laser scanning (TLS) is being utilized for the evaluation of pavement surface conditions. Mounted on-board a moving vehicle and used in conjunction with a digital camera, a laser line scanner is used to construct high resolution, 3D continuous pavement surveys. [73] detected distortions, rutting, shoving, and potholes, in asphalt pavement using high-speed 3D transverse scanning. [128] successfully recognized cracks of 2mm and greater in asphalt pavements. [145] demonstrated the use of a multi-sensor, laser scanning method for the detection of cracks by fusing laser line scanned data with video to produce a 3D model of a road surface which identified cracks of a few cm as well as their depth. [130] were able to detect faulting in the joints of concrete pavements with an error of less than 1mm. [138] have developed a prototype pavement data collection system that uses multiple laser scanners to iden-tify surface distress, rutting, roughness, macro-texture and road geometry at a 1mm resolution collected at highway speeds which processes in real-time. [103] utilized a laser line scanning system to assess surface texture and skid resistance. [25] found automated pavement surveys to be safer and less labor intensive than manual collection meth-ods while still providing results consistent with standard techniques.
TLS produces high resolution, continuous transverse pavement profiles and it is insensitive to lighting conditions (day, night, or shadow) or low contrast conditions [126]. The high cost of the TLS instrumentation and hardware may make its implementation cost prohibitive.
6.2.5 Hyperspectral
Hyperspectral imagery utilizes large numbers of narrow, contiguous spectral bands (sometimes ranging from as much .35 − 2.4 μm) to gather detailed spectral infor-mation, often regarding chemical and mineral proper-ties, of an observed feature [24, 48, 55, 105]. Because spectroscopic data can provide information regarding the properties of asphalt surfaces, hyperspectral techniques offer unique opportunities to evaluate road characteristics [45].
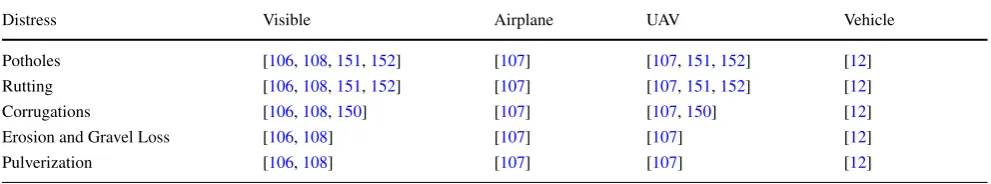
Table 1 Summary of typical unpaved road defects and remote sensing methods for assessment
Distress Visible Airplane UAV Vehicle
Potholes [106,108,151,152] [107] [107,151,152] [12] Rutting [106,108,151,152] [107] [107,151,152] [12]
Corrugations [106,108,150] [107] [107,150] [12]
Erosion and Gravel Loss [106,108] [107] [107] [12]
Pulverization [106,108] [107] [107] [12]
infrared (SWIR) for aged pavement compared to new ment. Although the distinction between new and aged pave-ment was evident when comparing their spectral signals, distinguishing the degree of weathering of an aged pave-ment was more difficult, even when substantial changes were evident in thein situPCI and SI indexes. Aged pave-ment spectral signals become more complex when cracks in the asphalt expose unweathered materials, which have a lower reflectivity. Shadows from surface roughness were also shown to decrease reflectivity in the NIR and SWIR as much as 7 %-8 % [53].
[7] found road surface reflectivity governed by not only pavement age, but material quality and road circulation and that a principal component analysis (PCA) performed well at distinguishing between asphalt conditions. Specifically, circulation was found to increase reflectivity while simul-taneously causing deterioration, the degree of which was dependent on material quality. This led to an overlapping in spectral signatures in some instances. Using the combined conditions of age, circulation, and material quality they were able to create 5 general categories of road conditions ranging from very good to poor.
Hyperspectral imagery cannot replace an experienced road inspector. For example, cracks expose unweathered material so the differentiation between moderate to severely weathered pavements is not a straightforward process. How-ever, it does offer insights into surface conditions and can reduce the number of areas where the use of destructive and time consuming testing is needed.
6.2.6 Emerging techniques
New remote sensing and data collection techniques are emerging, often taking advantage of the extensive use of internet mobile devices. For example, [85, 88] designed systems which reside on smart phones to detect potholes and bumps using accelerometer and GPS data. The city of Boston, MA uses “Street Bump” a new mobile phone app to detect potholes. The app utilizes wavelets and Kruskal’s algorithm to detect potholes and then sends a message along with a location to a centralized database.12
12http://www.informationweek.com
Other unique methods include an acoustic technique for evaluating pavement surface conditions by collecting sounds generated by tires from a vehicle mounted micro-phone [153]. [121] evaluated flexible pavement conditions using a phase array Synthetic Aperture Radar (SAR). They found that an increase in backscattering in the HH polar-ization signified poor surface pavement conditions and translated well as a ride quality evaluator with an assessment accuracy of 97 % [121].
6.3 Summary matrices
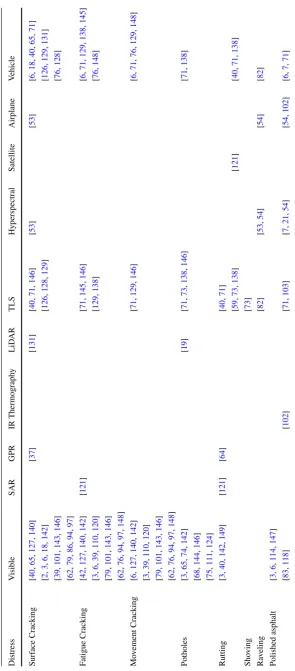
A summary of recent research regarding the use of remote sensing techniques for pavement assessment is included in the following tables. Table1summarizes research regarding unpaved roads, while Tables2and3illustrate work concern-ing flexible and rigid pavements, respectively. It is apparent the majority of work concerns crack identification using visible inspections. This is especially evident for flexible pavements from vehicular platforms.
This inequality in methods and research agendas may be attributed to a number of factors. For example, the vast majority of research concerns flexible pavements versus unpaved roads or rigid pavements and is likely due to the larger use of flexible pavement in the US. The lack of research regarding unpaved roads is also likely the result of its lower cost as well as its locations in more rural, less traveled areas.
Although the selection of an appropriate remote sens-ing technique can be problem specific, the abundance of research concerns visible methods. Visible surveys are traditional, familiar, and often less expensive than other methods. Techniques such as TLS or LiDAR can require expensive equipment as well as trained technicians and, therefore, may be slower to integrate into management programs.
7 Hazard assessment
Table 3 Summary of typical rigid pavement defects and remote sensing methods for assessment
Distress Visible TLS Airplane Vehicle
Surface Cracking [5,6,61] [20] [6]
Durability Cracking [5,6,61] [6]
Cluster Cracking [5,6,61] [6]
Diagonal Cracking [5,6,61] [6]
Faulting [130] [130]
Spalling [61,141]
Punch-outs [141]
weathering; the use of remote sensing methods for assess-ing roads durassess-ing and after hazard events is relatively new. Remote sensing has been used for decades to detect and locate floods, forest fires, landslides, and many other haz-ards of varying type and spatial scale. It is also widely utilized to survey damage to buildings and infrastructure following disasters. The use of remote sensing to specifi-cally assess road damages and accessibility is a relatively new research agenda. While a functioning transportation network is essential in day-to-day life, it is particularly critical during and after hazard events. Information regard-ing accessibility or obstructed and damaged roadways and bridges is imperative for emergency responders. Natural hazards range in scale from localized landslides affecting a road segment to large regional events such as hurricanes or earthquakes. Because remote sensing methods can provide data with high spatial resolution as well as for inaccessible areas, these data may be used to provide valuable infor-mation for the detection and assessment of transportation networks.
Historically, pavement and structural damage from haz-ards were tested in the field. For example, undetected damage to pavements and roadbeds caused by extensive flooding after Hurricanes Katrina and Rita in Louisiana were evaluated using field techniques such as falling weight deflectometers to assess the structural integrity of road beds by comparing pre- and post-Pavement Condition Indices (PCI) [52, 154]. [29] cataloged road and bridge damages after Hurricane Ivan with photographs from the field.
Recent studies have focused on the application of remote sensing data after earthquakes or flooding to assess trans-portation networks. [16] used multi-sensor, multi-temporal imagery to identify flooded roads. [33] identified infrastruc-ture and road damage after the 2008 Wenchuan earthquake, using pre- and post-disaster very high resolution (VHR) optical imagery (1m or better). The combination of optical satellite imagery with a digital elevation model (DEM) to assess roads for accessibility after flooding was used to cre-ate a model for application in near-real time for emergency managers [38].
The evaluation and identification of transportation regions vulnerable to disruption is also important. LiDAR has been utilized to quantify slope movement and to predict and measure landslides as well as rockfall and other hazards and instabilities along roadways [30,70,116]. LiDAR has also been used with optical remote sensing images for post-hazard assessment of structural damage of buildings [98]. Satellite data are extremely useful for disaster assessment especially when before and after imagery is available for change detection [131].
Researchers are also studying new and innovative ways to optimize road assessments following natural disasters.13 This new research agenda, funded by the U.S. Department of Transportation, utilizes on-the-ground information culled from social media to identify possible areas of road damage. Once these areas are identified, commercial satellites can be tasked to collect information for designated regions.
8 Future directions
8.1 Traffic cameras
Traffic cameras may provide a possible new resource for gathering pavement data remotely. They are currently uti-lized by hundreds of cities in the US to provide real-time information regarding congestion and accidents. Additional or new pavement information could be taken by the cameras during periods of low traffic volume when roads are more visible. Currently, there has been no research investigating the use of traffic cameras for pavement assessment.
8.2 Volunteered geographic information
Volunteered geographic information (VGI) is a new and rapidly growing data source frequently available through social media. These data, which are voluntarily contributed and contain spatial and temporal information, harness the power of “humans as sensors” [46]. As a source of real-time,
on the ground data VGI has the potential to be a valu-able source for pavement monitoring. For example, systems which allow the public to report pavement defects, such as potholes, provide cities or municipalities with valuable, free information [63,80].
8.3 Ground data integration
Pavement management systems which concurrently employ ground and remote sensing data may provide the most effective way of assessing and managing the nation’s huge transportation infrastructure. Data fusion processes could be utilized to integrate multiple data sources, such as VGI, videos from traffic cameras, and ground data gathered by traditional methods, to increase accuracy and provide a more complete representation than what would be obtained from single data sources.
9 Conclusions
One of the most valuable, extensive, and important resources in the US and Europe is their roads. Assess-ment and monitoring is crucial to maintaining a safe and effective road system. There are multiple surface and sub-surface indicators of distress and defects which are observed using traditional, geotechnical engineering methods. While effective, many of these methods can be time consuming, laborious, destructive, costly, and provide information for only limited areas. The use of remote sensing techniques offers new potential for pavement managers to assess large areas, often in little time. Although remote sensing tech-niques can never entirely replace traditional geotechnical methods, they do provide an opportunity to reduce the num-ber or size of areas requiring site visits or manual methods. Employing remote sensing methods to evaluate pavement and transportation networks during and after natural or man-made disasters can also provide comprehensive information for emergency managers.
Acknowledgments Work performed under this project has been partially funded by the Office of Naval Research (ONR) award #N00014-14-1-0208 (PSU #171570).
Open Access This article is distributed under the terms of the Cre-ative Commons Attribution License which permits any use, distribu-tion, and reproduction in any medium, provided the original author(s) and the source are credited.
References
1. AASHTO (2009) Rough Roads Ahead: Fix Them Now or Pay for it Later. Joint publication of the American Association of State
Highway and Transportation Officials and National Transporta-tion Research Group, Washington, DC
2. Ahmed M, Haas C (2010) The potential of low cost close range photogrammetry towards unified automatic pavement dis-tress surveying. In: Transportation research board annual meeting 2010
3. Ahmed MF, Haas C, Haas R (2011) Accurate and less expen-sive pavement distress surveying using multi-photogrammetric-output fusion 2. In: Transportation Research Board 90th Annual Meeting, 11-4312
4. Al-Turk E, Uddin W (1999) Infrastructure inventory and condi-tion assessment using airborne laser terrain mapping and digital photography. Transp Res Rec J Transp Res Board 1690(1):121– 125
5. Amarasiri S, Gunaratne M, Sarkar S (2009) Modeling of crack depths in digital images of concrete pavements using optical reflection properties. J Transp Eng 136(6):489–499
6. Amarasiri S, Gunaratne M, Sarkar S, Nazef A (2010) Optical texture-based tools for monitoring pavement surface wear and cracks using digital images. Transp Res Rec J Transp Res Board 2153(1):130–140
7. Andreou C, Karathanassi V, Kolokoussis P (2011) Investiga-tion of hyperspectral remote sensing for mapping asphalt road conditions. Int J Remote Sens 32(21):6315–6333
8. AUSTROADS (1991) Road maintenance practice. Austroads, Sydney NSW 2000,www.austroads.com.au
9. Bell C (1989) Summary report on aging of asphalt-aggregate sys-tems. Strategic Highway Research Program Publication SHRP-A-305. Technical Report
10. Bendea H, Boccardo P, Dequal S, Giulio Tonolo F, Marenchino D, Piras M (2008) Low cost UAV for post-disaster assessment. In: Proceedings of the XXI congress of the international soci-ety for photogrammetry and remote sensing, Beijing (China), pp 3–11
11. Brooks C, Colling T, Kueber M, Roussi C (2011a) State of the practice of unpaved road condition assessment, Deliverable 2-A. In: Characterization of Unpaved Road Conditions Through the Use of Remote Sensing, Michigan Tech Transportation Institute
12. Brooks C, Colling T, Kueber M, Roussi CEA (2011b) Charac-terization of unpaved road conditions through the use of remote sensing deliverable 2-A: State of the Practice of Unpaved Road Condition Assessment
13. Brooks C, Colling T, Roussi C (2011c) Requirements for remote sensing assessments of unpaved road conditions, Deliverable 1-A: In: Characterization of Unpaved Road Conditions Through the Use of Remote Sensing, Michigan Tech Transportation Institute
14. Buck AD (1977) Recycled concrete as a source of aggregate. Am Concr Inst Mater J 74(5):212–219
15. Bungey J (2004) Sub-surface radar testing of concrete: a review. Constr Build Mater 18(1):1–8
16. Butenuth M, Frey D, Nielsen A, Skriver H (2011) Infrastruc-ture assessment for disaster management using multi-sensor and multi-temporal remote sensing imagery. Int J Remote Sens 32(23):8575–8594
17. Canny J (1986) A computational approach to edge detection. IEEE Trans Pattern Anal Mach Intell 6:679–698
18. Chambon S, Moliard JM (2011) Automatic road pavement assessment with image processing: review and comparison. Inter-national Journal Geophysics, 2011
20. Chen S, Rice C, Boyle C, Hauser E (2011) Small-format aerial photography for highway-bridge monitoring. J Perform Constr Facil 25(2):105–112
21. Chen X, Wang D (2011) Fractal and spectral analysis of aggre-gate surface profile in polishing process. Wear 271(11):2746– 2750
22. Chou C, McCullough BF (1987) Development of a distress index and rehabilitation criteria for continuously reinforced concrete pavements using discriminant analysis. Transportation Research Record (1117)
23. Clark M, McCann D, Forde M (2003) Application of infrared thermography to the non-destructive testing of concrete and masonry bridges. NDT E Int 36(4):265–275
24. Clark R et al (1999) Spectroscopy of rocks and minerals, and principles of spectroscopy. Man Remote Sens 3:3–58
25. Cline G, Shahin M, Burkhalter J (2003) Automated data collec-tion for pavement condicollec-tion index survey. In: Annual meeting of Transportation Research Board
26. CSIR (1986) Standard nomenclature and methods for describing the condition of jointed concrete pavements, TRH9. Council for Scientific and Industrial Research, Pretoria
27. CSRA (1985) Nomenclature and methods for describing the con-dition of asphalt pavements, TRH6. Committee of State Road Authorities, Pretoria
28. Diefenderfer B, Mokarem D, Sharp S (2006) Use of nondestruc-tive evaluation to detect moisture in flexible pavements 29. Douglass S, Hughes S, Rogers S, Chen Q (2004) The impact
of Hurricane Ivan on the coastal roads of Florida and Alabama: a preliminary report. Mobile, Alabama: University of South Alabama, Coastal Transportation Engineering Research & Edu-cation Center, 19p
30. Duffell C, Rudrum D (2005) Remote sensing techniques for highway earthworks assessment. Proceedings, Geo-Frontiers, p 2005
31. Dumoulin J, Ibos L, Marchetti M, Mazioud A (2011) Detection of non emergent defects in asphalt pavement samples by long pulse and pulse phase infrared thermography. Eur J Environ Civil Eng 15(4):557–574
32. Edil TB, Benson CH, Bin-Shafique MS, Tanyu BF, Kim WH, Senol A (2002) Field evaluation of construction alternatives for roadways over soft subgrade. J Transp Res Board 1786:36–48 33. Ehrlich D, Guo H, Molch K, Ma J, Pesaresi M (2009) Identifying
damage caused by the 2008 Wenchuan earthquake from VHR remote sensing data. Int J Digit Earth 2(4):309–326
34. Faiz A, Yoder EJ (1974) Factors influencing the performance of continuously reinforced concrete pavements. Transportation Research Record (485)
35. Feng W, Yundong W, Qiang Z (2009) UAV borne real-time road mapping system. In: Urban Remote Sensing Event, 2009 Joint. IEEE, pp 1–7
36. FHWA (1984) Construction handbook on PCC pavement reha-bilitation. US Department of Transportation, Federal Highway Administration
37. Forest R, Utsi V (2004) Non destructive crack depth measure-ments with ground penetrating radar. In: Ground Penetrating Radar, 2004. GPR 2004. Proceedings of the Tenth International Conference on. IEEE, pp 799–802
38. Frey D, Butenuth M (2011) Trafficability analysis after flooding in urban areas using probabilistic graphical models. In: Urban Remote Sensing Event (JURSE), 2011 Joint. IEEE, pp 345– 348
39. Fu P, Harvey JT, Lee JN, Vacura P (2011) New method for classifying and quantifying cracking of flexible pavements in automated pavement condition survey. Trans Res Rec: J Trans Res Board 2225(1):99–108
40. Fukuhara T, Terada K, Nagao M, Kasahara A, Ichihashi S (1990) Automatic pavement-distress-survey system. J Trans Eng 116(3):280–286
41. Fwa TF (2006) The Handbook of Highway Engineering. CRC Press, Taylor
42. Georgopoulos A, Loizos A, Flouda A (1995) Digital image pro-cessing as a tool for pavement distress evaluation. ISPRS J Photogramm Remote Sens 50(1):23–33
43. Giroud JP, Noiray L (1981) Geotextile-reinforced unpaved road design. J Geotech Eng Div 107(9):1233–1254
44. Giummarra G et al (2000) Unsealed Roads Manual: Guidelines to Good Practice, USR001. Australian Road Research Board, Transport Research, Vermont South
45. Gomez R (2002) Hyperspectral imaging: a useful technology for transportation analysis. Opt Eng 41(9):2137–2143
46. Goodchild M (2007) Citizens as sensors: the world of volun-teered geography. GeoJournal 69(4):211–221
47. Gramling W (1994) Current practices for determining pave-ment condition. National Cooperative Highway Research Pro-gram (NCHRP), Synthesis 203. Transportation Research Board Publication
48. Green R, Eastwood M, Sarture C, Chrien T, Aronsson M, Chippendale B, Faust J, Pavri B, Chovit C, Solis M et al (1998) Imaging spectroscopy and the airborne visible/infrared imaging spectrometer (AVIRIS). Remote Sens Environ 65(3):227–248 49. Grote K, Hubbard S, Harvey J, Rubin Y (2005) Evaluation of
infiltration in layered pavements using surface GPR reflection techniques. J Appl Geophys 57(2):129–153
50. Halliday D, Resnick R, Walker J (2010) Fundamentals of physics extended. Wiley
51. Heitzman M, Maser K, Tran NH, Brown R, Bell H, Holland S, Ceylan H, Belli K, Hiltunen D (2013) Nondestructive Testing to Identify Delaminations between HMA Layers, SHRP 2 Report S2-R06D-RR-1. Technical Report
52. Helali K, Eng P, Robson M, Nicholson R, Bekheet W (2008) Importance of a pavement management system in assessing pave-ment damage from natural disasters: a case study to assess the damage from Hurricanes Katrina and Rita in Jefferson Parish, Louisiana. In: 7th International Conference on Managing Pave-ment Assets
53. Herold M, Roberts D (2005) Spectral characteristics of asphalt road aging and deterioration: implications for remote-sensing applications. Appl Opt 44(20):4327–4334
54. Herold M, Gardner M, Noronha V, Roberts D (2003) Spectrome-try and hyperspectral remote sensing of urban road infrastructure. Online Journal of Space Communications 3
55. Herold M, Roberts D, Gardner M, Dennison P (2004) Spectrom-etry for urban area remote sensing—Development and analysis of a spectral library from 350 to 2400 nm. Remote Sens Environ 91(3):304–319
56. Herold M, Roberts D, Noronha V, Smadi O (2008) Imaging spectrometry and asphalt road surveys. Trans Res Part C: Emerg Technol 16(2):153–166
57. Hicks R, Mahoney J (1981) Collection and use of pavement condition data. NCHRP Synth 76:1–25
58. Hu M (1962) Visual pattern recognition by moment invariants. Inf Theory, IRE Trans 8(2):179–187
59. Huang Y, Hempel P, Copenhaver T (2011) Texas Department of Transportation 3D transverse profiling system for high speed rut measurement Journal of Infrastructure Systems
60. Huang YH (1993) Pavement Analysis and Design. Prentice Hall Publication