O R I G I N A L A R T I C L E
Detection of decay damage in iron-wood living trees
by nondestructive techniques
Cheng-Jung Lin1•Yue-Hsing Huang2•Gwo-Shyong Huang1•Meng-Ling Wu3
Received: 9 July 2015 / Accepted: 27 September 2015 / Published online: 23 October 2015
ÓThe Japan Wood Research Society 2015
Abstract The purpose of this study was to investigate the standard values of living, undamaged iron-wood ( Casuar-ina equisetifolia) trees by different nondestructive tech-niques. This study also detects the transversal stress wave velocity (V) and tomogram, and resolves corresponding Vmaps of the trees with and without decay damage. First, a visual tree inspection form with seven categories of tree defects is proposed for tree hazard assessment. The range of demarcation between decay-damaged and sound wood occurred at an approximate V of 1461–1636 m/s by transversal stress wave velocity tomography. Different nondestructive evaluation parameters can serve as an index for diagnosing standard values (with or without decay). A positive significant relationship was found between the diameter and transversal minimumVof 2D in undamaged trees. Moreover, the product diameter9frequency of evaluated value by lateral impact vibration method tended to increase with increasing minimum V of 2D using tomography in undamaged and decay-damaged trees. Decay damage in iron-wood living trees could be inspected and detected by lateral impact vibration method and transversal stress wave velocity tomography for the general location and area of wood deterioration.
Keywords Stress wave velocityTree risk assessment Visual tree inspection Nondestructive technique Tomogram
Introduction
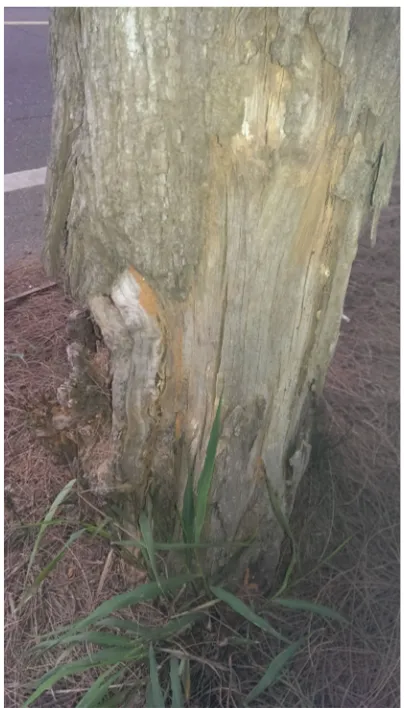
The iron-wood (Casuarina equisetifolia) tree is a common landscape tree near seacoast in Taiwan. This type of tree often plants along both sides of the road for windbreak tree or protect forest. These trees growing on the roadside suffer from man-made and natural decay damage (Fig. 1), and often fall without warning. This could lead to risk of human casualties or result in property loss.
Concerns about public safety and urban tree conserva-tion strongly support the development and applicaconserva-tion of rapid, precise, and cost efficient diagnostic techniques to detect decay and other types of structural defects in trees [1]. Standing trees must be evaluated to maintain in situ structural safety for tree risk assessment. Various nonde-structive techniques (NDT) have been applied to detect decay and deterioration in trees to identify hazardous trees. NDT is the science of identifying the physical and mechanical properties of a piece of material without altering its end-use capabilities and then using this infor-mation to make decisions regarding appropriate applica-tions [2]. Visual tree assessment, a systematic method of tree assessment using biological and biomechanical indi-cators to evaluate overall vitality and structural integrity of a tree, includes visual inspection of the tree to look for external evidence of internal defects, instrumental mea-surements of internal defects and evaluation of the residual strength of the wood [3]. Arboriculturists consider visual tree assessment (i.e., structural defects) an essential prac-tice. This kind of assessment serves as the starting point for & Cheng-Jung Lin
1 Forest Utilization Division, Taiwan Forestry Research
Institute, 53 Nanhai Rd., Taipei 10066, Taiwan
2 Taiwan Forestry Research Institute, 53 Nanhai Rd.,
Taipei 10066, Taiwan
3 Forest Protection Division, Taiwan Forestry Research
evaluating tree defects and providing basic information about tree growth performance and stability. Tree breakage depends on many features of the tree, including its height, width of crown, crown architecture, crown density in the branching and leaves, form, condition, physical wood properties, and species [4].
Stress wave or ultrasonic velocity evaluation measure-ments of wood have proven to be effective parameters for detecting and estimating deterioration in tree trunk and wood structures [2, 5]. NDT have been developed for tomographic investigation [6]. Stress wave or ultrasonic tomographic measurements in wood have been found to be effective in detecting and estimating decay in tree trunks [1,7–15]. Stress wave or ultrasonic tomography has been proven to be the most effective technique for detecting internal decay, locating the position of defects, and esti-mating their size, shape and characteristics. In addition, because the location of decay is more important in terms of strength loss than just the size of the area of decay, stress wave or ultrasonic tomography allows specialist to deter-mine relative strength loss [16].
A fractometer is a device that breaks the radial incre-ment core along the direction of the fiber to measure the fracture strength [17]. Many diagnostic devices such as resistographs, stress wave or ultrasonic detectors, electrical conductivity meters and fractometers are available for detecting internal decay and other defects in living trees [18]. These NDT can be used in combination to achieve better accuracy in determining the location and extent of wood deterioration.
No detailed reports have been published about detecting wood decay damage in iron-wood (Casuarina equisetifo-lia) living trees by different nondestructive techniques. Therefore, the first objective of this study was to detect the evaluation parameters of living, undamaged (without decay) iron-wood trees by stress wave velocity tomogra-phy, lateral impact vibration, fractometer, and density profile techniques. We also generated tables of standard values (references) to aid in the use of these methods in wood deterioration surveys. A secondary objective was carried out to investigate transversal stress wave velocity tomogram (VT) and resolve corresponding stress wave velocity (V) maps of iron-wood trees with decay damage to understand the degree and extent of trunk deterioration for tree risk assessment.
Materials and methods
First, the experiment was carried out in situ on 34 sound iron-wood trees in Miaoli county (18 sampled trees) and Tanyuan city (16 sampled trees), Taiwan. These trees were inspected in December, 2014, when the trees were about 30–50 years old with average diameters at breast height (DBHs) of 39.2 cm. Multiple stress wave measurements (Fakopp enterprise, Agfalva, Hungary) were carried out at eight equidistant points (eight probes) along the circum-ference of the trunks. All sensors were located in the trees at about 130 cm above ground and the transducer was connected at an angle of 90°to the trunk axis to detect the propagated travel time and stress wave velocities. The transmitter probe was first positioned at point 1 with stress wave pulses acquired by the receiver probe at the other seven points. Hammer tapping was done from points 1 to 8, respectively. Measurements were repeated with the trans-mitter probe positioned at each point, thus giving 28 [for a complete round trip: 7 receiving probes 98 transmitter probes 7 2 (the same path was measured twice)] inde-pendent propagation time measurements for each investi-gated section. A complete data matrix was obtained through this measurement process at each test location.
The circumference of each cross section and the dis-tances between sensors were measured using a tape mea-sure. These measurements served as inputs for the system
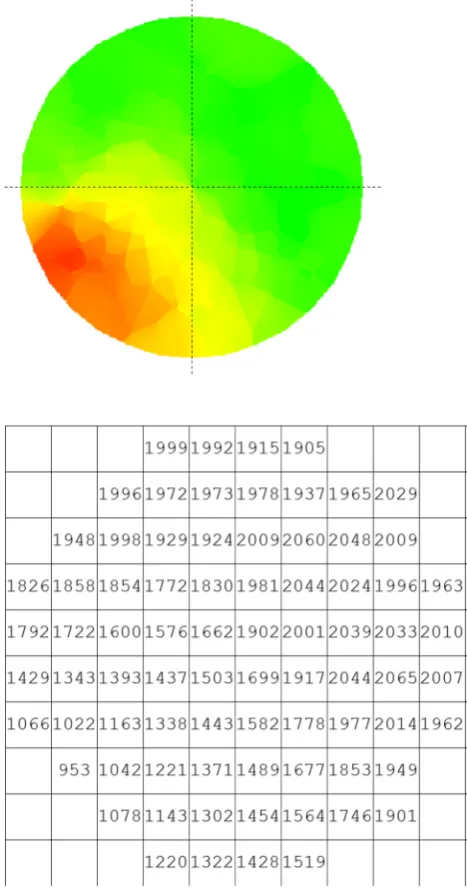
software to map the approximate geometric form of the cross sections. First, upon completing stress wave velocity measurements, a tomogram was constructed for each cross section using the ArborSonic software. Second, due to differences in species and paths, a two-dimensional (2D) image was obtained using the above software based on original stress wave transmission times (no adjusted and regularized times) to help better understand the experi-mental values in this study. To quantitatively assess the tomograms, all corresponding stress wave velocities were further calculated at each pixel of the tomogram were further calculated by visualizing and converting the tomograms to yield stress wave velocity maps of the cross sections (e.g., Figs.2,3).
After the stress wave velocity information of each cross section provided by the tomograms was tabulated, the resonant frequencies were measured using a portable lat-eral impact vibration meter (Ponta, World Enterprise, Japan) to diagnose the wood quality inside a standing tree. The product D9F (m Hz) of the resonance frequency Fof the vibration or the sound of an impacted tree trunk and the trunk diameterDserve as the diagnosis index.
Finally, 5-mm diameter cores were cut from the trunk using an increment borer. A fractometer was used to evaluate the crushing strength of core samples (in green state) in the bark to the pith direction at an interval of 6 mm. Finally, a core specimen was mounted and pro-cessed into slices (wideness9thickness=1792.0 mm) for X-ray densitometric scanning. The conditioned slices (air-dried) were subjected to a direct-reading X-ray den-sitometer (QTRS-01X Tree Ring Analyzer, Quintek Mea-surement Systems (QMS), Knoxville, TN, USA) to determine the tree ring (wood) density profile. Table1 summarizes these nondestructive evaluation methods used for tree assessment in this experiment.
The experiment was also carried out in situ on 15 dif-ferent decay-damaged iron-wood street trees (trees planted along both sides of the road) in Miaoli county (ten sampled trees) and Tanyuan city (five sampled trees), Taiwan. These trees were investigated in December, 2014, when the trees were about 30–50 years old with DBHs of 42.2 cm. Tree trunk deterioration was detected by stress wave velocity tomography (using the same method described above). After the stress wave velocity tomography infor-mation (2D image) of each cross section provided by the tomogram was tabulated, the sampling core method was conducted using an increment corer to understand the wood deterioration (with or without decay damage) by the visual method. Finally, the resonant frequencies were measured using a portable lateral impact vibration meter to diagnose the living tree and the productD9F(m Hz) serve as the diagnosis index (as described above).
Results
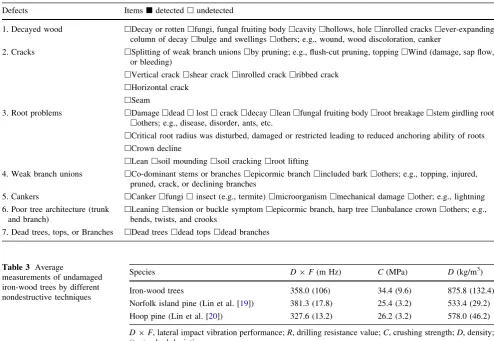
Seven categories of tree defects and appearance were inspected by the visual tree inspection form (Table 2). The seven main defects were decayed wood, cracks, root problems, weak branch unions, cankers, poor tree archi-tecture (trunk and branch), and dead trees, tops, or bran-ches. First, the iron-wood trees were inspected visually, focusing on different decay-damaged trees.
The evaluated parameters of different nondestructive techniques, including the average lateral impact vibration performance, green crushing strength, and air-dried wood density were 358.0 m Hz, 34.4 MPa, and 875.8 kg/m3, respectively (Table3). The lateral impact vibration per-formance, green crushing strength, and air-dried wood density of a normal undamaged tree stem serves as the index of diagnosis or standard reference value.
The average minimum and maximum stress wave velocity (VminandVmax) values were 1636 and 2539 m/s
for the 24 undamaged iron-wood trees, respectively (Table4). The mean stress wave velocity (Vmean) of the
tomogram was 2087 m/s. The VminandVmax values were
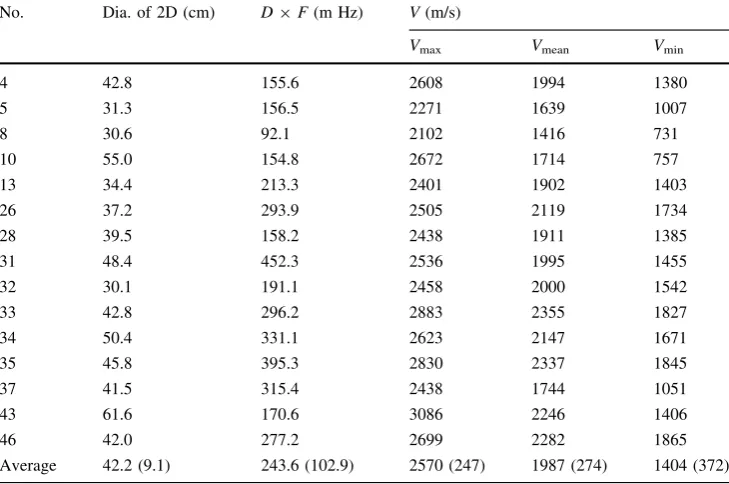
1404 and 2570 m/s for the 15 decay-damaged iron-wood trees, respectively (Table5). The Vmean of the tomogram
was 1987 m/s. AverageVminvalue of the trunks in
decay-damaged trees (Table5) was clearly lower than that of the undamaged trees (Table4). TheVminvalue (1636 m/s) can
be considered as the threshold values of diagnosis by stress wave velocity tomogram.
The VT and correspondingVvalue maps were examined for the 34 undamaged and 15 decay-damaged iron-wood trees (Figs.2, 3). The sampling core method was con-ducted using an increment corer to understand the wood deterioration. None of the tomograms of the undamaged iron-wood trees displayed a distinct pattern of high and low V in the cross section of the stem (Fig.2). However, all tomograms of the decay-damaged iron-wood trees dis-played a distinct pattern of highV(undamaged wood area) and low V (decay-damaged wood area) at the stem perimeter or center (Fig.3). The standard deviation values of Vminin decayed damaged trees (Table5) were clearly
higher than that of undamaged trees (Table4).
The relationships between transversal stress wave velocities (Vmin,Vmax, andVmean) with the 2D diameters of
undamaged iron-wood trees are shown in Fig.4. TheVmin, Vmax, andVmeanvalues generally increased with increasing
diameter values. When expressed as the linear regression relationships, the determined coefficients (R2) were 0.65–0.75. Statistical analysis showed that the relationships between stress wave velocity and diameter values were significant at 0.01 levels. This result shows that theseVmin
increasing diameter (about 20–60 cm). Different diameter classes of tree affected theVmin,Vmax,Vmeanof tomogram.
TheVminvalue can be considered as the threshold value of
diagnosis by stress wave velocity tomography, and the Vvalue was affected by diameter. Therefore, theV thresh-old value should be adjusted with the 2D diameter values.
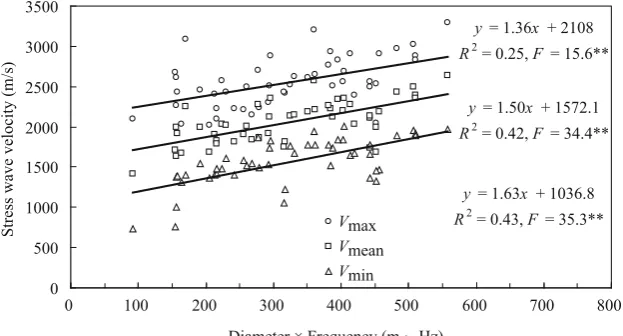
The relationship between the diameter9frequency (D9Fvalue, lateral impact vibration performance, m Hz) and the stress wave velocity (Vmin,Vmax, andVmean) values
(m/s) of tomogram in undamaged and damaged trunk cross section is presented in Fig.5. TheD9Fvalues generally increased with increasing stress wave velocity (Vmin,Vmax,
Fig. 2 Stress wave velocity tomogram and the
andVmean) values. When expressed as the linear regression
relationships, the determined coefficients (R2) were 0.25–0.43. Statistical analysis showed the relationships
betweenD9Fand stress wave velocity (Vmin,Vmax, and Vmean) values were significant at 0.01 levels. The result
displayed that theD9Fvalue of lateral impact vibration performance in undamaged or damaged living trees serves as the index of diagnosis for general soundness or pre-liminary decay status. Moreover, the stress wave velocity tomogram and the corresponding stress wave velocity maps of decay-damaged and undamaged iron-wood tree can detect the general location and area of wood deterioration.
Discussion
The average transversal stress wave velocity (V), lateral impact vibration performance (D9F), green crushing strength (C), and air-dried wood density (D) of a normal undamaged tree stem serves as the diagnosis index or standard reference value. We present a table of standard values for the future use of these device or methods for testing iron-wood trees. The D9F, C, and D values of three tree species are compared and displayed in Table3 for comparison [19,20]. The average Vminvalues of
iron-wood, Norfolk island pine, and hoop pine trees are 1636, 1129–1296, and 1154–1164 m/s, respectively. If detected values of nondestructive evaluation are lower than these reference values, the wood quality of the trunk show brings up questions which could require further investigation.
In this study, lower transversal stress wave velocities (map grids) were observed inside of the decay-damaged trees. Severe wood decay defects in have been reported when the stress wave velocity is reduced to 70 % of the characteristic values of sound wood [21]. In this study, the Vmeanvalue in the undamaged trees was 2087 m/s with the
threshold at 1461 m/s (2087 90.7 m/s). Moreover, the average Vmin value of the tomogram in the undamaged
trees was 1636 m/s. Therefore, the range of Vmin values
(1461–1636 m/s) can be considered as the threshold values for diagnosis by stress wave velocity tomogram. Further-more, the range of demarcation between decay-damaged and undamaged wood occurred at an approximate transversal stress wave velocity of 1461–1636 m/s. The reduction in stress wave velocity is indicative of serious damage, the location and extent of which can be seen in the
Fig. 3 Stress wave velocity tomogram and the corresponding stress wave velocity map grids (393 cm) of a damaged tree (no. 8, velocity range, 731–2102 m/s)
Table 1 Assessment of standard values (reference) in sound trees by different nondestructive techniques for tree hazard assessment
Item Methods Evaluated parameter
1 Visual tree inspection Tree inspection form
map grids. The decay-damaged tree had a lower average and individual stress wave velocities compared with the undamaged tree.
Some studies have reported that a stress wave or ultra-sonic tomogram cannot precisely evaluate the extent and location of decay or the type of defect [7,9,12–14]. For example, a stress wave and ultrasonic tomogram underes-timates the internal decay and overesunderes-timates that in the periphery of the trunk. Therefore, to make better assess-ments of internal conditions and decay of trees, other more effective methods (e.g., visual drawings of the increment core, drilling resistance and use of a fractometer) should also be adopted in combination to enhance the accuracy of the information. For example, a drilling resistance tech-nique or increment core method can be applied to deter-mine the position and nature of a defect for proof [1,9,13, 14,22].
In-depth tree assessments are warranted when a tree poses a high degree of risk to public safety and exhibits defects that cannot be fully evaluated by visual inspection [23]. However, micro-destructive methods can destroy the compartmentalization zone and break the existing barrier
zone within the tree, allowing decay to spread into healthy wood. Therefore, when using decay detection devices, the number of drill holes or sensor sites for collecting the required critical field data should be kept to a minimum [9]. A larger thickness of the peripheral region and a higher ratio of peripheral wood toward the trunk base have sig-nificant implications for the tree structure and safety (sound and health). When iron-wood trees have trunk decay, deterioration or hazardous defects, the residual wall thickness (shell) and wood quality have been found to be marginally sufficient. Most experts [3,23–25] agree that a ratio of 30–35 % of sound wood in the remaining wall is the threshold beyond which some action should be taken.
The transversal stress wave velocity values tended to increase with increasing diameter in this study (Fig.4). In this experiment, transversal stress wave velocity was detected by eight fixed probes along the circumference on the trunks. The properties (quality) and thickness (residual wall) of the peripheral wood in a tree is very important for the tree’s structural safety and hazard evaluation. Gener-ally, larger diameter trees with larger crowns need greater support while the trunks of smaller diameter trees with
Table 2 Visual tree inspection form with seven categories of tree defects
Defects Itemsjdetectedhundetected
1. Decayed wood hDecay or rottenhfungi, fungal fruiting bodyhcavityhhollows, holehinrolled crackshever-expanding column of decayhbulge and swellingshothers; e.g., wound, wood discoloration, canker
2. Cracks hSplitting of weak branch unionshby pruning; e.g., flush-cut pruning, toppinghWind (damage, sap flow, or bleeding)
hVertical crackhshear crackhinrolled crackhribbed crack hHorizontal crack
hSeam
3. Root problems hDamagehdeadhlosthcrackhdecayhleanhfungal fruiting bodyhroot breakagehstem girdling root hothers; e.g., disease, disorder, ants, etc.
hCritical root radius was disturbed, damaged or restricted leading to reduced anchoring ability of roots hCrown decline
hLeanhsoil moundinghsoil crackinghroot lifting
4. Weak branch unions hCo-dominant stems or brancheshepicormic branchhincluded barkhothers; e.g., topping, injured, pruned, crack, or declining branches
5. Cankers hCankerhfungihinsect (e.g., termite)hmicroorganismhmechanical damagehother; e.g., lightning 6. Poor tree architecture (trunk
and branch)
hLeaninghtension or buckle symptomhepicormic branch, harp treehunbalance crownhothers; e.g., bends, twists, and crooks
7. Dead trees, tops, or Branches hDead treeshdead topshdead branches
Table 3 Average
measurements of undamaged iron-wood trees by different nondestructive techniques
Species D9F(m Hz) C(MPa) D(kg/m3)
Iron-wood trees 358.0 (106) 34.4 (9.6) 875.8 (132.4) Norfolk island pine (Lin et al. [19]) 381.3 (17.8) 25.4 (3.2) 533.4 (29.2)
Hoop pine (Lin et al. [20]) 327.6 (13.2) 26.2 (3.2) 578.0 (46.2)
smaller crowns needs to withstand smaller forces. The own (dead) weight and crown volume of the larger diameter class were larger than those of the smaller diameter class in tree. The most important and most dangerous load on the trees is undoubtedly that created by wind, which can introduce bending stresses near the periphery of the stem [26]. Previous researches has indicated that theVmaxvalues
of lean Norfolk island pine and lean hoop pine trees are than those of normal non-leaning trees [13, 14]. The leaning of a tree could result in reaction wood or larger
gravity effects in the trunk of the tree. However, the V values of the cross section are totally influenced by the distribution of the cell structure, reaction wood, gravity, own weight, and other factors (i.e., combined action) in the tree. This might limit the application of stress wave velocity tomography. Further research is needed to clarify the intensities of individual factors in the future.
In this experiment, the D9F values generally increased with increasing stress wave velocity (Vmin,Vmax,
and Vmean) values. The D9F value of lateral impact
Table 4 Transversal stress wave velocities (V) of undamaged iron-wood trees (N=34)
No. Dia. of 2D (cm) D9F(m Hz) V(m/s)
Vmax Vmean Vmin
1 24.2 317.9 2421 1820 1219
2 22.0 206.0 2015 1688 1361
3 36.0 451.8 2045 1687 1330
6 41.0 443.2 2109 1737 1365
7 48.6 402.7 2558 2198 1839
9 41.0 443.2 2565 2113 1662
11 60.6 360.6 3205 2571 1937
12 41.5 351.1 2614 2193 1773
14 29.5 292.1 2298 1914 1531
15 26.2 241.4 2221 1809 1398
16 37.7 324.4 2523 2140 1757
17 40.2 361.8 2656 2214 1772
18 33.1 261.0 2495 2006 1517
19 33.4 223.1 2574 2027 1481
20 31.6 230.4 2438 2022 1607
21 27.5 215.9 2231 1821 1412
22 29.3 278.6 2239 1864 1490
23 30.6 255.7 2216 1899 1583
24 25.2 216.7 2098 1791 1485
25 39.3 388.3 2510 2125 1741
27 61.1 405.1 2695 2353 2012
29 50.9 507.0 3028 2490 1952
30 48.4 457.4 2910 2190 1471
36 44.1 510.0 2888 2399 1911
38 43.5 413.3 2914 2280 1646
39 49.7 482.6 2971 2430 1890
40 40.0 384.8 2936 2226 1516
41 21.4 164.5 2028 1672 1316
42 40.7 420.4 2392 2033 1675
44 45.8 510.0 2830 2358 1886
45 54.2 558.3 3299 2635 1971
47 37.2 381.3 2765 2271 1778
48 42.3 442.9 2497 2137 1778
49 29.0 267.8 2144 1845 1547
Average 39.2 (9.5) 358.0 (105.6) 2539 (348) 2087 (265) 1636 (218)
rc, crushing strength; Vmin, minimum stress wave velocity; Vmean, mean stress wave velocity; Vmax,
vibration performance in living trees serves as the index of diagnosis. Moreover, the stress wave velocity tomogram of iron-wood living tree can detect the general location and area of wood deterioration. Therefore, first, this experiment suggests that the tree hazard assessment could be inspected by visual tree defects inspection. Then, general soundness or preliminary decay status could be detected by faster lateral impact vibration method. Second, the general location and area of wood deterioration could be used by transversal stress wave velocity tomography. Finally, the proposed approach can be combined with other non-de-structive techniques to better examine and confirm the situations of trees.
Conclusions
A visual tree inspection form with seven categories of tree defects is proposed for tree hazard assessment in this study. The average transversal stress wave velocities were 1636–2539 m/s for undamaged iron-wood trees. Moreover, the average lateral impact vibration performance, green crushing strength, and air-dried wood density were 358.0 m Hz, 34.4 MPa, and 875.8 kg/m3, respectively. Different nondestructive evaluated parameters could serve as the index of the diagnosis value. A table of standard values for the future use of these nondestructive methods for testing iron-wood trees with and without decay damage y = 27.084x + 1498.1
R2 = 0.65, F = 58.7**
y = 22.13x + 1236.4
R2 = 0.75, F = 94.1**
y = 17.173x + 975.49
R2 = 0.66, F = 63.4**
0 500 1000 1500 2000 2500 3000 3500
0 10 20 30 40 50 60 70
Diameter of 2D (cm)
Stress wave velocity (m/s)
Vmax Vmean Vmin
Fig. 4 Relationships between the trunk diameter and the transversal stress wave velocities of the tomogram in undamaged trees (Vmax maximum stress wave velocity, Vmean, mean stress wave
velocity,Vminminimum stress wave velocity of the tomogram)
Table 5 Transversal stress wave velocities (V) of different decay-damaged iron-wood trees (N=15)
No. Dia. of 2D (cm) D9F(m Hz) V(m/s)
Vmax Vmean Vmin
4 42.8 155.6 2608 1994 1380
5 31.3 156.5 2271 1639 1007
8 30.6 92.1 2102 1416 731
10 55.0 154.8 2672 1714 757
13 34.4 213.3 2401 1902 1403
26 37.2 293.9 2505 2119 1734
28 39.5 158.2 2438 1911 1385
31 48.4 452.3 2536 1995 1455
32 30.1 191.1 2458 2000 1542
33 42.8 296.2 2883 2355 1827
34 50.4 331.1 2623 2147 1671
35 45.8 395.3 2830 2337 1845
37 41.5 315.4 2438 1744 1051
43 61.6 170.6 3086 2246 1406
46 42.0 277.2 2699 2282 1865
Average 42.2 (9.1) 243.6 (102.9) 2570 (247) 1987 (274) 1404 (372)
Vmin, minimum stress wave velocity; Vmean, mean stress wave velocity; Vmax, maximum stress wave
is presented. AverageVminvalues of the trunks in
decay-damaged trees were clearly lower than those of sound trees. The stress wave velocity tomogram and corresponding stress wave velocity maps of decay-damaged and undam-aged iron-wood tree can detect the general location and area of wood deterioration. Moreover, general soundness or preliminary decay status could be detected by faster lateral impact vibration method. The range of demarcation between decay-damaged and undamaged wood occurred at an approximate transversal stress wave velocity of 1461–1636 m/s. The stress wave velocity (Vmin,Vmax, and Vmean) values increased with increasing diameter in sound
trees, and the relationships could be represented by positive linear regression formulas. The Vminand diameter values
were 1300–2000 m/s and 20–60 cm in undamaged trees, respectively. These values can be considered as the threshold values of diagnosis by stress wave velocity tomography. The proposed approach can be combined with other non-destructive techniques to better examine and confirm the situations of trees.
Acknowledgments The authors wish to thank the Experimental Forest, National Taiwan University and Taiwan Forestry Research Institute for financial support.
References
1. Wang X, Allison RB (2008) Decay detection in red oak trees using a combination of visual inspection, acoustic testing, and resistance microdrilling. Arboric Urban For 34:1–4
2. Pellerin RF, Ross RJ (2002) Nondestructive evaluation of wood. For Prod Soc, Madison, pp 150–200
3. Matheny NP, Clark JR (1994) A photographic guide to the evaluation of hazard trees in urban areas. Int Soc Arboric Champaign, IL, p 85
4. Gruber F (2008) Untenable failure criteria for trees: 1. The residual shell wall thickness rule. Arboric J 31:5–18
5. Lin CJ, Chiu CM, Wang SY (2000) Application of ultrasound in detecting wood decay in squirrel-damaged standing trees of Luanta China fir. Taiwan J For Sci 15:267–279
6. Rinn F (1999) Device for investigation materials. US-Patent US6813948; international Patent PCT/DE00/01467 (1999.05.11). (Basic patent describing sonic tomography)
7. Gilbert E, Smiley ET (2004) Picus sonic tomography for the quantification of decay in white oak (Quercus alba) and hickory (Caryaspp.). Arboric J 30:277–281
8. Bucur V (2005) Ultrasonic techniques for nondestructive testing of standing trees. Ultrasonics 43:237–239
9. Wang X, Allison RB, Wang L, Ross RJ (2007) Acoustic tomography for decay detection in red oak trees. Research Paper FPL-RP-642. US Department of Agriculture, Madison
10. Deflorio G, Fink S, Schwarze FWM (2008) Detection of incipient decay in tree stems with sonic tomography after wounding and fungal inoculation. Wood Sci Technol 42:117–132
11. Lin CJ, Kao YC, Lin TT, Tsai MJ, Wang SY, Lin LD, Wang YN, Chan MH (2008) Application of an ultrasonic tomographic technique for detecting defects in standing trees. Int Biodeterior Biodegrad 43:237–239
12. Wang X, Wiedenbeck J, Liang S (2009) Acoustic tomography for decay detection in black cherry trees. Wood Fiber Sci 41:127–137
13. Lin CJ, Chang TT, Juan MY, Lin TT (2011) Detecting deterio-ration in royal palm (Roystonea regia) using ultrasonic tomo-graphic and resistance microdrilling techniques. J Trop For Sci 23:260–270
14. Lin CJ, Chang TT, Juan MY, Lin TT, Tseng CL, Wang YN, Tsai MJ (2011) Stress wave tomography for the quantification of artificial hole detection in camphor trees (Cinnamomum cam-phora). Taiwan J For Sci 26:17–32
15. Lin CJ, Chung CH, Wu ML, Cho CL (2013) Detection of Phellinus noxiusdecay inSterculia foetidatree. J Trop For Sci 25(4):487–496
16. Rinn F (2011) Basic aspects of mechanical stability of tree cross-sections. Arborist News, pp 52–54
17. Lin CJ, Wang SY, Chiu CM (2007) Crushing strength sampling with minimal damage to taiwania (Taiwania cryptomerioides) using a fractometer. Wood Fiber Sci 39:39–47
18. Larsson B, Bengtsson B, Gustafsson M (2004) Nondestructive detection of decay in living trees. Tree Physiol 24:853–858 19. Lin CJ, Huang YH, Huang GS, Wu ML (2015) Detection and
evaluation of termite damage in Norfolk island pine (Araucaria heterophylla) trees by nondestructive techniques. J Exp For Nat Taiwan Univ 29:79–90
y = 1.63x + 1036.8 R2 = 0.43, F = 35.3**
y = 1.50x + 1572.1 R2 = 0.42, F = 34.4**
y = 1.36x + 2108 R2 = 0.25, F = 15.6**
0 500 1000 1500 2000 2500 3000 3500
0 100 200 300 400 500 600 700 800 Diameter × Frequency (m Hz)
Stress wave velocity (m/s) Vmax
Vmean Vmin
20. Lin CJ, Huang YH, Huang GS, Wu ML, Yang TH (2015) Detection of termite damage in hoop pine (Araucaria cunning-hamii) trees by nondestructive techniques. J Trop For Sci (in press)
21. Bethge K, Mattheck C, Hunger E (1996) Equipment for detection and evaluation of incipient decay in trees. Arboric J 20:13–37 22. Wang X, Wiedenbeck J, Ross RJ, Forsman JW, Erickson JR,
Pilon C, Brashaw B (2005) Nondestructive evaluation of incipi-ent decay in hardwood logs. General Technical Report FPL-GTR-162. US Department of Agriculture, Madison
23. Pokorny JD (1992) Urban tree risk management: a community guide to program design and implementation. USDA Forest Service Northeastern Area State and Private Forestry, St. Paul 24. Harris RW, Clark JR, Matheny NP (2004) Arboriculture:
inte-grated management of landscape trees, shrubs, and vines. Pearson Education, Upper Saddle River, pp 405–433
25. Hayes E (2007) Evaluating tree defects, a field guide. MN, Safetrees LLC, p 30