Molecular Markers for Sweet Sorghum Based
on Microarray Expression Data
Martín Calviño&Mihai Miclaus&Rémy Bruggmann& Joachim Messing
Received: 7 May 2009 / Accepted: 22 July 2009 / Published online: 15 August 2009 #Springer Science + Business Media, LLC 2009
Abstract Using an Affymetrix sugarcane genechip, we previously identified 154 genes differentially expressed between grain and sweet sorghum. Although many of these genes have functions related to sugar and cell wall metabolism, dissection of the trait requires genetic analysis. Therefore, it would be advantageous to use microarray data for generation of genetic markers, shown in other species as single-feature polymorphisms (SFPs). As a test case, we used the GeSNP software to screen for SFPs between grain and sweet sorghum. Based on this screen, out of 58 candidate genes, 30 had single-nucleotide polymorphisms (SNPs) from which 19 had validated SFPs. The degree of nucleotide polymorphism found between grain and sweet sorghum was in the order of one SNP per 248 base pairs, with chromosome 8 being highly polymorphic. Indeed, molecular markers could be developed for a third of the candidate genes, giving us a high rate of return by this method.
Keywords Microarray analysis . Single-feature polymorphism (SFP) . Single-nucleotide polymorphism (SNP) . Stem sugar . Biofuel . Sweet sorghum . Sugarcane
Introduction
The development of molecular markers is essential for marker-assisted selection in plant breeding as well as to understand crop domestication and plant evolution
(Varshney et al. 2005). Single-nucleotide polymorphisms (SNPs) have become the marker of choice because of their abundance and uniform distribution throughout the ge-nome (Gupta et al. 2008; Varshney et al. 2005; Zhu and Salmeron 2007). Around 90% of the genetic variation in any organism is attributed to SNPs (Varshney et al.2005; Zhu and Salmeron 2007). They are discovered from genomic or expressed sequence tag sequences available in databases or through sequencing of candidate genes, PCR products, or even whole genomes (Varshney et al. 2005; Zhu and Salmeron2007).
Recent studies have described the use of transcript abundance data from RNA hybridizations to Affymetrix microarrays to discover genetic polymorphisms that can be utilized as markers for genotyping in mapping populations (Borevitz and Chory 2004; Gupta et al. 2008; Hazen and Kay 2003; Shiu and Borevitz 2008; Zhu and Salmeron 2007). In an Affymetrix chip, each gene is represented by 11 different 25-bp oligonucleotides that cover features of the transcribed region of that gene (exons and 3′ untrans-lated regions). Each of these features is described as a perfect match (PM) and mismatch (MM) oligonucleotide. The PM exactly matches the sequence of a standard genotype, whereas the MM differs from the PM by a single base substitution at the central, 13th position (Borevitz and Chory 2004; Hazen and Kay 2003; Zhu and Salmeron
2007).
A new aspect of this approach is to discover sequence polymorphisms in cultivars or variants of species, where one of them has been sequenced but where no sequence information is yet available from the other ones. Here, the hybridization data from microarrays not only measure differential gene expression but also can yield information on sequence variation between two inbred lines. If two genotypes differ only in the amount of mRNA in a M. Calviño
:
M. Miclaus:
R. Bruggmann:
J. Messing (*)Waksman Institute of Microbiology, Rutgers University, 190 Frelinghuysen Road,
particular tissue, this should result in a relatively constant difference in hybridization throughout the 11 features. On the other hand, if the two genotypes contain a genetic polymorphism within a gene that coincides with one of the particular features, this will produce differential hybridization for that single feature. Such differences have been described as single-feature polymorphisms (SFPs) (Borevitz and Chory 2004; Borevitz et al. 2003; Hazen and Kay 2003; Zhu and Salmeron 2007). Thus, expression microarrays hybridized with RNA are able to provide us not only with phenotypic (variation in gene expression) but also with genotypic (marker) data (Zhu and Salmeron 2007). If two genotypes differ in the expression level of a particular gene, we can consider it as an expression level polymorphism or (ELP). Both ELPs and SFPs are dominant markers and can be mapped as alleles in segregating populations (genetical genomics), and ELPs can be considered as traits to determine expression quantitative trait loci (eQTLs) (Coram et al. 2008; Jansen and Nap2001).
In Arabidopsis, SFPs have been used for several purposes such as mapping clock mutations through bulked segregant analysis (Hazen et al.2005), the identification of genes for flowering QTLs (Werner et al. 2005), high-density haplotyping of recombinant inbred lines (RILs) (West et al. 2006), and natural variation in genome-wide DNA polymorphism (Borevitz et al.2007). In plant species of agronomic importance, SFPs have been utilized to identify genome-wide molecular markers in barley and rice (Kumar et al. 2007; Potokina et al. 2008; Rostoks et al. 2005) as well as markers linked to Yr5 stripe rust resistance in wheat (Coram et al.2008). However, an impediment to SFP discovery in crop plants based on DNA hybridization to Affymetrix expression arrays could be the size of gene families (Borevitz et al. 2003; Varshney et al. 2005; Zhu and Salmeron2007). Because the coding regions of many gene clusters that arose by tandem gene amplification are quite conserved, hybridization-based approaches would not be sufficient to distinguish between allelic and paralogous copies (Xu and Messing2008). Therefore, one would have to limit this analysis to low-copy genes. On the other hand, this approach does not aim at identifying candidate genes directly but rather linked genetic markers.
An area where gene discovery has become of general interest is the utilization of biomass for the production of alternative fuels. Because desirable traits for biofuel crops are very complex and involve many genes from different pathways, it becomes necessary to take genetic approaches to identify key genes so that molecular breeding can be employed to make performance improvements. The most successful biofuel crop today is sugarcane. However, it cannot be grown in moderate climate. Maize, which is a major biofuel crop in the USA, has a much lower yield of
bioethanol per acreage than sugarcane, requires high input costs, and is a major food and feed source. A crop that bridges between the two is the close relative, sorghum. Sorghum tolerates harsher environmental conditions than sugarcane and maize, has a higher disease resistance than maize, and has a high stem sugar variant, sweet sorghum, which has potential yields of bioethanol like sugarcane. Moreover, sweet sorghum can be crossed with grain sorghum so that genetic analysis could uncover key regulatory factors that would increase sugar and decrease lignocellulose in the biomass. Therefore, sorghum could be used to identify both SFPs and ELPs linked to high sugar content.
We have recently reported the hybridization of RNAs derived from the stems of grain and sweet sorghum onto the sugarcane Affymetrix genechip (Calviño et al. 2008). A previous study demonstrated that cross-species hybridiza-tion did not affect the reproducibility of the microarray experiment (Cáceres et al.2003). Moreover, an Affymetrix soybean genome array has been used to identify SFPs in the closely related species cowpea (Das et al.2008).
Here, we have asked the question whether we could use the sugarcane chip analysis to extend the cross-species concept in SFP discovery in the grasses. We report the identification of SFPs in 58 sorghum genes by using the recently developed software GeSNP (Greenhall et al.2007). These genes were described in our previous study to be differentially expressed between grain and sweet sorghum (Calviño et al. 2008). The utility of GeSNP has been successfully tested for SFP discovery in mice, humans, and chimpanzees (Greenhall et al.2007), but there is no report on plants yet. In order to experimentally validate the SFPs identified in sorghum, we sequenced fragments from 58 genes and found SNPs in 30 of them, out of which 19 genes had a validated SFP. Furthermore, we develop molecular markers based on the SNPs found. The high experimental validation rate of SNPs of 50% of the candidate genes shows the potential of this method for the development of molecular markers and, in principle, the applicability to any trait of interest.
Results
SFP discovery and validation from differentially expressed genes in sorghum
discover single-feature polymorphisms within these genes as well, we uploaded the sugarcane Affymetrix CEL files previously obtained into the GeSNP software. Indeed, we found that, from 154 genes, 57 harbored a SFP with a t value ≥7 (Fig. 1 and Table 1). Based on existing data (Greenhall et al.2007), we adopted atvalue of 7 or higher as a threshold. Chromosomes 1, 2, and 3 had the highest number of genes displaying both ELPs and SFPs, whereas chromosomes 5 and 6 had the lowest number of ELPs and SFPs, respectively (Fig.1).
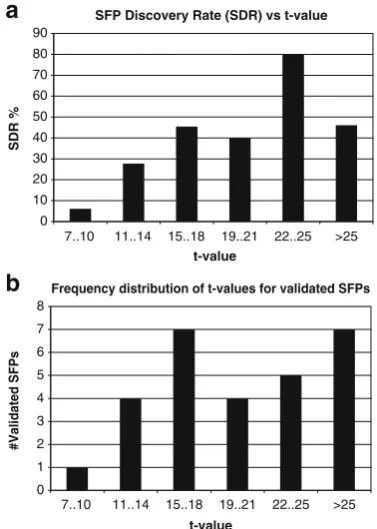
In order to validate the SFPs discovered and calculate the SFP discovery rate (SDR) of the GeSNP software, we cloned and sequenced the fragments from 57 genes harboring both ELPs and SFPs in addition to one gene harboring only SFPs (see below) from sweet sorghum Rio and aligned the sequences against the BTx623 reference genome. The software predicted a total of 125 SFPs (on average∼2 per gene), and we could experimentally validate 32 of them (Table 1). We calculated the SDR as 25.6%
SDR¼½ValidatedSFPs=TotalSFPs
ð 100Þ. As expected,
the SDR was dependent on the t value, with the lowest SDR (less than 10%) attvalues between 7 and 10 and the highest SDR (80%) withtvalues from 22 to 25, respectively (Fig.2a).
Besides SFPs identified in genes that are differentially expressed, the GeSNP software also detected SFPs in genes that did not show differential expression under our experimental conditions (data not shown). Considering the high success rate of SNPs discovered in genes having both SFPs and ELPs, we extended our screen to genes that have predicted SFPs withtvalues of 22 to 25 but no ELP. This analysis allowed us to identify 35 sugarcane probe pairs that matched the sorghum genome sequence
0 5 10 15 20 25 30 35
Ch1 Ch2 Ch3 Ch4 Ch5 Ch6 Ch7 Ch8 Ch9 Ch10
Sorghum chromosomes
Frequency
ELPs SFPs t-value ≥7 Validated SFPs
Fig. 1 Histogram showing the proportion of ELPs and SFPs between BTx623 and Rio for each sorghum chromosome. The number of genes with ELPs previously reported by Calviño et al.2008were plotted for each chromosome along with the number of SFPs found in this study. Only SFPs withtvalues≥7 were taken into consideration.
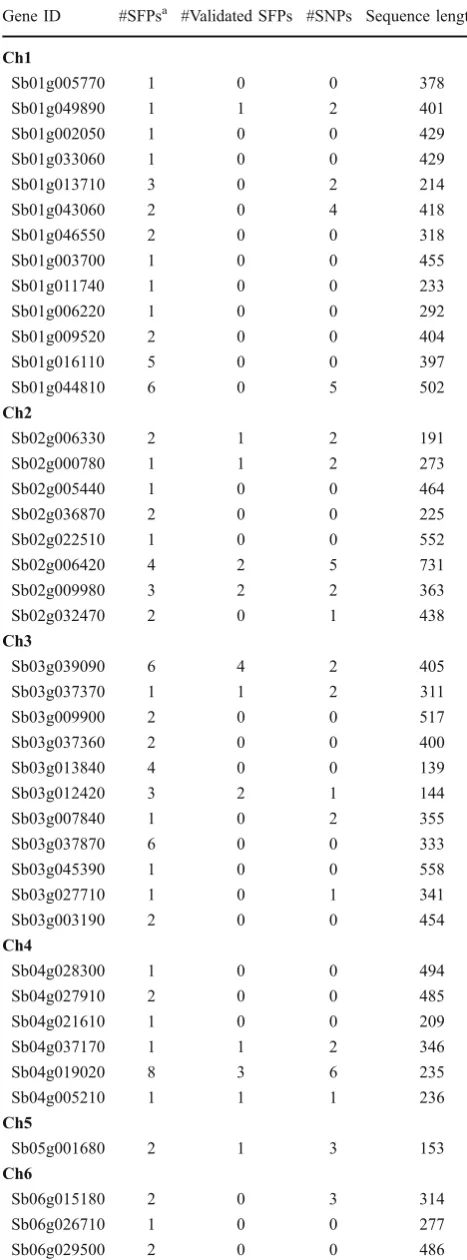
Table 1 Sorghum Genes with SFPs Predicted by the GeSNP Software
Gene ID #SFPsa #Validated SFPs #SNPs Sequence length
Ch1
Sb01g005770 1 0 0 378
Sb01g049890 1 1 2 401
Sb01g002050 1 0 0 429
Sb01g033060 1 0 0 429
Sb01g013710 3 0 2 214
Sb01g043060 2 0 4 418
Sb01g046550 2 0 0 318
Sb01g003700 1 0 0 455
Sb01g011740 1 0 0 233
Sb01g006220 1 0 0 292
Sb01g009520 2 0 0 404
Sb01g016110 5 0 0 397
Sb01g044810 6 0 5 502
Ch2
Sb02g006330 2 1 2 191
Sb02g000780 1 1 2 273
Sb02g005440 1 0 0 464
Sb02g036870 2 0 0 225
Sb02g022510 1 0 0 552
Sb02g006420 4 2 5 731
Sb02g009980 3 2 2 363
Sb02g032470 2 0 1 438
Ch3
Sb03g039090 6 4 2 405
Sb03g037370 1 1 2 311
Sb03g009900 2 0 0 517
Sb03g037360 2 0 0 400
Sb03g013840 4 0 0 139
Sb03g012420 3 2 1 144
Sb03g007840 1 0 2 355
Sb03g037870 6 0 0 333
Sb03g045390 1 0 0 558
Sb03g027710 1 0 1 341
Sb03g003190 2 0 0 454
Ch4
Sb04g028300 1 0 0 494
Sb04g027910 2 0 0 485
Sb04g021610 1 0 0 209
Sb04g037170 1 1 2 346
Sb04g019020 8 3 6 235
Sb04g005210 1 1 1 236
Ch5
Sb05g001680 2 1 3 153
Ch6
Sb06g015180 2 0 3 314
Sb06g026710 1 0 0 277
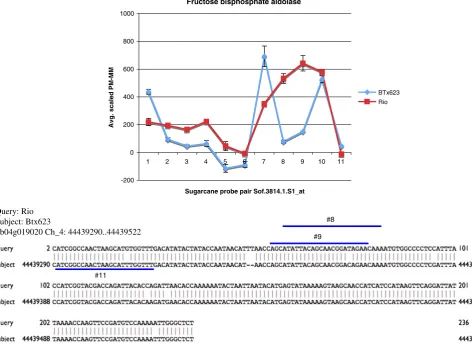
and have a high probability of representing SNPs in genes that have no ELPs between BTx623 and Rio but were expressed in the stem (see Table 2). For example, one of the sugarcane probe pairs (Sof.3814.1.S1_at) matched a sorghum gene coding for fructose bispho-spate aldolase. Since the protein product of this gene has a role in the sucrose and starch metabolic pathway (our trait of interest), we cloned and sequenced the fragment containing the SFPs. As it is shown in Fig. 3, we found six SNPs, two of which were recognized by three sugarcane probe pairs. This result indicates that our approach is able to efficiently detect SNPs. From the 58 genes that were sequenced, 19 genes (∼33%) had a validated SFP, and 11 genes (19%) harbored SNPs outside the probe pairs at different location than the one predicted by GeSNP. Therefore, the total SNP detection rate was ∼52%. A list of genes with validated SFPs as well as the nature of the nucleotide change/s is provided in Table 3.
Most of the validated SFPs had probe pairs withtvalues from 15 to 18 and greater than 25 (Fig.2b). Since the SFP validation depends on the SNP position along the probe pair (Rostoks et al. 2005), we analyzed the SNP position from the edge of the sugarcane probe pair for those genes with validated SFPs (Fig.4). We found that, from a total of 22 probe pairs (probes that recognized the same SNP were
not counted), 19 of them recognized a SNP between the sixth and the 13th positions.
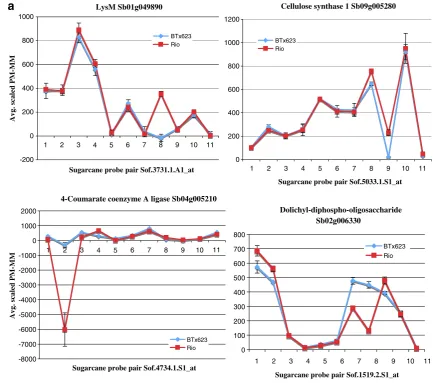
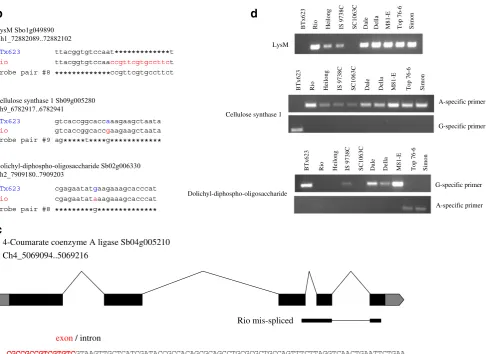
With regard to genes involved in our traits of interest, that is, sugar accumulation and cell wall metabolism, we validated SFPs for five of them (Figs. 5 and 3). The SFPs in the cellulose synthase 1 and dolichyl-diphospho-oligosaccharide genes was based on a SNP, whereas the SFP in the LysM gene was due to a 13-bp indel (Fig.5a,b). This indel allowed us to develop an allele-specific PCR marker (Fig.5d). In the case of the 4-coumarate coenzyme A ligase gene, the SFP was based on a mis-spliced intron in Rio (Fig.5c).
To calculate the number of SNPs per total sequence length, we determined the genome size of the Rio line by flow cytometry. The Rio line appeared to have the same genome size than the sequenced BTx623 (data not shown). Based on 87 SNPs in 21,612 bp of sequence from both parental lines, we concluded that there is an average of one SNP every 248 base pairs of sequence between BTx623 and Rio. Taking in consideration that the genome size is in the order of 730 Mbp (Paterson et al. 2009), we suggest that 2,938,800 SNPs could exist between grain sorghum BTx623 and sweet sorghum Rio
Table 1 (continued)
Gene ID #SFPsa #Validated SFPs #SNPs Sequence length
Ch7
Sb07g001320 7 0 0 473
Sb07g005930 1 1 2 436
Ch8
Sb08g008320 1 1 7 447
Sb08g016302 1 0 3 268
Sb08g020760 1 0 3 488
Sb08g015010 4 0 0 484
Sb08g002250 6 5 4 316
Sb08g002660 1 0 0 345
Ch9
Sb09g000820 1 1 2 394
Sb09g023620 1 0 0 434
Sb09g006050 2 2 3 268
Sb09g005280 2 1 1 527
Sb09g029170 1 0 10 406
Ch10
Sb10g002230 1 0 2 398
Sb10g007380 1 1 2 374
Sb10g004540 1 0 0 255
Total 125 32 87 21,612
aSFPs withtvalues≥7
Frequency distribution of t-values for validated SFPs
0 1 2 3 4 5 6 7 8
SFP Discovery Rate (SDR) vs t-value
0 10 20 30 40 50 60 70 80 90
7..10 11..14 15..18 19..21 22..25 >25
t-value
7..10 11..14 15..18 19..21 22..25 >25
t-value
a
b
SDR %
#Validated SFPs
and that at least 0.4% of the genome could be poly-morphic between the two lines. We also looked at the SNP density per sorghum chromosome in order to see if there is any difference among them. Surprisingly, we found that the level of polymorphism is higher for chromosomes 8 and 9 and lower for chromosome 3 compared to the average SNP density per Kb of sequence
(4 SNPs/Kbp) (Fig. 6a). However, if we consider the frequency of probe pairs withtvalues between 22 and 25 for each sorghum chromosome as it is shown in Fig.6b, chromosome 3 had the highest number of probes. On the other hand, chromosome 8 had the second highest number of probes withtvalues between 22 and 25 together with a high SNP density (Fig. 6a, b). This might suggest an
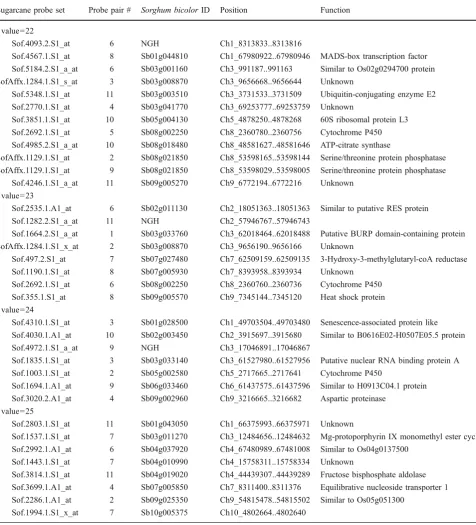
Table 2 Sugarcane Probe Pairs withtValues of 22–25 That Identify Sorghum Transcripts with SFPs but not ELPs Sugarcane probe set Probe pair # Sorghum bicolorID Position Function
tvalue=22
Sof.4093.2.S1_at 6 NGH Ch1_8313833..8313816
Sof.4567.1.S1_at 8 Sb01g044810 Ch1_67980922..67980946 MADS-box transcription factor Sof.5184.2.S1_a_at 6 Sb03g001160 Ch3_991187..991163 Similar to Os02g0294700 protein SofAffx.1284.1.S1_s_at 3 Sb03g008870 Ch3_9656668..9656644 Unknown
Sof.5348.1.S1_at 11 Sb03g003510 Ch3_3731533..3731509 Ubiquitin-conjugating enzyme E2
Sof.2770.1.S1_at 4 Sb03g041770 Ch3_69253777..69253759 Unknown
Sof.3851.1.S1_at 10 Sb05g004130 Ch5_4878250..4878268 60S ribosomal protein L3
Sof.2692.1.S1_at 5 Sb08g002250 Ch8_2360780..2360756 Cytochrome P450
Sof.4985.2.S1_a_at 10 Sb08g018480 Ch8_48581627..48581646 ATP-citrate synthase
SofAffx.1129.1.S1_at 2 Sb08g021850 Ch8_53598165..53598144 Serine/threonine protein phosphatase SofAffx.1129.1.S1_at 9 Sb08g021850 Ch8_53598029..53598005 Serine/threonine protein phosphatase
Sof.4246.1.S1_a_at 11 Sb09g005270 Ch9_6772194..6772216 Unknown
tvalue=23
Sof.2535.1.A1_at 6 Sb02g011130 Ch2_18051363..18051363 Similar to putative RES protein
Sof.1282.2.S1_a_at 11 NGH Ch2_57946767..57946743
Sof.1664.2.S1_a_at 1 Sb03g033760 Ch3_62018464..62018488 Putative BURP domain-containing protein SofAffx.1284.1.S1_x_at 2 Sb03g008870 Ch3_9656190..9656166 Unknown
Sof.497.2.S1_at 7 Sb07g027480 Ch7_62509159..62509135 3-Hydroxy-3-methylglutaryl-coA reductase
Sof.1190.1.S1_at 8 Sb07g005930 Ch7_8393958..8393934 Unknown
Sof.2692.1.S1_at 6 Sb08g002250 Ch8_2360760..2360736 Cytochrome P450
Sof.355.1.S1_at 8 Sb09g005570 Ch9_7345144..7345120 Heat shock protein tvalue=24
Sof.4310.1.S1_at 3 Sb01g028500 Ch1_49703504..49703480 Senescence-associated protein like Sof.4030.1.A1_at 10 Sb02g003450 Ch2_3915697..3915680 Similar to B0616E02-H0507E05.5 protein
Sof.4972.1.S1_a_at 9 NGH Ch3_17046891..17046867
Sof.1835.1.S1_at 3 Sb03g033140 Ch3_61527980..61527956 Putative nuclear RNA binding protein A
Sof.1003.1.S1_at 2 Sb05g002580 Ch5_2717665..2717641 Cytochrome P450
Sof.1694.1.A1_at 9 Sb06g033460 Ch6_61437575..61437596 Similar to H0913C04.1 protein Sof.3020.2.A1_at 4 Sb09g002960 Ch9_3216665..3216682 Aspartic proteinase
tvalue=25
Sof.2803.1.S1_at 11 Sb01g043050 Ch1_66375993..66375971 Unknown
Sof.1537.1.S1_at 7 Sb03g011270 Ch3_12484656..12484632 Mg-protoporphyrin IX monomethyl ester cyclase Sof.2992.1.A1_at 6 Sb04g037920 Ch4_67480989..67481008 Similar to Os04g0137500
Sof.1443.1.S1_at 7 Sb04g010990 Ch4_15758311..15758334 Unknown
Sof.3814.1.S1_at 11 Sb04g019020 Ch4_44439307..44439289 Fructose bisphosphate aldolase Sof.3699.1.A1_at 4 Sb07g005850 Ch7_8311400..8311376 Equilibrative nucleoside transporter 1 Sof.2286.1.A1_at 2 Sb09g025350 Ch9_54815478..54815502 Similar to Os05g051300
Sof.1994.1.S1_x_at 7 Sb10g005375 Ch10_4802664..4802640
unusual level of polymorphism for this chromosome between BTx623 and Rio. However, we have not sufficient data (genes sequenced) to test whether the SNP density differences among the chromosomes are statistically significant.
Sorghum genes harboring validated SFPs allowed us to investigate if such nucleotide substitutions were conserved or not within grain sorghum BTx623, sweet sorghum Rio, and sugarcane. Indeed, we found that from 22 SNPs discovered through 29 validated SFPs (one sugarcane probe pair can recognize more than one SNP), 15 of them were conserved between BTx623 and sugarcane, whereas only eight SNPs were conserved between Rio and sugarcane (Table3).
Development of molecular markers based on validated SFPs
The identification of SNPs between BTx623 and Rio provided a direct way to develop molecular markers that can be used in mapping populations. From 58 candidate genes, we were able to develop allele-specific PCR markers
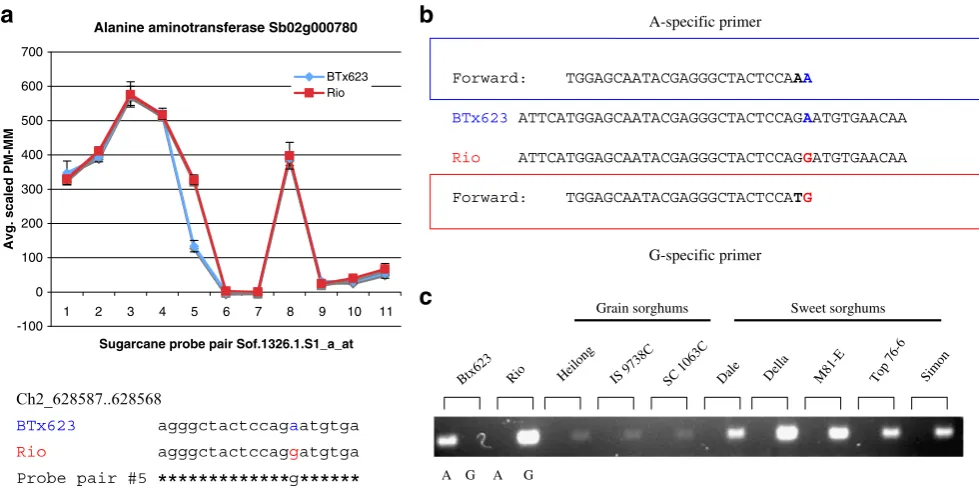
for 18 (Table 4). We utilized the Single Nucleotide Amplified Polymorphism (SNAP) technique to develop markers based on SNPs (Drenkard et al. 2000), as it is shown for the gene alanine aminotransferase (Fig.7). These markers were tested also in other grain and sweet sorghum lines to see whether the SNPs were conserved or not (Table 4). In fact, we found a marker within the gene Sb09g029170 that distinguished the grain sorghums from the sweet sorghums cultivars used in this study. The protein product encoded by this gene is a putative ketol-acid reductoisomerase enzyme that is involved in the biosyn-thesis of valine, leucine, and isoleucine amino acids (www.
phytozome.net/cgi-bin/gbrowse/sorghum/). SNAP markers
were also developed for the cellulose synthase 1 and dolichyl-diphospho-oligosaccharide genes (Fig.5d).
It has been suggested that Dale and Della sweet sorghums share a common genetic background (Ritter et al. 2007). In agreement with this, we found that from ten SNAP markers that gave a PCR product in both lines, they always represented the same allele (Table 4). In addition, the sweet sorghum lines Top 76-6 and Simon #11
#8
#9 Query: Rio
Subject: Btx623
Sb04g019020 Ch_4: 44439290..44439522
Fructose bisphosphate aldolase
-200 0 200 400 600 800 1000
Sugarcane probe pair Sof.3814.1.S1_at
Avg. scaled PM-MM
BTx623 Rio
1 2 3 4 5 6 7 8 9 10 11
Fig. 3 SFP validation for fructose bisphosphate aldolase. A fragment from the gene fructose bisphosphate aldolase was cloned and sequenced from both BTx623 and Rio and SNPs predicted by the probe pairs #8, 9,
have been identified as attractive contrasting pairs for mapping purposes based on their difference not only in genetic distance (D) but also in sugar content (measured as Brix degree) (Ali et al.2008). In our work, we identified six SNAP markers within the genes Sb01g044810, S b 0 3 g 0 2 7 7 1 0 , S b 0 4 g 0 0 3 7 1 7 0 , S b 0 8 g 0 0 8 3 2 0 , Sb09g006050, and Sb10g002230, respectively, which were polymorphic between Top 76-6 and Simon. These markers will be useful for mapping purposes when these lines are used as parents.
Discussion
A significant proportion of the phenotypic variation in any organism can be attributed to polymorphisms at the
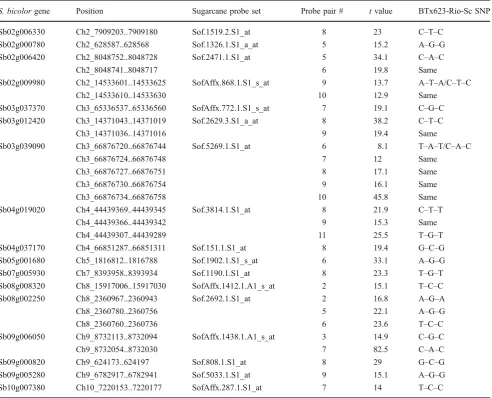
Table 3 Nucleotide Change Conservation for Validated SFPs Between BTx623, Rio, and Sugarcane
S. bicolorgene Position Sugarcane probe set Probe pair # tvalue BTx623-Rio-Sc SNP
Sb02g006330 Ch2_7909203..7909180 Sof.1519.2.S1_at 8 23 C–T–C
Sb02g000780 Ch2_628587..628568 Sof.1326.1.S1_a_at 5 15.2 A–G–G
Sb02g006420 Ch2_8048752..8048728 Sof.2471.1.S1_at 5 34.1 C–A–C
Ch2_8048741..8048717 6 19.8 Same
Sb02g009980 Ch2_14533601..14533625 SofAffx.868.1.S1_s_at 9 13.7 A–T–A/C–T–C
Ch2_14533610..14533630 10 12.9 Same
Sb03g037370 Ch3_65336537..65336560 SofAffx.772.1.S1_s_at 7 19.1 C–G–C
Sb03g012420 Ch3_14371043..14371019 Sof.2629.3.S1_a_at 8 38.2 C–T–C
Ch3_14371036..14371016 9 19.4 Same
Sb03g039090 Ch3_66876720..66876744 Sof.5269.1.S1_at 6 8.1 T–A–T/C–A–C
Ch3_66876724..66876748 7 12 Same
Ch3_66876727..66876751 8 17.1 Same
Ch3_66876730..66876754 9 16.1 Same
Ch3_66876734..66876758 10 45.8 Same
Sb04g019020 Ch4_44439369..44439345 Sof.3814.1.S1_at 8 21.9 C–T–T
Ch4_44439366..44439342 9 15.3 Same
Ch4_44439307..44439289 11 25.5 T–G–T
Sb04g037170 Ch4_66851287..66851311 Sof.151.1.S1_at 8 19.4 G–C–G
Sb05g001680 Ch5_1816812..1816788 Sof.1902.1.S1_s_at 6 33.1 A–G–G
Sb07g005930 Ch7_8393958..8393934 Sof.1190.1.S1_at 8 23.3 T–G–T
Sb08g008320 Ch8_15917006..15917030 SofAffx.1412.1.A1_s_at 2 15.1 T–C–C
Sb08g002250 Ch8_2360967..2360943 Sof.2692.1.S1_at 2 16.8 A–G–A
Ch8_2360780..2360756 5 22.1 A–G–G
Ch8_2360760..2360736 6 23.6 T–C–C
Sb09g006050 Ch9_8732113..8732094 SofAffx.1438.1.A1_s_at 3 14.9 C–G–C
Ch9_8732054..8732030 7 82.5 C–A–C
Sb09g000820 Ch9_624173..624197 Sof.808.1.S1_at 8 29 G–C–G
Sb09g005280 Ch9_6782917..6782941 Sof.5033.1.S1_at 9 15.1 A–G–G
Sb10g007380 Ch10_7220153..7220177 SofAffx.287.1.S1_at 7 14 T–C–C
Same means that a different probe pair recognizes the same SNP ScSugarcane
SNP position on validated SFPs
0 0.5 1 1.5 2 2.5 3 3.5 4 4.5
1 2 3 4 5 6 7 8 9 10 11 12 13
SNP position from the edge of the sugarcane probe pair
DNA level. Thus, these DNA polymorphisms can be used for genotyping, molecular mapping, and marker-assisted selection applications. The association of a particular trait of interest with a DNA polymorphism is essential for breeding purposes. Microarrays have been used to identify abundant DNA polymorphisms through-out the genome (Gupta et al. 2008; Hazen and Kay 2003). In particular, ELPs and SFPs can be identified from RNA hybridization studies. SFPs are detected by oligo-nucleotide arrays and represent DNA polymorphisms between genotypes within an individual oligonucleotide
probe pair that is detected by the difference in hybridiza-tion affinity (Borevitz et al. 2003). In addition, SFPs present in a transcribed gene may be the underlying cause of the difference in a phenotype of interest. In most of the cases, SNPs are the cause of SFPs as have been demonstrated by sequence analysis (Borevitz et al. 2003; Rostoks et al.2005).
Here, the goal was to identify SFPs from an Affymetrix sugarcane genechip dataset of closely related species (Calviño et al. 2008). The Affymetrix sugarcane genechip was used to survey the SFPs with the GeSNP software LysM Sb01g049890
-200 0 200 400 600 800 1000
1 2 3 4 5 6 7 8 9 10 11
1 2 3 4 5 6 7 8 9 10 11
1 2 3 4 5 6 7 8 9 10 11
1 2 3 4 5 6 7 8 9 10 11
Sugarcane probe pair Sof.3731.1.A1_at
Avg. scaled PM-MM
Avg. scaled PM-MM
BTx623 Rio
Cellulose synthase 1 Sb09g005280
0 200 400 600 800 1000 1200
Sugarcane probe pair Sof.5033.1.S1_at BTx623
Rio
4-Coumarate coenzyme A ligase Sb04g005210
-8000 -7000 -6000 -5000 -4000 -3000 -2000 -1000 0 1000 2000
Sugarcane probe pair Sof.4734.1.S1_at BTx623 Rio
Dolichyl-diphospho-oligosaccharide Sb02g006330
0 100 200 300 400 500 600 700 800
Sugarcane probe pair Sof.1519.2.S1_at
BTx623 Rio
a
Fig. 5 GeSNP prediction of SFPs in sorghum genes related to biofuel traits. The hybridization intensity between the perfect match and the mismatch oligonucleotides was averaged and scaled (GeSNP software output) and plotted against each sugarcane probe pair. Graphs are shown for four genes related to biofuel traits that have SFPs witht values of ≥7 and that were previously reported to be differentially expressed between grain sorghum BTx623 and sweet sorghum Rio (a). The SFP present in lysM identified a 13-bp indel, whereas the SFPs present in cellulose synthase 1 and dolichyl-disphospho-oligosaccharide identified an A/G and G/A SNP between BTx623
between two sorghum cultivars that differ in the accumu-lation of fermentable sugars in their stems, with the objective to develop genetic markers for mapping purposes. This is the first report to our knowledge of the use of GeSNP to identify SFPs within closely related grass species and the development of molecular markers based on validated SFPs.
We cloned and sequenced gene fragments harboring SFPs witht values equal or higher than 7 from 58 sweet sorghum genes comprising 125 SFPs in total. In this study, we found a SFP discovery rate of 25.6%, which is sufficient for most applications. Still, there are several possibilities to increase the SDR. First, the number of biological replicates suggested for using the GeSNP software is 4 or more. In contrast, we had only three replicates for both grain and sweet sorghum. Second, the cross-species hybridization of sorghum RNAs to probe sets of the sugarcane array is not as sensitive as intra species hybridization. Third, false positives
could be due to the cross-hybridization of paralogous gene targets to individual probes, which may affect the specificity of the SFP calling. This problem would also arise from using next-generation sequencing for SNP detection. Nevertheless, we could show that the use of expression analysis in conjunction with GeSNP is an efficient and inexpensive way to develop new molecular markers.
The sugarcane probe pairs withtvalues between 22 and 25 had the highest SDR (80%) found in our study. One of these probe pair sets matched a sorghum gene coding for fructose bisphosphate aldolase (cytoplasmic isozyme) and the identified SFP was confirmed through DNA sequence analysis (Fig. 3). This gene codes for a glycolytic enzyme that catalyzes the cleavage of fructose 1,6 bisphosphate to glyceraldehyde 3-phosphate and dihydroxyacetone phos-phate (Tsutsumi et al.1994).
One third (33%) of the 58 genes that we have sequenced have a validated SFP. In addition, we could
CGCCGCCGTCGTGTCGTAAGTTGCTCATCGATACCGCCACAGCGCAGCCTGCGCGCTGCCAGTTTCTTAGGTCAACTGAATTCTGAA
AAACTTCTCCGTCTCTAACCTCAGAATGAAGGA
exon/ intron
intron /exon
Probe pair #2
Probe pair #2 4-Coumarate coenzyme A ligase Sb04g005210 Ch4_5069094..5069216
Rio mis-spliced
BTx623 Rio Heilong IS 9738C SC1063C Dale Della M81-E Top 76-6 Simon
LysM
BTx623 Rio Heilong IS 9738C SC1063C Dale Della M81-E Top 76-6 Simon
Cellulose synthase 1
A-specific primer
G-specific primer
BTx623 Rio Heilong IS 9738C SC1063C Dale Della M81-E Top 76-6 Simon
Dolichyl-diphospho-oligosaccharide
G-specific primer
A-specific primer
b
c
d
detect SNPs in 19% of all sequenced genes at a different position than indicated by GeSNP. This is attributable to the fact that the probe pair set does only cover a part of the gene, which implies that any SNP outside this region is not reported by GeSNP. We estimated the average SNP density between BTx623 and Rio to one SNP every 248 bp. This is probably an underestimation because the sugarcane probe sets were designed from genic regions and are, therefore, more conserved than other regions in the genome.
Although the sorghum chromosomes 1, 2, and 3 had the highest numbers for both ELPs and SFPs, chromo-somes 8 and 9 were the most polymorphic ones, measured as the number of SNPs per Kb sequence (Figs. 1 and6). Our data are in agreement with a previous report by Ritter et al. (2007) in which amplified fragment-length polymor-phism markers on chromosome 8 could unambiguously distinguish grain from sweet sorghum lines (Ritter et al. 2007). Furthermore, sugar content QTLs have been located in this chromosome with a RIL derived from a dwarf derivative of Rio as one of the parents. In addition, we found that a marker within the gene Sb09g029170 coding for a putative ketol-acid reductoisomerase could discriminate the grain sorghums from the sweet sorghum lines used in this study (Table 4). This enzyme is the second in the biosynthesis of branched amino acids valine, leucine, and isoleucine (Leung and Guddat 2009). When the SNPs found through validated SFPs were compared between BTx623, Rio, and sugarcane, we found that SNPs Sugarcane probe pairs with t-values 22..25 that match
genes in sorghum chromosomes
0 1 2 3 4 5 6 7 8 9
Ch1 Ch2 Ch3 Ch4 Ch5 Ch6 Ch7 Ch8 Ch9 Ch10
# Sugarcane probe pairs
SNP density per sorghum chromosome
0 1 2 3 4 5 6 7 8 9
Ch1 Ch2 Ch3 Ch4 Ch8 Ch9
SNP/Kb sequence
a
b
Fig. 6 SNP density per sorghum chromosomes. The number of SNPs per kb of sequence was calculated based on the number of genes sequenced belonging to a given chromosome. Only those chromo-somes with five or more genes sequenced are represented (a). Frequency distribution along sorghum chromosomes of sugarcane probe pairs withtvalues between 22 and 25 (b).
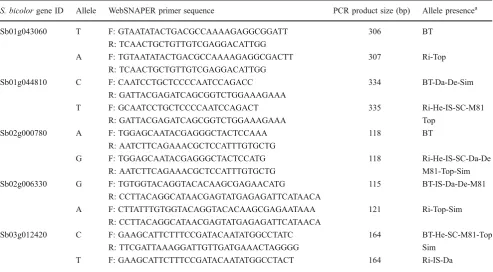
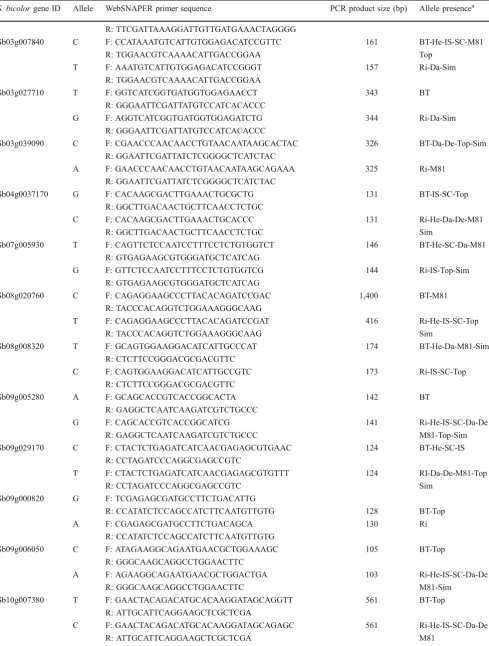
Table 4 Primer Sequences of SNAP Markers within Sorghum Genes
S. bicolorgene ID Allele WebSNAPER primer sequence PCR product size (bp) Allele presencea
Sb01g043060 T F: GTAATATACTGACGCCAAAAGAGGCGGATT 306 BT
R: TCAACTGCTGTTGTCGAGGACATTGG
A F: TGTAATATACTGACGCCAAAAGAGGCGACTT 307 Ri-Top
R: TCAACTGCTGTTGTCGAGGACATTGG
Sb01g044810 C F: CAATCCTGCTCCCCAATCCAGACC 334 BT-Da-De-Sim
R: GATTACGAGATCAGCGGTCTGGAAAGAAA
T F: GCAATCCTGCTCCCCAATCCAGACT 335 Ri-He-IS-SC-M81
R: GATTACGAGATCAGCGGTCTGGAAAGAAA Top
Sb02g000780 A F: TGGAGCAATACGAGGGCTACTCCAAA 118 BT
R: AATCTTCAGAAACGCTCCATTTGTGCTG
G F: TGGAGCAATACGAGGGCTACTCCATG 118 Ri-He-IS-SC-Da-De
R: AATCTTCAGAAACGCTCCATTTGTGCTG M81-Top-Sim
Sb02g006330 G F: TGTGGTACAGGTACACAAGCGAGAACATG 115 BT-IS-Da-De-M81
R: CCTTACAGGCATAACGAGTATGAGAGATTCATAACA
A F: CTTATTTGTGGTACAGGTACACAAGCGAGAATAAA 121 Ri-Top-Sim
R: CCTTACAGGCATAACGAGTATGAGAGATTCATAACA
Sb03g012420 C F: GAAGCATTCTTTCCGATACAATATGGCCTATC 164 BT-He-SC-M81-Top
R: TTCGATTAAAGGATTGTTGATGAAACTAGGGG Sim
Table 4 (continued)
S. bicolorgene ID Allele WebSNAPER primer sequence PCR product size (bp) Allele presencea
R: TTCGATTAAAGGATTGTTGATGAAACTAGGGG
Sb03g007840 C F: CCATAAATGTCATTGTGGAGACATCCGTTC 161 BT-He-IS-SC-M81
R: TGGAACGTCAAAACATTGACCGGAA Top
T F: AAATGTCATTGTGGAGACATCCGGGT 157 Ri-Da-Sim
R: TGGAACGTCAAAACATTGACCGGAA
Sb03g027710 T F: GGTCATCGGTGATGGTGGAGAACCT 343 BT
R: GGGAATTCGATTATGTCCATCACACCC
G F: AGGTCATCGGTGATGGTGGAGATCTG 344 Ri-Da-Sim
R: GGGAATTCGATTATGTCCATCACACCC
Sb03g039090 C F: CGAACCCAACAACCTGTAACAATAAGCACTAC 326 BT-Da-De-Top-Sim
R: GGAATTCGATTATCTCGGGGCTCATCTAC
A F: GAACCCAACAACCTGTAACAATAAGCAGAAA 325 Ri-M81
R: GGAATTCGATTATCTCGGGGCTCATCTAC
Sb04g0037170 G F: CACAAGCGACTTGAAACTGCGCTG 131 BT-IS-SC-Top
R: GGCTTGACAACTGCTTCAACCTCTGC
C F: CACAAGCGACTTGAAACTGCACCC 131 Ri-He-Da-De-M81
R: GGCTTGACAACTGCTTCAACCTCTGC Sim
Sb07g005930 T F: CAGTTCTCCAATCCTTTCCTCTGTGGTCT 146 BT-He-SC-Da-M81
R: GTGAGAAGCGTGGGATGCTCATCAG
G F: GTTCTCCAATCCTTTCCTCTGTGGTCG 144 Ri-IS-Top-Sim
R: GTGAGAAGCGTGGGATGCTCATCAG
Sb08g020760 C F: CAGAGGAAGCCCTTACACAGATCCGAC 1,400 BT-M81
R: TACCCACAGGTCTGGAAAGGGCAAG
T F: CAGAGGAAGCCCTTACACAGATCCGAT 416 Ri-He-IS-SC-Top
R: TACCCACAGGTCTGGAAAGGGCAAG Sim
Sb08g008320 T F: GCAGTGGAAGGACATCATTGCCCAT 174 BT-He-Da-M81-Sim
R: CTCTTCCGGGACGCGACGTTC
C F: CAGTGGAAGGACATCATTGCCGTC 173 Ri-IS-SC-Top
R: CTCTTCCGGGACGCGACGTTC
Sb09g005280 A F: GCAGCACCGTCACCGGCACTA 142 BT
R: GAGGCTCAATCAAGATCGTCTGCCC
G F: CAGCACCGTCACCGGCATCG 141 Ri-He-IS-SC-Da-De
R: GAGGCTCAATCAAGATCGTCTGCCC M81-Top-Sim
Sb09g029170 C F: CTACTCTGAGATCATCAACGAGAGCGTGAAC 124 BT-He-SC-IS
R: CCTAGATCCCAGGCGAGCCGTC
T F: CTACTCTGAGATCATCAACGAGAGCGTGTTT 124 RI-Da-De-M81-Top
R: CCTAGATCCCAGGCGAGCCGTC Sim
Sb09g000820 G F: TCGAGAGCGATGCCTTCTGACATTG
R: CCATATCTCCAGCCATCTTCAATGTTGTG 128 BT-Top
A F: CGAGAGCGATGCCTTCTGACAGCA 130 Ri
R: CCATATCTCCAGCCATCTTCAATGTTGTG
Sb09g006050 C F: ATAGAAGGCAGAATGAACGCTGGAAAGC 105 BT-Top
R: GGGCAAGCAGGCCTGGAACTTC
A F: AGAAGGCAGAATGAACGCTGGACTGA 103 Ri-He-IS-SC-Da-De
R: GGGCAAGCAGGCCTGGAACTTC M81-Sim
Sb10g007380 T F: GAACTACAGACATGCACAAGGATAGCAGGTT 561 BT-Top
R: ATTGCATTCAGGAAGCTCGCTCGA
C F: GAACTACAGACATGCACAAGGATAGCAGAGC 561 Ri-He-IS-SC-Da-De
between BTx623 and sugarcane are twice as high as between Rio and sugarcane.
Allelic genetic diversity among sweet sorghum cultivars has previously been investigated based on simple sequence repeat markers (Ali et al. 2008). This study described the correlations between allelic diversity and the degree of stem sugar. Indeed, one could envision a simpler approach, using the microarray described here by hybridizing stem-derived RNAs from these lines to the sugarcane genechip, and identify both ELPs and SFPs for subsequent mapping of sugar content QTLs. Furthermore, the SNPs identified in our study provided us with the opportunity to develop molecular markers within genes. So far, there is no report of SNP-based molecular markers in transcribed genes in sorghum. The SFPs generated from transcriptome studies are also useful for the development of markers in those species that lack
sequence resources such as Miscanthus and switchgrass, further extending the use of microarrays of one species for related ones.
Materials and methods
Plant material
The grain sorghum lines Heilong (accession number PI 563518), IS 9738C (PI 595715), and SC 1063C (PI 595741) were obtained from the National Plant Germplasm System (NPGS), USDA. The other lines used in this study were previously described (Calviño et al.2008). Two-week-old seedlings were harvested for the extraction of genomic DNA.
Table 4 (continued)
S. bicolorgene ID Allele WebSNAPER primer sequence PCR product size (bp) Allele presencea
Sb10g002230 G F: CTTCAATCCGACAACCAAGTCGCTG 197 BT-He-IS-Top
R: CTGGAACTGCAATGCGGCCATT
A F: GCTTCAATCCGACAACCAAGTCGCTA 197 Ri-SC-Da-De-M81
R: CTGGAACTGCAATGCGGCCATT Sim
BTBTx623,RiRio,HeHeilong,ISIS 9738C,SCSC 1063C,DaDale,DeDella,M81M81-E,TopTop76-6,SimSimon
aOnly the cultivars that gave a PCR product were scored. If a cultivar was heterozygous for a particular allele, it was not scored
Alanine aminotransferase Sb02g000780
-100 0 100 200 300 400 500 600 700
Sugarcane probe pair Sof.1326.1.S1_a_at
Avg. scaled PM-MM
BTx623 Rio
1 2 3 4 5 6 7 8 9 10 11
Forward: TGGAGCAATACGAGGGCTACTCCAAA
BTx623 ATTCATGGAGCAATACGAGGGCTACTCCAGAATGTGAACAA
Rio ATTCATGGAGCAATACGAGGGCTACTCCAGGATGTGAACAA
Forward: TGGAGCAATACGAGGGCTACTCCATG
A-specific primer
G-specific primer
A G
Btx6 23
Rio Hei long
IS 9 738C
A G
SC 1 063C
Dal e
Del la
M81 -E
Top 76-6
Sim on
Grain sorghums Sweet sorghums
a
b
c
Fig. 7 Development of a molecular marker for alanine aminotrans-ferase based on SFP discovery and the SNAP technique. The SFP detected by the probe pair #5 in the sugarcane probe set Sof.1326.1.
SFP discovery and validation from Affymetrix transcript data
The microarray analysis for differentially expressed tran-scripts in stems of grain and sweet sorghum with a sugarcane genechip was previously described (Calviño et al. 2008). The CEL files from the microarray work were uploaded into the publicly available GeSNP software at
http://porifera.ucsd.edu/∼cabney/cgi-bin/geSNP.cgi, and an
excel file was obtained with all the probe sets in the array harboring an SFP together with their respective t values. The excel file also contained the average hybridization intensity between the PM and MM probe pairs (average scaled PM–MM) as well as their variance values that were converted to standard deviations. These values were used to generate the graphs displaying differences in hybridization intensity between BTx623 and Rio along the 11 sugarcane probe pairs for a given probe set.
From the transcripts previously described as being differen-tially expressed between grain sorghum BTx623 and sweet sorghum Rio, we selected those harboring SFPs withtvalues≥7 for further validation through sequencing. In total, we sequenced gene fragments corresponding to 58 different genes. Total RNA from Rio stem tissue was extracted at the time of flowering from three independent plants. RNA extraction was performed with the RNeasy Plant Mini Kit from QIAGEN. cDNA synthesis was performed for each of the three samples from 1 μg of total RNA with the SuperScript III First-Strand Synthesis kit from Invitrogen. cDNAs from Rio were pooled respectively and used for the amplification of genes with SFPs.
The reverse transcription polymerase chain reaction products were checked by agarose gel electrophoresis in order to verify that a single band amplification product from each gene was present. The PCR products were purified with the QIAquick PCR Purification kit from Qiagen and cloned into the pGEM-T easy vector from Promega. Twelve clones per gene were sequenced in order to identify any sequencing or reverse transcriptase errors. The consensus sequence for each gene was then used to find SNPs between BTx623 and Rio.
Development of molecular markers using WebSNAPER software
Once a SNP was identified between BTx623 and Rio for a particular gene of interest, the sequence harboring the SNP in question was uploaded into the publicly available WebSNAPER software (
http://pga.mgh.harvard.edu/cgi-bin/snap3/websnaper3.cgi). The SNAP procedure has
been previously described (Drenkard et al.2000). Several primer pairs per SNP were tested, and the ones that successfully distinguished the SNP in one line or the other
were selected. The primer sequences used to distinguish SNPs are provided in Table4.
Genomic DNA from 2-week-old seedlings was extracted with the PrepEase Genomic DNA Isolation kit from USB. Several concentrations of genomic DNA were tested, and 50 ng was used for testing the SNAP primer pairs through PCR. The conditions used for PCR reaction were as follows: 94°C for 2 min, then 30× [94°C 30 s, 64°C 30 s, 72°C 30 min] and a final extension at 72°C for 2 min.
Acknowledgments The research described in this manuscript was supported by the Selman A. Waksman Chair in Molecular Genetics to JM and by the sponsorship from the International Institute of Education (IIE), and the Fulbright Commission in Uruguay to MC. We thank Wenqin Wang and Todd Michael for their assistance in the measure-ment of BTx623 and Rio genome sizes through flow cytometry.
References
Ali M, Rajewski J, Baenziger P, Gill K, Eskridge K, Dweikat I. Assessment of genetic diversity and relationship among a collection of US sweet sorghum germplasm by SSR markers. Mol Breed. 2008;21:497–509.
Borevitz JO, Chory J. Genomics tools for QTL analysis and gene discovery. Curr Opin Plant Biol. 2004;7:132–6.
Borevitz JO, Liang D, Plouffe D, Chang HS, Zhu T, Weigel D, et al. Large-scale identification of single-feature polymorphisms in complex genomes. Genome Res. 2003;13:513–23.
Borevitz JO, Hazen SP, Michael TP, Morris GP, Baxter IR, Hu TT, et al. Genome-wide patterns of single-feature polymorphism in
Arabidopsis thaliana. Proc Natl Acad Sci USA. 2007;104:
12057–62.
Cáceres M, Lachuer J, Zapala MA, Redmond JC, Kudo L, Geschwind DH, et al. Elevated gene expression levels distinguish human from non-human primate brains. Proc Natl Acad Sci USA. 2003;100:13030–5.
Calviño M, Bruggmann R, Messing J. Screen of genes linked to high-sugar content in stems by comparative genomics. Rice. 2008;1:166–76.
Coram TE, Settles ML, Wang M, Chen X. Surveying expression level polymorphism and single-feature polymorphism in near-isogenic wheat lines differing for the Yr5 stripe rust resistance locus. Theor Appl Genet. 2008;117:401–11.
Das S, Bhat PR, Sudhakar C, Ehlers JD, Wanamaker S, Roberts PA, et al. Detection and validation of single feature polymorphisms in cowpea (Vigna unguiculataL. Walp) using a soybean genome array. BMC Genomics. 2008;9:107.
Drenkard E, Richter BG, Rozen S, Stutius ML, Angell NA, Mindrinos M, et al. A simple procedure for the analysis of single nucleotide polymorphisms facilitates map-based cloning in Arabidopsis. Plant Physiol. 2000;124:1483–92.
Greenhall JA, Zapala MA, Cáceres M, Libiger O, Barlow C, Schork NJ, et al. Detecting genetic variation in microarray expression data. Genome Res. 2007;17:1228–35.
Gupta PK, Rustgi S, Mir RR. Array-based high-throughput DNA markers for crop improvement. Heredity. 2008;101:5–18. Hazen SP, Borevitz JO, Harmon FG, Pruneda-Paz JL, Schultz TF,
Yanovsky MJ, et al. Rapid array mapping of circadian clock and developmental mutations in Arabidopsis. Plant Physiol. 2005;138:990–7.
Jansen RC, Nap JP. Genetical genomics: the added value from segregation. Trends Genet. 2001;17:388–91.
Kumar R, Qiu J, Joshi T, Valliyodan B, Xu D, Nguyen HT. Single feature polymorphism discovery in rice. PLoS ONE. 2007;2: e284.
Leung EW, Guddat LW. Conformational changes in a plant ketol-acid reductoisomerase upon Mg(2+) and NADPH binding as revealed by two crystal structures. J Mol Biol. 2009. doi:10.1016/j. jmb.2009.04.012.
Paterson AH, Bowers JE, Bruggmann R, Dubchak I, Grimwood J, Gundlach H, et al. The Sorghum bicolor genome and the diversification of grasses. Nature. 2009;457:551–6.
Potokina E, Druka A, Luo Z, Wise R, Waugh R, Kearsey M. Gene expression quantitative trait locus analysis of 16 000 barley genes reveals a complex pattern of genome-wide transcriptional regulation. Plant J. 2008;53:90–101.
Ritter KB, McIntyre CL, Godwin ID, Jordan DR, Chapman SC. An assessment of the genetic relationship between sweet and grain sorghums, within Sorghum bicolor ssp. bicolor (L.) Moench, using AFLP markers. Euphytica. 2007;157:161–76.
Rostoks N, Borevitz JO, Hedley PE, Russell J, Mudie S, Morris J, et al. Single-feature polymorphism discovery in the barley tran-scriptome. Genome Biol. 2005;6:R54.
Shiu SH, Borevitz JO. The next generation of microarray research: applications in evolutionary and ecological genomics. Heredity. 2008;100:141–9.
Tsutsumi K, Kagaya Y, Hidaka S, Suzuki J, Tokairin Y, Hirai T, et al. Structural analysis of the chloroplastic and cytoplasmic aldolase-encoding genes implicated the occurrence of multiple loci in rice. Gene. 1994;141:215–20.
Varshney RK, Graner A, Sorrells ME. Genomics-assisted breeding for crop improvement. Trends Plant Sci. 2005;10:621–30.
Werner JD, Borevitz JO, Warthmann N, Trainer GT. Quantitative trait locus mapping and DNA array hybridization identify an FLM deletion as a cause for natural flowering-time variation. Proc Natl Acad Sci USA. 2005;102:2460–5.
West MA, van Leeuwen H, Kozik A, Kliebenstein DJ, Doerge RW, St Clair DA, et al. High-density haplotyping with microarray-based expression and single feature polymorphism markers in
Arabi-dopsis. Genome Res. 2006;16:787–95.
Xu JH, Messing J. Organization of the prolamin gene family provides insight into the evolution of the maize genome and gene duplications in grass species. Proc Natl Acad Sci USA. 2008;105:14330–5.