http://www.sciencepublishinggroup.com/j/epes doi: 10.11648/j.epes.20190805.13
ISSN: 2326-912X (Print); ISSN: 2326-9200 (Online)
New Multi Objective Approach for Optimal Network
Reconfiguration in Electrical Distribution Systems Using
Modified Ant Colony Algorithm
Arouna Oloulade
1, Adolphe Imano Moukengue
2, Richard Agbokpanzo
3, Antoine Vianou
4,
Herman Tamadaho
1, Ramanou Badarou
31Electrotechnic, Telecommunications and Informatics Laboratory (LETIA), University of Abomey-Calavi, Abomey-Calavi, Benin 2Electronic, Electrotechnic, Automatic, Telecommunications Laboratory (LEEAT), University of Douala, Douala, Cameroun 3
Polytechnic School of Abomey-Calavi, University of Abomey-Calavi, Abomey-Calavi, Benin
4Laboratory of Thermophysic Characterization of Materials and Energy Mastering, University of Abomey-Calavi, Cotonou, Benin
Email address:
To cite this article:
Arouna Oloulade, Adolphe Imano Moukengue, Richard Agbokpanzo, Antoine Vianou, Herman Tamadaho, Ramanou Badarou. New Multi Objective Approach for Optimal Network Reconfiguration in Electrical Distribution Systems Using Modified Ant Colony Algorithm. American Journal of Electrical Power and Energy Systems. Vol. 8, No. 5, 2019, pp. 120-126. doi: 10.11648/j.epes.20190805.13 Received: September 16, 2019; Accepted: October 8, 2019; Published: October 20, 2019
Abstract:
The losses in networks of Beninese Electrical Energy Company (SBEE) are very high and therefore constitute a concern for the operators. This work consisted in finding an optimal topology of a 41 nodes real network of SBEE by Modified Ant Colony Algorithms (MACA) in order to reduce the losses and ensure a continuous power supply to the customers in case of occurrence disturbances on any branch of this network. With technological breakthrough of Automation and Supervision Systems (SCADA), the operation of distribution networks can be ensured remotely in real time with the aim of minimizing losses, eliminating equipment overload and improving reliability. The criteria of technical performance improvement formulated under operating constraints are solved by Modified Ant Colony Algorithm (MACA) which is association of ant system and fuzzy logic on the Matlab platform. The best results obtained show the effectiveness and efficiency of this method. The SBEE's HVA networks can then be reconfigured automatically to significantly improve their continuity of supply and reliability. The improved results obtained after tests on a standard 33-nodes and a real 41 nodes networks show the robustness and accuracy of this MACA algorithm.Keywords:
Reconfiguration, Ant Colony Algorithm, Power Loss Reduction, Radial Distribution Network1. Introduction
Distribution networks is very important in energy flow chain and take an important part of the electrical industry's facilities, to the point where 30% to 40% of dedicated investments in the energy sector are devoted to it but do not receive necessary technological impact [1]. These distribution systems, although constructed in a loop structure, are operated in a radial configuration in order to ensure the coordination, efficiency and effectiveness of the protection systems. Distribution engineers in normal operating conditions or sometimes in the disturbed system periodically
minimizes losses and improves the node voltage profiles [3]. Network reconfiguration aims improvement of the voltage profiles, the stability, and the reliability of networks and contributes to the reduction of technical losses by optimizing its driving.
The distribution networks of SBEE are not very automated.
Indeed, the switches installed there are, for the most part, under manual control, the few existing voltage interrupt switches are not functional, associated with the mechanical switches which are not motorized and are therefore not remote controllable. These shortcomings in SBEE's distribution networks are the operating difficulties. Thus, excessive losses are generated, interruption times which are not in the optimal proportions and which induce important undistributed energies (END) [4].
The reconfiguration of distribution networks for loss minimization has been proposed for the first time by Merlin and Back in [5] where a heuristic optimization approach has been used to determine an optimal configuration minimizing losses in a tree network with a specific charge. Since then, several other methods have been developed and oriented towards programming based on the C-language, genetic algorithms [6], evolutionary programming [7] which proposed a reconfiguration of distribution networks by the heuristic permutation method compared to the TABOU method. They found that the method of branch switching makes satisfactory results over the other. In recent years, several researchers have used genetic algorithms (AGs) and ant colony to solve optimization problems and whose matched results are relevant.
Recently, in view of the major issues of environmental protection in order to control the human activities consequences on the degradation of natural resources, several altenatives of efficiency of the electrical networks have multiplied and strengthened. More authors have been involved in the technique of electrical networks reconfiguration in order to improve their performance. Indeed, in 2013, Nagy et al [8] proposed the genetic algorithms for reconfiguring a three-part electrical network. Following the application of their tools, they found that their method is efficient and effective. In the same year, Arul et al [9] proposed an improved GA method for reconfiguring distribution networks based on network reduction and reliability indices. In 2015, Tamer et al [10] studied the optimization of the topology of a 33-node electrical network using the differential evolution strategy. Tung et al [11] did a reconfiguration of a standard network in 2016 using metaheuristic methods, which they found as a result of their study, that these methods are better suited to solving combinatorial problems such as that reconfiguration compared to the methods determined. In 2017, Abhiraj [12] et al used an inspired method of droop and dynamism that characterizes the hunting of prey of libelulles to recon-figure a radial distribution network. In 2018, Abraj Tan-jung et al [13] used analytical methods to re-configure a standard distribution network.
In this paper, Modified Ant Colony Algorithms (MACA) are developed and tested on a standard 33 nodes network and then on 41 real nodes of Benin Electrical Energy Company (SBEE).
2. Issues in Operation of SBEE
Distribution Networks
The beninese electrical system is mainly supplied by the Benin Electric Community (CEB) imports, direct energy purchases from independent producers (AGGREKO and MRI) and PARAS Energy in Nigeria.
This electrical system is made of 2678 HVA/LVA stations, 8 dispatch stations and 121 HVA departures. The conduct of the SBEE networks is very little automated. In fact, overhead switches such as mechanical switches are not equipped with adequate technology that can allow their remote operation. The search for defects on the lines is done step by step, thus generating significant undistributed energies as illustrated in Figure 1 which shows the proportion of undistributed energies by region of the SBEE due to bad facilities and whose cumulative energy in 2017 is estimated at 4 286 846 kWh [4]. In fact, the operators of the SBEE networks are confronted with some difficulties in manual operating the switches installed on the networks and are sometimes obliged to resort by sectioning of electrical branch in default. This situation unnecessarily lengthens the duration of interventions and consequently increases the undistributed energies. It is also observed that the level of losses in the system is globally high as illustrated in Figure 2 and until then, constitutes a source of constant concern for the operator and supervisors who seek to master it and rationalize the electrical service and thus, limit the resulting expenses. This figure represents losses evolution on the SBEE networks since 2009 until 2017. The losses in a distribution system is made of two components, technical and non-technical or commercial losses. Technical losses are due in SBEE's distribution networks to the inadequacy of branch sections, excessively long lines exceeding the limits tolerated by standards, overloads on some HV / LV distribution transformers and the inefficiency of some voltage control devices. Most of the commercial losses are due to fraud on the electricity meters, errors in the reports of the measuring reducers, the existence of illegal connections, the drift often observed in the computer systems and the direct connection of public lighting lamps to LV networks without counting box.
Technical losses are inherent in the operation of networks and therefore can only be reduced while commercial losses can be avoided. In the SBEE distribution networks, the non-technical losses are greater than the other component, hence the need for operators to develop effective strategies for eradicating these losses, such as, the tracking of these from the source stations to the connections via HVA / HVA distribution stations and MV / LV distribution stations and the constitution of very strong anti-fraud systems.
Figure 1. Profile of loss rates on the SBEE networks.
The energy losses of the network in the different regions are significant as shown in Figure 2.
Figure 2. Rate of undistributed energies by department for the year 2017 [4].
With:
DRL1: Regional Direction of Littoral 1 DRL2: Regional Direction of Littoral 2 DRA: Regional Direction of Atlantique DROP: Regional Direction of Ouémé – Plateau DRZC: Regional Direction of Zou – Collines DRMC: Regional Direction of Mono - Couffo DRBA: Regional Direction of Borgou – Alibori DRATAD: Regional Direction of Atacora – Donga
The minimization of losses is therefore one of the improvement indicators of energy supply systems and operator performance. In fact, a 1% energy loss in a distribution network increases the company's operating cost by 2% in order to cover the expenses incurred by these losses [14].
3. Problem Formulation of the
Distribution Network Topology
Problem
The distribution networks are built in loops with opening points but operated in a radial topology to allow the effective functioning of the protection systems. Therefore, they are made of adjacent meshes but a few times independent. Indeed, when the meshes are independent, the number of possibilities of combinations of the opening switches is limited and with a simple exploration of all the possible diagrams, the operators manage to find easily optimal tie-switches which can reduce losses and improve protection plans. But the cases of the most real operation schemes are the adjacency of several meshes, and from which flow very complex network operation schemes. In this case, the number of possibilities is exponential, the search for optimal topologies becomes tedious and managers often use optimizers. As a result, optimizing a distribution network mathematically returns to finding the optimal objectives under constraints.
Optimizing the topology of a network then amounts to minimizing the objective function F (Y, Z, U) under the constraints of equalities and inequalities expressed by G (Y, Z, U) ≤0.
Y: Set of currents in the lines Z: Set of node voltages U: Set of tie-switches
3.1. Objective Functions and Constraints
a)Power losses reduction and voltage deviation
The reduction of power losses and voltage deviation on the busbars represents an economic and technical contests for the electricity companies. Thus, reducing the technical losses amounts to:
min f ∑ R (1)
min f ∑ (2)
with
Rl: resistance of branch l,
Pl: active power losses of branch l, Ql: reactive power losses of branch l, Vi: voltage at node i,
NL: Set of branches, N: Set of nodes,
!"# $% ! & limits of node voltages, '(
, specific voltage at node i. b)Constraints
i. 0,95 p. u 0 V20 1.05 p. u
ii. P 5 Q 7 S9:;
3.2. Radial Distribution Network Load Flow
Distribution networks are characterized by high R/X ratios and the traditional methods of power flow calculating widely known such as Newton Raphson, Gauss Seidel and Fast decoupled methods are not suitable for effectively solving the problems power flow problems in radial distribution networks.
The backward/forward sweep is one of load flow computation method which is developed and converges very well for radial distribution networks. It is based on the laws of ohm and Kirchhoff and can be considered from the family of iterative methods of power flow. This method is implemented on the Matlab platform and integrated into the optimal network reconfiguration algorithm [15].
4. Radial Network Reconfiguration
Using Ant Colony and Fuzzy Logic
Ants are social insects whose physical or behavioral characteristics have long fascinated researchers. Ant colony algorithms typically use the behavior of real ants [14] to solve combinatorial optimization problems. It can be reduced in search of the shortest path through graphs based on the behavior of the ants that in their displacement mark the way with glands contained in their abdomen called pheromones [16]. The amount of pheromone depends on the length of the path and the amount of food found. The pheromone
evaporates over time if others are deposited there. The path of pheromones leading to food sources will be more frequented by ants. The implementation process of this algorithm consists of the initialization steps, the implementation of the local update rule, the evaluation of the objective function and the application of the global update.
4.1. Implementation Process of Modified Ant Colony Algorithm (MACA)
MACA is an adaptation of ant algorithm and fuzzy logic in search of optimal radial topology from a basic configuration. This algorithm is based on the following principles:
1. tie-switches are considered as path branches to avoid; 2. a new radial configuration of the network is considered
as a set of unique paths between all cities (any node) for a reference city (source node).
The program developed for the reconfiguration is made of the following essential steps:
1. generation of tie-switches (branches as path to avoid through two given cities) and therefore a set of paths composed of electrical network lines
2. radiality criterion assessment of the new topology. 3. power flow analysis and technical performance
evaluation of new power grid topology.
The new approach of optimal reconfiguration seeking elaborated in this MACA paper is described by a main program "MACA".
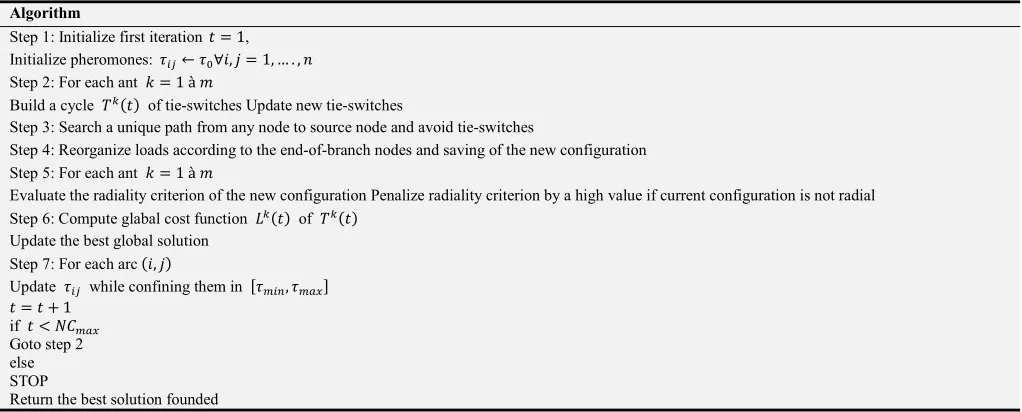
Table 1. Modified Ant Colony Algorithm (MACA).
Algorithm
Step 1: Initialize first iteration % 1, Initialize pheromones: < =← <?∀A, B = 1, … . , D Step 2: For each ant E = 1 à G
Build a cycle HIJ%K of tie-switches Update new tie-switches
Step 3: Search a unique path from any node to source node and avoid tie-switches
Step 4: Reorganize loads according to the end-of-branch nodes and saving of the new configuration Step 5: For each ant E = 1 à G
Evaluate the radiality criterion of the new configuration Penalize radiality criterion by a high value if current configuration is not radial Step 6: Compute glabal cost function LIJ%K of HIJ%K
Update the best global solution Step 7: For each arc JA, BK
Update < = while confining them in M<! &, <!"#N % = % + 1
if % < OP!"# Goto step 2 else STOP
Return the best solution founded
4.2. Simulation Parameters
Table 2 presents the main parameters tested with MACA for simulation. In the simulation process, the choice and adjustment of the parameters of the metaheuristic alogrithm is also very important in the quality of the solutions. The table shows the values of the parameters chosen for this work Indeed, A and B represent two parameters that control the importance of the relative intensity of pheromone on the tracks, Q is a constant that expresses the quality factor, Q1, Q2
are weighting coefficients of the objective functions and Γ is a penalty factor.
Table 2. Main parameters.
Parameters Values
Size of the colony Number of network branches
Number of iterations 100
Α 1
Β 2
Q 100
Parameters Values
Size of the colony Number of network branches
pMax 0,7
Ρ 0,05
R 0,7
R 0,3
Γ 000 (high value)
5. Simulation, Results and Discussions
The Modified Ant Colony Algorithm (MACA) is tested on standard IEEE 33-bus system and is applied on SBEE 41-bus real system.
5.1. Application of MACA on IEEE 33-bus Network
The 33-bus system is made of 32 closed switches and 5 tie-witches. Active and reactive loads are respectively evaluated at 3802.19 kW and 2694.66 kVAr with a voltage level of 12.66 kV.
The results of MACA applied to this network are presented in table 3:
It is observed that according to references [18] and [19], which found respective losses of 135.47 kW and 139.5 kW as a result of the simulation, MACA decreased these losses to 121.56 kW, a performance of 43.38%. Indeed, Jacob et al [18] developed an algorithm based on ant colonies to reconfigure a distribution network. The optimal switches they propose to open are 7-10-14-36-37 with a more vulnerable network voltage equal to 0.9342 pu compared to the results obtained by the application of MACA where the automatically selected switches are 13-10-5-27-18 with a lower network voltage equal to 0.9845pu. It is observed a significant improvement in the voltage of nearly 7.28% compared to the performance of the references [18] and [19] and whose voltage improvement is respectively only 2.29% and 3.27%.
Table 3. Comparison of configuration for 33-bus network.
Base config. [17] [18] [19] Proposed method (MACA)
Tie-switches 33 – 35 – 34 – 36 – 37 7 – 10 – 14 – 36 – 37 33 – 14 – 8 – 32 – 28 13 – 10 – 5 – 27 – 18
Active losses (kW) 214,72 135,47 139,5 121,56
! & (pu) 0,9128 (23) 0,9342 0,9437 (33) 0,9845 (12)
Voltage rate (%) 2,29 3,27 7,28
Losses rate (%) -- 36,9 35,03 43,38
From this table, it is also found that the active power losses have improved by 36.9% compared to the base case in reference [18] and 35.03% in the reference [19]. But concerning the optimization of the topology of the network 33 nodes, it is noted an improvement of the losses of 43,38%. It can then be deduced a better performance of the algorithm developed compared to references [18] and [19]. The reconfiguration of a radial distribution network is an effective and efficient tool to reduce the operating costs caused by the losses and the loss of voltage on the busbar.
These highly improving results prove the performance and efficiency of MACA, and also testify that it can improve significantly the continuity of service and reliability of distribution networks.
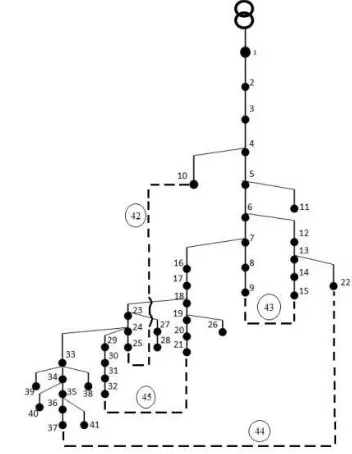
5.2. Application of MACA on SBEE HVA 41-bus System of Togba
The togba HVA network, whose basic topology is shown in figure 3, is made of a source station and 41 nodes with 4 tie-switches.
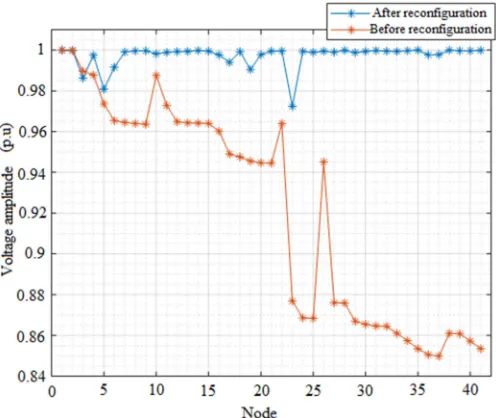
Figure 4 shows the voltage profiles on the busbars before and after reconfiguration and table 4 shows losses and voltage levels after reconfiguration. It is found that the voltage profiles experienced an improvement of 14.42% compared to the basic configuration. The selected optimal switches are 9 -24-31-36 with losses that went from 403. 38 kW (base case) to 148.97kW (after reconfiguration), a significant improvement of 63.06%. Reconfiguration based on the MACA technique has helped to perform, without any particular financial implications, the performance of unstable Togba network. The voltages of all nodes are in range as a result of the reconfiguration.
The optimal choices of opened switches in a network do not generate exploitation costs compared to the technical benefits they provide to the operators in terms of the quality of service improvement.
It is therefore highly recommended to automate the SBEE networks. The main purpose is to facilitate the reconfiguration of its topology in the event of defects on certain sections or in the periodic needs of topology optimization for performance enhancement. This automation will also reduce the undistributed energy, due for the most part to the too long intervention times of the operators of this network.
Figure 4. Voltage profiles before and after reconfiguration.
From these results, it is observed that the losses are significantly improved and reduced by 63.06% and the lowest voltage is found at node 23 with a value of 0.9724 pu. No node voltage has been exceeded the ranges recommended by the standards for HVA voltages on busbars.
Table 4. Reconfiguration results of real 41-bus networkof Togba.
Before reconfiguration After reconfiguration (MACA)
Tie-switches 42 – 43 – 44 – 45 9 – 24 – 31 – 36
Active losses (kW) 403,38 148,97
Lowest voltage (bus) 0,8498 pu (37) 0,9724 pu (23)
Rate of improvement of network state settings Losses 63,06%
Lowest voltages 12,60%
MACA performance computation duration 18,331 s
Number of iterations 71
Figure 5. Topology of 41-bus system after reconfiguration.
The reconfiguration of networks contributes to qualitatively improving the performance of power systems without the need for important investments. Indeed, it is urgent to ensure the reliability of opening points of this network to facilitate the optimization of its conduct.
Figure 5 shows the optimal topology of the SBEE 41-bus distribution network from MACA.
6. Conclusion
of the public authorities to protect the environment while limiting the negative old times caused by the construction of new fossil fuel plants on the climate, our method will be an efficient way for the electrical networks managers and to meet the requirements of the regulators of electrical systems in the context of the competition that has emerged and the liberalization of the energy sector.
The proposed MACA method for solving this complex combinatorial problem was tested on the standard 33-bus network and then on the actual SBEE 41-bus system. The technical performances, the computation duration and the speed of convergence obtained, clearly show the efficiency of this method, designed to solve problems of radial topology optimization. According to the results obtained, it appears that the reconfiguration of a distribution network is one of the efficient and effective resource to balance the loads on the HVA stations and decrease the operating costs. The optimization approach based on metaheuristic methods is very efficient and effective in increase of reliability of the electricity supply systems that will contribute to a best quality of life in a sustainable ecological context.
References
[1] H. K. Hazaa, H. H. Abdullah, M. H. Yasen, and S. S. Mustafa "Evaluation of electric energy losses in kirkuk distribution elecric system area", Iraqi J Electr Electron Eng, vol. 7, n° %12, pp. 144-150, 2011.
[2] B. Gotzig, «Recherche du schéma optimal d'exploitation électrique,» PhD Thesis, Institut National Polytechnique de Grenoble, 1997.
[3] A. Jain, A. R. Gupta, and A. Kumar, "An efficient method for D-STATCOM placement in radial distribution system", IEEE 6th India International Conference on Power Electronics (IICPE), pp. 1-6, 2014.
[4] DD/SBEE, «Rapport d'analyse des incidents sur le réseau HTA (Période de Juillet à Septembre),» oct. 2017.
[5] A. Merlin, «"Search for minimal-loss operating spanning tree configuration for an urban power distribution system",» Proc 5th PSCC, vol. 1, pp. 1-18, 1975.
[6] J. Li, "Reconfiguration of power networks based on graph-the-oretic algorithm", 2010.
[7] V. Tudor, "Optimal loss Reduction of distribution networks using a refined genetic algorithm", Sci. Bull. C Electr. Eng., vol. 72, n° %13, pp. 29-38, 2010.
[8] Nagy S. A. and I. S. IBRAHIM., "Network Reconfiguration for Loss Reduction in Electrical Distribution System Using Genetic Algorithm", Arab Journal of Nuclear Science and Applications, India Journal of Science and Technology, vol. 46, pp. 78-87, 2013.
[9] Vizhiy S. ARUUL, Santhi R. K. and Nachiappan ALAMELU, "Biogeography based Optimization for Multi-Objective Reconfiguration Problem in Distribution Networks", Indian Journal of Science and Technology, n° 19, pp. 48-52, 2016. [10] Tamer M. KHALIL SELIM, Alexander GORPINICH and Irena
WASIAK, “A selective particle swarm optimization for large scale practical distribution system reconfiguration", June 2015. [11] Tung TRAN, «"Distribution Network Reconfiguration Using One RankCucckoo Search Algorithm",» GMSARN International Journal, vol. 9, n° %111, 2016.
[12] Abhiraj T. K and P. Aravindhababu, "Dragonfly Optimization based Reconfiguration for Voltage Profile Enhancement in Distribution Systems", International Journal of Computer Application, vol. 158, n° %12, pp. 48-52, 2017.
[13] Abrar TANJUNG, "Reconfiguration of Power Supply System Distribution 20 kV PT PLN (Persero) Dumai Area Case", JOP Conference Series: Earth and Environmental Science, n° %1175, juil 2017.
[14] D. Shirmohammadi and H. W. Hong, "Reconfiguration of distribution networks for resistive line losses reduction", IEEE Trans. Power Deliv, vol. 4, n° %12, pp. 1492-1498, 1989. [15] A. Oloulade, A. Moukengue Imano, A. Vianou, and H.
Tamadaho,"Optimization of the number, size and placement of D-STATCOM in radial distribution network using Ant Colony Algorithm", 2018.
[16] H. B. Tolabi, M. H. Ali, and M. Rizwan, "Simultaneous reconfiguration optimal placement of D-STATCOM and photovolaic array in a distribution system based on fuzzy-ACO approch", IEEE Trans Sustain Energy, vol. 6, n° %11, pp. 210-218, 2015.
[17] A. Oloulade, A. Moukengue Imano, A. Vianou, and H. Tamadaho, "Optimzation multi-critère du placement d'un D-STATCOM dans un réseau de distribution par les Colonies de Fourmis", 2018.
[18] R. K. Jacob et V. Malathi, "Optimization Reconfiguration of Power Distribution Systems", 2015.
![Figure 2. Rate of undistributed energies by department for the year 2017 [4].](https://thumb-us.123doks.com/thumbv2/123dok_us/985307.1598160/3.595.52.279.78.297/figure-rate-undistributed-energies-department-year.webp)