http://www.sciencepublishinggroup.com/j/ajnc doi: 10.11648/j.ajnc.20190802.11
ISSN: 2326-893X (Print); ISSN: 2326-8964 (Online)
Performance Analysis of an Improved Load Balancing
Algorithm in Cloud Computing
Abdulrahman Abdulkarim
1, *, Ishaq Muhammed
1, Lele Mohammed
1, Abbas Babayaro
21Department of Computer Science, Faculty of Science, Federal Polytechnic, Bauchi, Nigeria
2
Department of Information and Communication Technology, Bauchi State University Gadau, Bauchi, Nigeria
Email address:
*Corresponding author
To cite this article:
Abdulrahman Abdulkarim, Ishaq Muhammed, Lele Mohammed, Abbas Babayaro. Performance Analysis of an Improved Load Balancing Algorithm in Cloud Computing. American Journal of Networks and Communications. Vol. 8, No. 2, 2019, pp. 47-58.
doi: 10.11648/j.ajnc.20190802.11
Received: May 20, 2019; Accepted: July 31, 2019; Published: August 16, 2019
Abstract:
Cloud computing consists of a cluster of computing resources that are delivered over a network, which is accomplished by utilizing virtualization technologies to consolidate and allocate resources suitable for various different software applications. Therefore, an efficient task scheduling in the cloud would be required to improve the performance of the cloud. In this paper, implementation of a model that seeks to improve load balancing algorithm for virtual machine load balancing was performed using simulations. A method by which average burst time was used as the time quantum for the round robin load balancing algorithm to achieve more effective time sharing. Results obtained from the simulations along with performance evaluation carried out shows response time and data center processing time achieved using the improved model is slightly minimal compared to the other algorithms. This shows more effective load balancing by achieving a better overall throughput.Keywords:
Cloud Computing, Round Robin, Virtual Machine (VM), Load Balancing, Burst Time, Time Quantum, Response Time1. Introduction
Cloud Computing is the collection of large number of resources like hardware and software that are provided by the cloud providers to the consumers as a service over the internet. In cloud computing every task requires to be executed by available resource to achieve minimum waiting time, reduce makespan and maximum utilization of resources. Considering the growing importance of cloud, finding new way to improve cloud services is an area of concern and research focus. The aim of task scheduling is to assign tasks to available resources such that the overall time compulsory to execute all tasks is minimized. Round Robin scheduling Algorithm is one of the task scheduling algorithm mostly used in cloud computing. The reason for this is that round robin algorithm employs time-sharing, giving each job a time slot or quantum thus result to be less complexity and maintains fairly load balancing [6].
Although, round robin scheduling algorithm is one of the
standard and widely used algorithm in cloud computing, it has a potential drawback. The performance level of round robin scheduling on cloud depends on the slice/quantum time [11]. An improved round robin scheduling approach was selected for VM load balancing on the cloud environment by assigning slice/time quantum using average burst time [1].
2. Related Work
Previous work on scheduling algorithms on cloud computing were reviewed, and some of the important considerations in performance comparison considered by the previous work are being identified in this section.
A model that focused to improving the round robin load balancing algorithm for virtual machine load balancing on cloud to address the issue of time quantum so as to effectively utilize the principle of time sharing which may lead to better resource utilization. The improvement was the addition of a technique to get a specified time quantum for an effective time sharing principle, time quantum is set to be equal to the average of burst time of requests/tasks for context switching [1].
The authors proposed a hybrid algorithm based on Equally Spread Concurrent Execution and Throttled Algorithms. They took the advantages of both the algorithms and consider the average response time and earliest finish time as evaluation parameters to achieve less processing time and response time. A simulation was carried out on Cloudsim based on combining the two algorithms. Parameters considered are the response time and processing time. From the simulation results, they found that the proposed hybrid algorithm took less processing time and response time. But the algorithm works good when no fault occurs in VM [9].
A method was proposed for load rebalancing on cloud based on Honeybee Foraging Algorithm and Active clustering algorithm. By using honeybee foraging algorithm, they would improve the average execution time and reduction in waiting time of tasks. Active clustering used for increase in throughput by utilization of resources. They proposed the integration of ant colony optimization to initiate the service load distribution under cloud computing architecture. The pheromone update mechanism has been proved as an efficient and effective tool to balance the load. Their modification supports to minimize the makespan of the cloud computing based services and portability of servicing, requests also have been converged using the ant colony optimization technique [2].
This work has proposed a task scheduling algorithm based on task length and speed of VMs. They have designed a rank based task scheduler which effectively utilizes resources and provides high performance. This algorithm has been tested using CloudSim toolkit with varying lengths of tasks and varying MIPS (speed) of VMs. The results have shown that Rank based task scheduler gives high performance than existing space-shared and time shared task schedulers [4].
A proposed a virtual machine-level load balancing algorithm based on Throttled algorithm, aims to improve the average response time and average processing time of the system in the cloud based on further optimizing the cloud manager in the load balancing algorithm by adding some parameters such as the expected completion time of each resource (VM) with lists of requests coming up. Simulations was carried out on Cloudsim using 30 cloudlets, 1 datacenter and 3 VM. Parameters such as the list of workloads of the system (Cloudlet), the queue list that has been submitted for each virtual machine, percentage of utilization of virtual
machine, the expected completion time were used. From simulation results and comparison charts between average execution time and average response time of Throttled algorithm and the proposed algorithm, the average execution time and average response time of the proposed algorithm has been improved than Throttled algorithm [8].
An approach for scheduling workflow tasks over the available resources of cloud that minimized the execution time and execution cost under the given deadline and budget constraint was developed [10]. In their work, workflow tasks are executed in order of their priority which is basically computed using bottom level. The assigned priority is then used to initialize the Particle Swamp Optimization (PSO). After assigning the priority the tasks are sorted according to the descending order of bottom level. The tasks are then sent to different processors according to their order of execution for completing the workflow application. Experimented results show that this algorithm has a promising performance when compared with PSO [10].
This work has proposed a task scheduling technique for cloud computing. A new strategy of task scheduling is proposed in view of the aggregate order for allocation of resource to enhance the algorithm of Min-Min. The main concentration is on minimizing the aggregate executing time (makespan) of scheduling of task and expanding the utilization of assets. The results of their work shows that the proposed approach allows more versatile assets distribution for free occupations booking in the distributed computing environment [3].
Also, a work on load balancing in cloud computing environments using honey bee behavior, the proposed method achieves good load balancing across virtual machines which maximizes the throughput. Load is balanced according to the priorities of tasks so that waiting time of tasks in the queue is minimal. Compared to other traditional methods, this method is effective and overall execution time is improved [5].
In a new proposed algorithm which is using benefits of both Enhanced Max-Min and Max-Min algorithms. There is a limitation of Max-Min which is sometimes large task is mapped to the slow resource. This increases the total length of scheduling [12]. But in proposed algorithm possibility of scheduling long length tasks to the slow resource is reduced. The Proposed algorithm is tested by using five workflows named Maontage50, Montage10, CyberShake30, CyberShake50, and Inspiral50. One data center, one scheduler and five virtual machines are used. The software used for this experiment is Eclipse Java Neon and WorkflowSim1.0. Results of their evaluations show that proposed algorithm completes tasks execution with lower makespan and higher performance as compared to scheduling algorithms Max-Min and FCFS. Performance of proposed algorithm is around 8 percentages better than Max-Min algorithm and around 27 percentages better than FCFS for 5 virtual machines. Overall result shows that the proposed algorithm performs better than Max-Min algorithm when it comes to makespan [12].
request parameters in the proposed algorithm, Enhanced Honeybee Inspired load balancing algorithm is a modification of existing proposed algorithm which stabilities the load based on the priority of the responsibilities and the resource obligation by calculating the capacity of virtual machines [13].
Authors in this work proposed two hybrid algorithms, namely a combination of fuzzy logic and PSO algorithm and a combination of simulated annealing and PSO algorithm, for improving task scheduling performance in cloud computing. A waiting time optimization algorithm based on the PSO algorithm is used to minimize task waiting time. The objectives of the two hybrid algorithms are to utilize resources, optimize performance metrics, minimize makespan, and achieve good load balancing [14].
A load balancing method based on constraint measure was presented, the capacity and load of each VM are initially computed. If the load is larger than the threshold value, then the load balancing algorithm allocates tasks to the VMs. The deciding factor of VMs is calculated, and the loads of VMs are checked by the algorithm. The selection factor for each task is then calculated, and the task with a better selection factor than those of others is allocated to the VMs [15].
An overview of related works on various task scheduling algorithms revealed that there are still lots of improvements that can be carried out. The major issues being observed on most proposed task scheduling algorithms are their ability to achieve better response time, makespan, cost, resource allocation, and energy consumption. Therefore, this work has considered the work by [1] and focused to implement the model in other to carry out a performance analysis of the model based on other algorithms.
3. Methodology
3.1. Performance Parameters
The performance parameters considered for the implementation of this work are the response time, data center processing time and throughput. These parameters would be evaluated based on the proposed model [1], round robin load balancing algorithm and the throttled algorithm for performance analysis.
3.1.1. Response Time
The elapsed time between the end of an inquiry or demand on a computer system and the beginning of a response.
3.1.2. Data Center Processing Time
The exact time taken to complete the execution of a given task in the data center. The ultimate goal of any scheduling algorithm is minimizing the processing time.
3.1.3. Throughput
It is the number of task executed in the fixed interval of time. To improve the performance of the system, throughput should be high.
3.2. Simulation Setup
In this work, Java Programming Language was used for
implementing the proposed algorithm. CloudAnalyst developed using CloudSim packages was used on NetBeans IDE to carry out the simulations.
Simulations were performed on the CloudAnalyst toolkit being deployed with one data center and varying the number of virtual machines (VM) and userbase (UB) as adopted by [7] where the parameter values are as follows:
Table 1. Simulation Parameter values.
Parameter Values
Number of users per UB 10,000
Number of requests per user 6000
VM image size 10,000
VM memory 1024MB
VM bandwidth 1000
Data Centre-Architecture X86
Data Centre-OS Linux
Data Centre-No of machines 5
Data Centre-memory per machines 2048MB
Data Centre-storage per machines 100,000,000MB
Data Centre-available BW per machines 1,000,000 Data Centre-no. of processor per machines 4
Speed of processor 10000
Service Broker Policy Optimise Response Time
Data Centre-VM policy Time Shared
4. Results and Discussion
4.1. Response Time Results
Using six instances to get the expected results, three simulations were carried out in each instance based on the improved algorithm, the round robin algorithm by [7], and the throttled algorithm respectively. The response time at each instance is presented as follows:
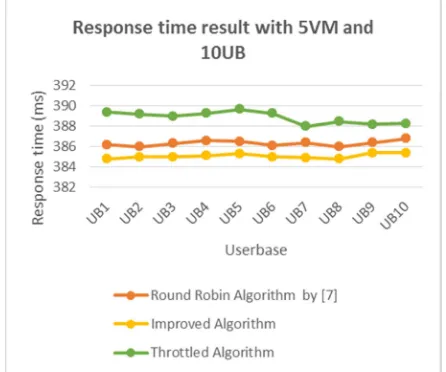
4.1.1. Response Time Results with 5 Virtual Machines and 10 Userbase
The response time of each userbase (UB) obtained using the round robin algorithm by [7], the improved algorithm and the throttled algorithm is shown in table 2 below. The chart representation of the result is shown in figure 1.
Table 2. Response time result with 5VM and 10UB.
Userbase Round Robin Algorithm by [7].
Response time (ms)
Improved Algorithm. Response time (ms)
Throttled Algorithm. Response time (ms)
UB1 386.2 384.8 389.4
UB2 386 385 389.2
UB3 386.3 385 389
UB4 386.6 385.1 389.3
UB5 386.5 385.3 389.7
UB6 386.1 385 389.3
UB7 386.4 384.9 388
UB8 386 384.8 388.5
UB9 386.4 385.4 388.2
UB10 386.8 385.4 388.3
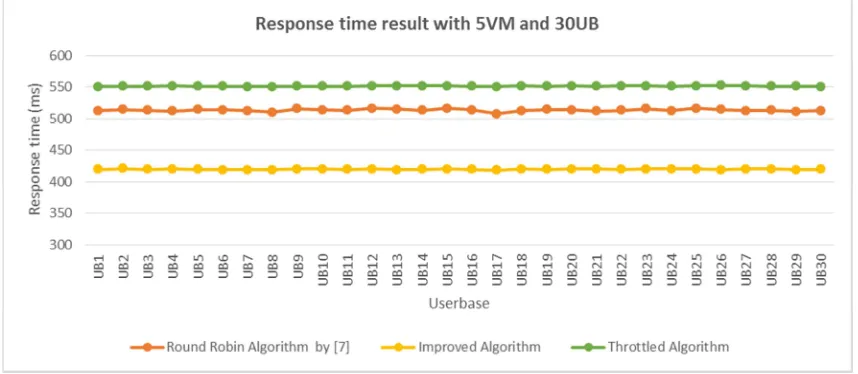
4.1.2. Response Time Results with 5 Virtual Machines and 30 Userbase
At this instance, the number of userbase was increased to 30 for the simulations. The response time for each userbase obtained from the simulations is shown in table 3 along with the chart representation in figure 2.
Figure 2. Response time result with 5VM and 30UB.
Table 3. Response time result with 5VM and 30UB.
Userbase Round Robin Algorithm by [7]. Response time (ms)
Improved Algorithm. Response time (ms)
Throttled Algorithm. Response time (ms)
UB1 512.7 419.8 550.6
UB2 514.2 420.6 551.3
UB3 513.5 419.8 551
UB4 512.1 420.2 551.7
UB5 514.2 419.6 551.4
UB6 513.9 419 551.1
UB7 512.7 418.8 550.8
UB8 510.2 418.7 550.6
UB9 515.8 420.2 551.3
UB10 514.1 420.2 551.2
UB11 513.4 419.6 550.9
UB12 516.6 420.1 551.7
UB13 514.8 419.2 552.1
UB14 513.4 419.8 552
UB15 516.3 419.9 551.9
UB16 513.9 419.8 551.3
UB17 507.4 418.5 550.7
UB18 512.6 420.2 551.6
UB19 514.6 419.4 551.3
UB20 513.8 420 551.8
UB21 511.7 420.5 551
UB22 513.4 419.4 551.7
Userbase Round Robin Algorithm by [7]. Response time (ms)
Improved Algorithm. Response time (ms)
Throttled Algorithm. Response time (ms)
UB24 512.4 420.4 551.1
UB25 516.3 420.5 551.8
UB26 514.4 419.1 552.2
UB27 512.3 420.1 551.6
UB28 513 420.5 551.3
UB29 511.2 419.2 550.9
UB30 512.4 419.7 550.7
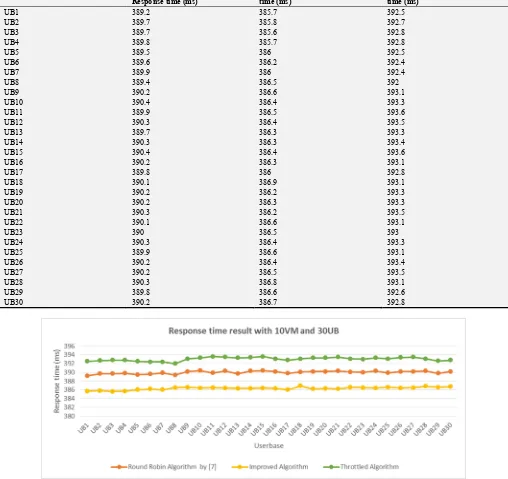
4.1.3. Response Time Results with 10 Virtual Machines and 30 Userbase
At this instance, the number of virtual machine was increased to 10 for the simulations keeping the number of userbase at 30. The response time for each userbase obtained from the simulations is shown in table 4 along with the chart representation in figure 3.
Table 4. Response time result with 10VM and 30UB.
Userbase Round Robin Algorithm by [7].
Response time (ms)
Improved Algorithm. Response time (ms)
Throttled Algorithm. Response time (ms)
UB1 389.2 385.7 392.5
UB2 389.7 385.8 392.7
UB3 389.7 385.6 392.8
UB4 389.8 385.7 392.8
UB5 389.5 386 392.5
UB6 389.6 386.2 392.4
UB7 389.9 386 392.4
UB8 389.4 386.5 392
UB9 390.2 386.6 393.1
UB10 390.4 386.4 393.3
UB11 389.9 386.5 393.6
UB12 390.3 386.4 393.5
UB13 389.7 386.3 393.3
UB14 390.3 386.3 393.4
UB15 390.4 386.4 393.6
UB16 390.2 386.3 393.1
UB17 389.8 386 392.8
UB18 390.1 386.9 393.1
UB19 390.2 386.2 393.3
UB20 390.2 386.3 393.3
UB21 390.3 386.2 393.5
UB22 390.1 386.6 393.1
UB23 390 386.5 393
UB24 390.3 386.4 393.3
UB25 389.9 386.6 393.1
UB26 390.2 386.4 393.4
UB27 390.2 386.5 393.5
UB28 390.3 386.8 393.1
UB29 389.8 386.6 392.6
UB30 390.2 386.7 392.8
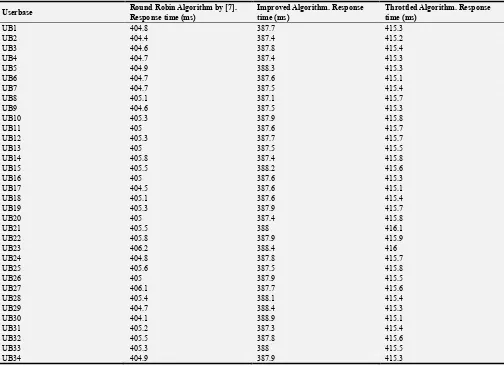
4.1.4. Response Time Results with 10 Virtual Machines and 40 Userbase
At this instance, the number of userbase was increased to 40 for the simulations keeping the number of virtual machines at 10. The response time for each userbase obtained from the simulations is shown in table 5 along with the chart representation in figure 4.
Figure 4. Response time result with 10VM and 40UB.
Table 5. Response time result with 10VM and 40UB.
Userbase Round Robin Algorithm by [7].
Response time (ms)
Improved Algorithm. Response time (ms)
Throttled Algorithm. Response time (ms)
UB1 404.8 387.7 415.3
UB2 404.4 387.4 415.2
UB3 404.6 387.8 415.4
UB4 404.7 387.4 415.3
UB5 404.9 388.3 415.3
UB6 404.7 387.6 415.1
UB7 404.7 387.5 415.4
UB8 405.1 387.1 415.7
UB9 404.6 387.5 415.3
UB10 405.3 387.9 415.8
UB11 405 387.6 415.7
UB12 405.3 387.7 415.7
UB13 405 387.5 415.5
UB14 405.8 387.4 415.8
UB15 405.5 388.2 415.6
UB16 405 387.6 415.3
UB17 404.5 387.6 415.1
UB18 405.1 387.6 415.4
UB19 405.3 387.9 415.7
UB20 405 387.4 415.8
UB21 405.5 388 416.1
UB22 405.8 387.9 415.9
UB23 406.2 388.4 416
UB24 404.8 387.8 415.7
UB25 405.6 387.5 415.8
UB26 405 387.9 415.5
UB27 406.1 387.7 415.6
UB28 405.4 388.1 415.4
UB29 404.7 388.4 415.3
UB30 404.1 388.9 415.1
UB31 405.2 387.3 415.4
UB32 405.5 387.8 415.6
UB33 405.3 388 415.5
Userbase Round Robin Algorithm by [7]. Response time (ms)
Improved Algorithm. Response time (ms)
Throttled Algorithm. Response time (ms)
UB35 405.4 387.6 415.4
UB36 405.4 387.4 415.2
UB37 405.4 388.2 415.2
UB38 405.3 387.7 415.6
UB39 406.3 388.1 415.7
UB40 406 387.8 415.5
4.1.5. Response Time Results with 15 Virtual Machines and 40 Userbase
At this instance, the number of virtual machine was increased to 15 for the simulations keeping the number of userbase at 40. The response time for each userbase obtained from the simulations is shown in table 6 along with the chart representation in figure 5.
Figure 5. Response time result with 15VM and 40UB.
Table 6. Response time result with 15VM and 40UB.
Userbase Round Robin Algorithm by [7].
Response time (ms)
Improved Algorithm. Response time (ms)
Throttled Algorithm. Response time (ms)
UB1 386.6 386.1 388.6
UB2 386.9 385.7 388.8
UB3 387.4 386.6 389
UB4 387.3 386 388.9
UB5 387.5 386.6 389.1
UB6 387.1 386.4 388.8
UB7 387.1 385.9 388.6
UB8 386.8 386 388.5
UB9 387.4 386.2 388.9
UB10 387 386.5 388.7
UB11 387.3 386.2 388.4
UB12 387.2 386.6 388.5
UB13 386.9 385.9 388.3
UB14 386.6 386 388.3
UB15 387.7 386.6 389.2
UB16 387.7 386.3 388.9
UB17 387 386.3 388.5
UB18 387 386.4 388.6
UB19 387.1 386.4 388.5
UB20 387.2 386.4 388.6
UB21 387.4 386.6 388.6
UB22 386.9 386.5 388.3
UB23 387.7 386.7 388.8
UB24 387.2 386.5 388.7
UB25 387 386.7 388.5
UB26 387.4 386.5 388.9
UB27 387.6 386.5 388.8
Userbase Round Robin Algorithm by [7]. Response time (ms)
Improved Algorithm. Response time (ms)
Throttled Algorithm. Response time (ms)
UB29 387.7 387 389
UB30 387.3 386.5 388.6
UB31 387.3 386.1 388.4
UB32 387 386.3 388.5
UB33 387.3 387 388.7
UB34 387.4 386.8 388.7
UB35 387.1 386.5 388.5
UB36 387.4 386.4 388.5
UB37 387.6 386.5 388.7
UB38 387.5 386.6 388.4
UB39 387.6 386.9 388.8
UB40 387.4 386.3 388.6
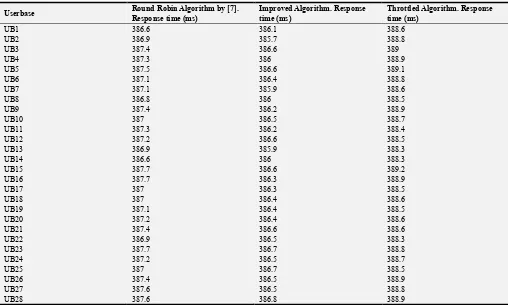
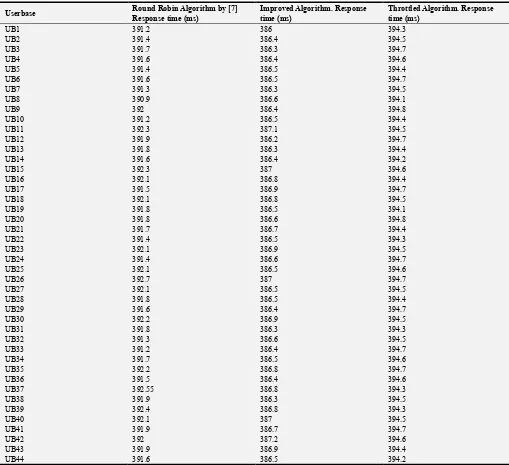
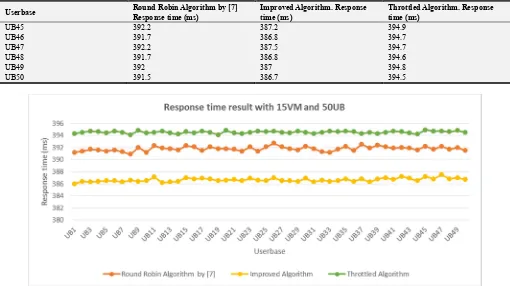
4.1.6. Response Time Results with 15 Virtual Machines and 50 Userbase
At this instance, the number of userbase was increased to 50 for the simulations keeping the number of virtual machines at 15. The response time for each userbase obtained from the simulations is shown in table 7 along with the chart representation in figure 6.
Table 7. Response time result with 15VM and 50UB.
Userbase Round Robin Algorithm by [7]
Response time (ms)
Improved Algorithm. Response time (ms)
Throttled Algorithm. Response time (ms)
UB1 391.2 386 394.3
UB2 391.4 386.4 394.5
UB3 391.7 386.3 394.7
UB4 391.6 386.4 394.6
UB5 391.4 386.5 394.4
UB6 391.6 386.5 394.7
UB7 391.3 386.3 394.5
UB8 390.9 386.6 394.1
UB9 392 386.4 394.8
UB10 391.2 386.5 394.4
UB11 392.3 387.1 394.5
UB12 391.9 386.2 394.7
UB13 391.8 386.3 394.4
UB14 391.6 386.4 394.2
UB15 392.3 387 394.6
UB16 392.1 386.8 394.4
UB17 391.5 386.9 394.7
UB18 392.1 386.8 394.5
UB19 391.8 386.5 394.1
UB20 391.8 386.6 394.8
UB21 391.7 386.7 394.4
UB22 391.4 386.5 394.3
UB23 392.1 386.9 394.5
UB24 391.4 386.6 394.7
UB25 392.1 386.5 394.6
UB26 392.7 387 394.7
UB27 392.1 386.5 394.5
UB28 391.8 386.5 394.4
UB29 391.6 386.4 394.7
UB30 392.2 386.9 394.5
UB31 391.8 386.3 394.3
UB32 391.3 386.6 394.5
UB33 391.2 386.4 394.7
UB34 391.7 386.5 394.6
UB35 392.2 386.8 394.7
UB36 391.5 386.4 394.6
UB37 392.55 386.8 394.3
UB38 391.9 386.3 394.5
UB39 392.4 386.8 394.3
UB40 392.1 387 394.5
UB41 391.9 386.7 394.7
UB42 392 387.2 394.6
UB43 391.9 386.9 394.4
Userbase Round Robin Algorithm by [7] Response time (ms)
Improved Algorithm. Response time (ms)
Throttled Algorithm. Response time (ms)
UB45 392.2 387.2 394.9
UB46 391.7 386.8 394.7
UB47 392.2 387.5 394.7
UB48 391.7 386.8 394.6
UB49 392 387 394.8
UB50 391.5 386.7 394.5
Figure 6. Response time result with 15VM and 50UB.
4.1.7. Overall Response Time
The overall response time was obtained for all instances. Table 8 shows the overall response time obtained from the simulations at each instance.
Table 8. Overall Response Time.
Simulation Round Robin Algorithm by [7]
Response time (ms)
Improved Algorithm. Response time (ms)
Throttled Algorithm. Response time (ms)
S1 386.8 385.4 388.9
S2 513.4 419.8 551.4
S3 389.9 386.3 393
S4 405.2 387.8 415.5
S5 387.3 386.1 388.7
S6 391.8 386.6 394.5
4.1.8. Data Center Processing Time
The data center processing time was also obtained in all the simulations carried out. The simulations were based on using the round robin load balancing algorithm by [7], the improved algorithm and the throttled algorithm. Results obtained from the simulations are shown in table 9 along with a chart representation show in figure 8.
Table 9. Data Center Processing Time.
Simulation Round Robin Algorithm by [7].
Processing time (ms)
Improved Algorithm. Processing time (ms)
Throttled Algorithm. Processing time (ms)
S1 81.9 80.6 83.7
S2 207.9 114.5 247.3
S3 84.6 80.7 87.8
S4 99.8 81.9 110.2
S5 81.5 80.5 83.4
S6 86.1 80.6 88.3
Figure 8. Data Center Processing Time.
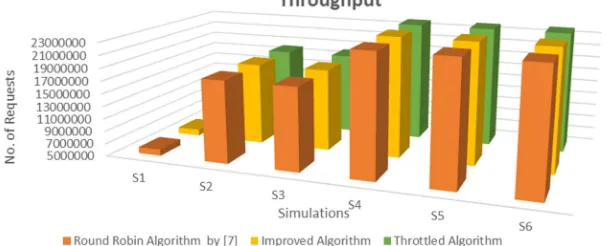
4.1.9. Throughput
At the end of every successful simulation, total number of executed request is being displayed. Table 10 shows the number of requests executed from the simulations performed using the round robin load balancing algorithm by [7], the improved algorithm and the throttled algorithm.
Table 10. Throughput result.
Simulation Round Robin Algorithm by [7].
Number of request
Improved Algorithm. Number of request
Throttled Algorithm. Number of request
S1 6,000,600 6,000,664 6,000,555
S2 17,998,663 17,999,270 17,997,999
S3 17,999,270 17,999,383 17,999,190
S4 23,999,463 23,999,666 23,999,330
S5 23,999,660 23,999,696 23,999,580
S6 30,000,193 30,000,488 30,000,009
Figure 9 shows the chart representation of the throughput simulations result at each instance respectively.
4.2. Discussion
In this work, a total of eighteen simulations were performed. The simulation is being categorized to six instances according to varying number of virtual machines and userbases. At each instance, three simulations were performed each for the round robin load balancing algorithm by [7], the improved algorithm and the throttled algorithm to obtain the response time, data center processing time and the throughput. This section would discuss the results of the simulations obtained as shown in the previous section.
4.2.1. Discussion of the Response Time Result
At the first instance, simulations were performed using 5 virtual machines and 10 userbase. The result shows that using the improved algorithm for the load balancing has achieved minimal response time for each userbase compared to the round robin load balancing algorithm by [7] and the throttled algorithm. The response time for each userbase gotten at the second instance when the number of userbase was increased from 10 to 30 also shows that the improved algorithm achieved the lowest response time when used as the load balancing algorithm.
At the third instance, the number of virtual machine was increased from 5 to 10 leaving the number of userbase at 30. The result obtained also shows that the minimum response time was achieved for the improved algorithm. When the number of userbase was increased from 30 to 40 in the fourth instance, the response time for each userbase obtained from using the algorithms shows that the improved algorithm has the lowest response time among the other algorithms.
In each simulation, an overall response time for all the userbases is being obtained. Table 8 shows the overall response time obtained at each instance. The results show that at each instance, using the improved algorithm as the load balancing algorithm always achieves the response time with the lowest value. Therefore, it shows that the improve algorithm would slightly perform better than the round robin load balancing algorithm by [7] and the throttled algorithm as a load balancing algorithm in the cloud environment.
4.2.2. Discussion of Data Center Processing Time Result
According to the results obtained from the simulations, it shows that at every instance, the improved algorithm achieves the lowest processing time. Therefore, with the series of simulations carried out, it was found out that using the improved algorithm for the load balancing would always achieve a better processing time for the data center compared to the round robin load balancing algorithm by [7] and the throttled algorithm.
4.2.3. Throughput
At the end of every completed simulation, the total number of executed requests are obtained. The result shows the number of executed requests in all the instances of the simulations performed. It was observed that more number of requests are being executed using the improved algorithm for
load balancing in all the instances of the simulations.
5. Conclusion
This paper is an implementation of a model proposed by [1], where by simulations were performed to implement the improved algorithm in which a performance evaluation was carried out based on response time, data center processing time and overall throughput for the improved algorithm, the round robin load balancing algorithm by [7] and the throttled algorithm. From the evaluation carried out and the results obtained, it shows that the improved algorithm would result to more effective load balancing by achieving a minimal response time of user base tasks, minimal data center processing time, increase overall throughput and therefore results to better resource utilization on the cloud.
References
[1] Abdulkarim, A., Boukari, S., Muhammed, I., & Ahhmed, F. A. (2018). An Improved Round Robin Load Balancing Algorithm in Cloud Computing Using Average Burst Time. International Journal of Scientific & Engineering Research, Volume 9, Isuue 3, 1495-1502.
[2] Aggarwal, R., & Gupta, L. (2017). Load Balancing in Cloud Computing. International Journal of Computer Science and Mobile Computing, Volume 6, Issue 6, 180-186.
[3] Bey, K. B., Benhammadi, F., & Benaissa, R. (2015). Balancing Heuristic for Independent Task Scheduling in Cloud Computing. 12th International Symposium on Programming and Systems, 7-12.
[4] Ettikyala, K., & Latha, Y. N. (2016). Rank Based Efficient Task Scheduling for Cloud Computing. IEEE International Conference on Data Mining and Advanced Computing, 343-346.
[5] Krishna, P. V. (2013). Honey Bee Behavior Inspired Load Balancing of Task in Cloud Computing Environments. Applied Software Computing, 2292-2303.
[6] Mathew, T., Sekaran, K. C., & Jose, J. (2014). Study and Analysis of Various Task Scheduling Algorithm in Cloud Computing Environment. International Conference on Advances in Computing, 658-664.
[7] Nusrat, P., Amit, A., & Ravi, R. (2014). Round Robin Approach for VM Load Balancing Algorithm in Cloud Computing Environment. Internation Journal of Advanced Research in Computer Science and Software Engineering, 34-39.
[8] Phi, N. X., & Hung, T. C. (2017). Load Balancing Algorithm to Improve Response Time on Cloud Environment. International Journal on Cloud Computing: Services and Architecture, Volume 7, No. 6, 1-12.
[10] Selvarani, S., & Sadhasivam, G. S. (2010). Improved cost-based algorithm for task scheduling in cloud computing. Computational Intelligence and computing research, 1-5.
[11] Zannon, N., & Rawshdeh, D. (2015). STASR: A New Task Scheduling Algorithm for Cloud Environment. Network Protocols and Algorithms (pp. 81-95). Macrothink Institude.
[12] Rani, P., & Nagpal, P. (2017). Optimized Task Scheduling Algorithm for Cloud Computing Environment. International Journal of Emerging Trends & Technology in Computer Science, Volume 6, Issue 5, 39-47.
[13] George, M. S., Das, K. C. N., & Pushpa, B. R. (2017). Enhanced honeybee inspired load balancing algorithm for cloud environment. 2017 International Conference on Communication and Signal Processing (ICCSP). doi: 10.1109/iccsp.2017.8286670.
[14] Kumar, A. S.; Venkatesan, M. Task scheduling in a cloud computing environment using HGPSO algorithm. Cluster Comput. 2018, 1–7.