X i a o y a n g Y a n g 9 Y u t a k a Ishimaru 9 I k u h o Iida H i r o y u k i U r a k a m i
Application of modal analysis by transfer function to nondestructive testing
of wood h determination of localized defects in wood by the shape of the
flexural vibration wave
Received: July 26, 2001 / Accepted: September 5, 2001
Abstract This study was intended to detect nondestruc- tively some defects such as knots and grain deviations in w o o d using modal analysis. The shapes of flexural vibration waves at the first m o d e generated by the tapping of w o o d e n beams were determined using the transfer function. The wave shapes obtained were c o m p a r e d with the theoretical wave shape for a uniform material; and the possibility of detecting defects in w o o d was examined. The results are summarized as follows: (1) T h e shapes of flexural vibration waves at the first m o d e of w o o d e n beams free of defects coincided almost completely with the theoretical wave shape. (2) The shapes of flexural vibration waves of w o o d e n beams containing defects such as knots clearly differed from the theoretical wave shape, especially near the defect. (3) Based on these results, it should be possible to detect the presence of defects and to determine their location in wood. Key words Modal analysis - Transfer function 9 Non- destructive test. Flexural vibration 9 Defect
Introduction
If the elasticity and strength of w o o d for structural uses can be estimated nondestructively with high accuracy by apply- ing a small deformation or vibration to a w o o d sample, the confidence of w o o d for structural uses will increase; more- over, various woods can be m o r e appropriately utilized
X. Yang 9 Y. Ishimaru 9 I. Iida. H. Urakami
Laboratory of Wood Technology, Faculty of Agriculture, Kyoto Prefectural University, Kyoto 606-8522, Japan
Tel. +81-75-703-5637; Fax +81-75-703-5639 e-mail: [email protected]
Part of this report was presented at the 49th Annual Meeting of the Japan Wood Research Society, Tokyo, April 1999. This article is trans- lated from the Japanese edition published in Mokuzai Gakkaishi Vol. 47, No. 4, 2001
according to their elasticity and strength. Therefore, it is useful for the forest industry that a w o o d ' s elasticity and strength be easily estimated with high accuracy by non- destructive testing.
A large n u m b e r of nondestructive methods for testing w o o d properties such as elasticity and strength have been studied, z and m a n y results obtained by the vibrational m e t h o d (i.e., stress waves generated by tapping and ultra- sonic longitudinal waves) have been reported. Most studies have showed the relation between the resonance frequency of longitudinal or flexural vibration and the average elastic modulus of the wood. 2 However, even if the elasticity and the strength of w o o d used for building or construction as whole can be estimated in terms of the resonance fre- quency, the elasticity and the strength of partial defects such as decays or knots cannot be estimated. Thus, in previous studies nondestructive vibration tests were used for uniform w o o d 3 and the average elasticity and strength of whole w o o d containing defects were studied, 4 but there has been no investigation of the elasticity or strength of partial de- fects such as knots in the wood. Defects such as knots are c o m m o n l y present in wood, so it is difficult to avoid the influence of such defects on w o o d ' s elasticity or strength, and the elasticity or strength of the defects is also important. F r o m these viewpoints, a m e t h o d for detecting defects easily and estimating the elasticity or strength of the defec- tive parts with high accuracy is necessary.
284
Materials and methods
Materials
The wood beams were cut from a sugi
(Cryptomeria
japonica)
log from Miyamacho, Japan; the tree was 76 years old with a diameter of 130cm at breast height. Twelve wood beams with a dimension of 100 (L) • 4 (R) • 4 (T) cm were cut from air-dried sapwood and heartwood. Three kinds of wood beams - a uniform straight grain beam, a b e a m con- taining a knot, and a b e a m containing grain deviation near a knot - were prepared. These beams were stored in an air- conditioned room at 20~ and 65% relative humidity (RH) for at least 4 weeks. The wood density after conditioning ranged from 0.32 to 0.38g/cm 3, and the moisture content measured by a radiofrequency resistance-type moisture meter (CAS Electronic Co.) ranged from 7.9% to 8.5%.Transfer function
When a force is applied to a beam, its response
x(t)
can bedescribed by a convolution integral with the force
f(t)
anddynamic properties
h(t)
as shown in Eq. (1) as a function oft i m e ]
x(t) = f~k(r)f(t- r)dr
(1)When this relation is converted to a function of fre- quency using the Fourier transform, it can be described by
a simpler equation with the force
F(f),
the responseX(f),
and the dynamic properties
H(f)
as follows:x ( s ) :
H(S).F(/)
(2)
Accordingly, for analysis of the vibration, the response
X(f)
was generally measured. However, the response de- pends on the force, so to grasp the dynamic properties correctly and to analyze the response obtained under thevarious conditions the dynamic property
H(f)
(i.e., compli-ance transfer function) should be measured directly. For
obtaining
H(f),
the forceH(f)
and responseX(f)
should bemeasured simultaneously and can be calculated using the following equation.
H(f)-
X(f)
(3)F(i)
In the present report, using the modal analysis in the single degree of freedom based on the compliance transfer function, the imaginary value at the first mode (maximum amplitude) on each measuring point of the longitudinal direction of the b e a m was measured. Then the flexural vibration wave shape was determined and analyzed using the maximum amplitudes obtained.
Measurement of flexural vibration wave shapes
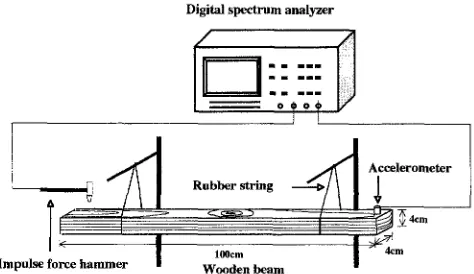
Figure 1 illustrates the experimental apparatus. The beam was hung horizontally at two points located 22.4cm from
Impulse force hammer [
Digital spectrum
analyzerRubber
string ..._~ A~ccelerometer
~
~4cra
I
100era
I
" ' 4cmWooden beam
Fig. 1. Experimental apparatus
each end of the beam (the node point of the first mode), as shown in Fig. 1. The measuring points, every 1 cm (5 cm in some experiments) on the same surface of the beam, were tapped by a impulse force hammer, and the responses of the generated flexural vibration were measured by an acceler- ometer placed at a definite location (99cm) on the same surface. The wave of the impulse from the impulse force h a m m e r and the response measured by the accelerometer were read by digital spectrum analyzer, and the resonance frequency at the first mode of the beam and the imaginary value of the transfer function (i.e., the maximum amplitude at the first mode of each measuring point) were obtained by the digital spectrum analyzer. The flexural vibration wave shape of the beam was determined by these amplitudes. The flexural wave shape was then normalized by the ampli- tudes as described in the following section and compared with the theoretical flexural wave shape for a uniform material. All of the measurements were carried out in an air-conditioned room at 20~ and 65% RH.
Theoretical flexural vibration wave shape and modal normalization
The wave shape of the flexural vibration s with the free ends can be described using the following equation.
Y(x) = sinhkil +
~ 7 c ~ ' sink,./(sinhkx ' + sinkex)+ coshk, x + coskix
kll
= 4.730,k21
= 7.853,k31
= 10.996,k41
= 14.137,ks1
= 17.279(4)
where i is the number of modes; and l is the length of the beam.
3
. 2 / . . . . i . . . . , . . . . i . . . . i . . . . i . . . . i . . . . i . . . . i . . . . i . . . .
0 10 20 30 40 50 60 70 80 90 100
Length (cm)
Fig. 2. Normalization of flexural vibration wave shape at the first mode. Open symbols, original wave shape; solid line, normalized wave shape; broken line, theoretical wave shape
the amplitudes between two node points to the length direc- tion of the beam) (shown by the right oblique lines) and the area enclosed by the theoretical wave shape between two node points and the x-axis (shown by the left oblique lines) were computed. The ratio of the latter to the former was multiplied by the original wave shape, thereby obtaining the normalized wave shape of the beam. From this point on, the normalized wave shapes determined by this method are used for comparison with the theoretical wave shape.
Results and discussion
Determination of the flexural vibration wave shape using the transfer function
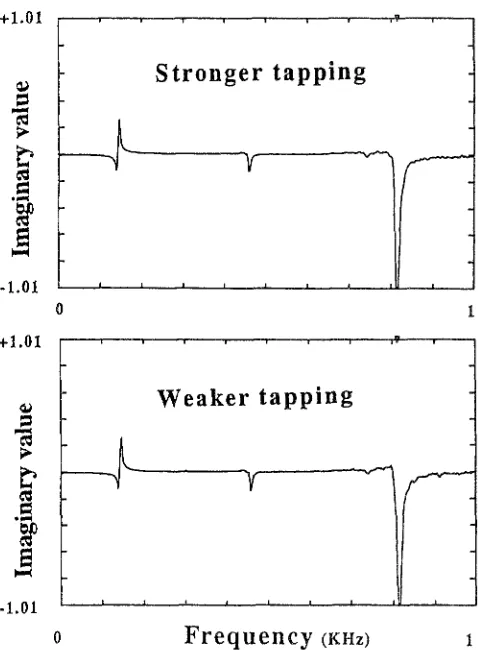
For determining the wave shape of the flexural vibration at the first mode, the maximum amplitude of each measuring point on the longitudinal direction of the beam must be measured simultaneously. An apparatus with multiple channels and a number of sensors is necessary for such analysis. Such a system is expensive, and difficulty is often encountered because of the mass of the sensors used in the measurement. Therefore, measurements using a less expen- sive apparatus with two channels and a single sensor is desirable. In the present study, the method using the wave shape determined by the transfer function, obtained from the displacement/impulse force ratio was attempted. A beam with straight grain and no defects was tapped twice at different forces at the identical measuring point using the impulse force hammer. The impulse from the impulse force h a m m e r and the generated flexural vibration were mea- sured by the accelerometer set near one end of the beam and were fed into the digital spectrum analyzer. The results calculated by the transfer function are shown in Fig. 3. Despite the different tapping forces, the maximum ampli- tude at the first m o d e was 0.264, at the second m o d e it was 0.124, and at the third mode it was 1.53, with the amplitudes of the two taps being identical at each mode. Therefore, it was possible to obtain identical maximum wave shape
+1.01
-1.01
+1.01
t
0
Stronger tapping
~r
-1.01 i
o
Weaker tapping
-u
Frequency (KHz)
Fig. 3. Influence of tapping force on transfer function analysis
amplitudes by tapping each measuring point of the beam individually. This apparatus system is relatively inexpensive and does not involve the difficulty entailed by the mass of multiple sensors because it uses only a single sensor. Accordingly, the wave shape of the flexural vibration can be obtained easily and accurately with the present method.
As mentioned above, the maximum amplitude of each measuring point can be determined by tapping each mea- suring point of the beam and using the transfer function, thereby allowing the wave shape to be obtained from these maximum amplitudes. Consequently, it is possible to detect wood defects such as knots and to estimate the elasticity or the strength of the wood based on the wave shape.
Flexural vibration wave shape of uniform beam
1
.=
"-" 0-I
Y
/
\
/ /
/ /
14o
< -1
- 2 , , , I , , , , I . . . . , . . . . , . . . . , . . . . ~ . . . . , . . . . , . . . . , . . . . - 2
0 10 20 30 40 50 60 70 80 90 100 2
Length(cm)
. . . . I . . . . I . . . . I . . . . ~ . . . . I i l l r l l r r l l l l l i J l l i r l l r l l
Fig. 4. Flexural vibration wave s h a p e at the first m o d e of a clear 1 w o o d e n beam. Open symbols, n o r m a l i z e d wave s h a p e of a clear w o o d e n b e a m ; broken line, theoretical wave s h a p e
the elasticity of the beam was considered uniform. The results shown in Fig. 4 also suggest that the elasticity of the beam is almost uniform.
Effect of partial mass and elasticity variation on the flexural vibration wave shape
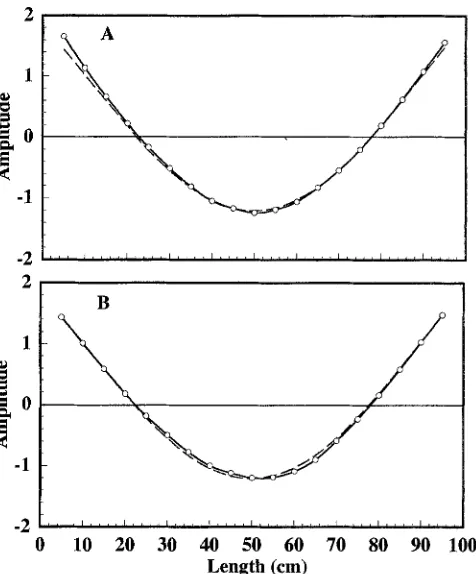
The elasticity of the area containing a mechanical defect such as a knot or decay is generally lower in the direction of the tree axis than in a uniform part of the same beam; and the density of such an area is also different from that of the uniform part. Therefore, when detecting the defect and estimating the elasticity of the defective part using the wave shape, the effect of the partial elasticity and density varia- tion on the wave shape must be examined. In the present report, this issue was investigated by attaching a weight with glue to simulate density variation and by drilling a hole to simulate elasticity variation (more exactly, the bending stiff- ness variation). That is, after obtaining the wave shape of a uniform beam with straight grains, a 5-g iron bar with glue was attached to the beam in the width direction at a position 63cm from one end, and the wave shape of the beam was then remeasured. Moreover, after removing the iron bar, a 2cm diameter hole was drilled at the same position on the flat grain surface, and the wave shape was measured for a third time. The mass removed by drilling the hole was al- most equal to the mass of the iron bar attached to the beam. Figure 5 shows these three wave shapes. As shown in Fig. 5A, the node points of the wave shape of the beam to which the iron bar was attached shifted to the center of the beam compared with those of the uniform beam. At the point (63 cm) of attachment to the iron bar, the amplitude was somewhat higher than that of the uniform beam, and the curvature of this point increased. This result shows the shift in the node points to the location of the weight increase due to the increase in the mass and the attendant increase in the curvature of the location. In contrast, the node points of the wave shape of the beam with a hole drilled at the same position (63 cm) scarcely shifted, although the curvatures of the wave shape apparently increased, as shown in Fig. 5B. 286
2
-- 0
-1
-2
B
, , , i . . . . I . . . . i . . . . i . . . . I . . . . i . . . . i . . . . i . . . . i . . . .
10 20 30 40 50 60 70 80 90 100
Length (cm)
Fig. 5A,B. Influence of partial density and rigidity variation on the flexural vibration wave s h a p e at the first m o d e . A W a v e s h a p e of the b e a m with attached weight. B W a v e s h a p e of the b e a m with a hole. Open symbols, wave s h a p e of the w o o d e n b e a m with weight in case A and with a hole in case B; broken line, theoretical wave s h a p e
This result shows that in the beam with a knot 2cm in diameter, even if the density of the knot is twice that of the uniform part, the effect of the density variation on the wave shape was only slight. However, if the bending stiffness or elasticity of only 2cm of the partial defect against the 100cm length of the beam was decreased by half, the effect of the elasticity variation on the wave shape would be marked.
The preceding results suggest that it is possible to detect defects such as knots or decay based on the wave shape, especially in the case of knots, as both the increase in den- sity and the decrease in elasticity increase the curvature of part of the knot, making the knot more easily detected.
Determining the presence of a knot in a beam in terms of flexural wave shape
To discuss the characteristics of the flexural vibration wave shape of a beam containing defects such as knots, two beams with the dimensions described under materials were prepared. One contained a 3cm diameter knot, with the center of the knot located 62cm from the base end of the beam. The other was taken from the adjacent part in a direction tangential to the above beam, and it contained grain deviations around the knot in the above beam.
E E
~%
/ /'
1 % ~ k ~ ~
~//
E
,~
~/
0 RmF'
UEE
":~m% • 1 6 2
= 1 ~ e E / mE " " ~ E.E~E. E . ~ EEE E
E ' ~ E E EEEEE E E
. 2 i i r i z . . . . I . . . . I . . . . I , i l J l r l l ] l l , , I . . . . i . . . . i . . . .
0 10 20 30 40 50 60 70 80 90 100
Length (cm)
Fig. 6. Influence of a k n o t on the flexural vibration wave s h a p e at the first m o d e . Open symbols, wave s h a p e of w o o d e n b e a m with a knot; broken line, theoretical wave s h a p e
1
e~
-1
-2 0
o '~
\
/y
| . . . . i . . . . I r l r l l l l r l l l l r l l , , , , I , , , J l , , , , I , , , , I , , ~ ,
10 20 30 40 50 60 70 80 90 100 Length(cm)
Fig. 7. Influence of localized grain deviations on the flexural vibration wave s h a p e at the first m o d e . Open symbols, wave shape of a w o o d e n b e a m containing localized grain deviations; broken line, theoretical wave s h a p e
knot at 62cm, the wave shape was obviously different from the theoretical wave shape. The maximum amplitude of the wave shape shifted to the right, and the amplitudes near the knot were higher than those of the theoretical wave shape at the same position, as shown in Fig. 6. A similar tendency was found in the beam containing the disordered grain, as shown in Fig. 7, though the tendency was much less than in the case shown in Fig. 6. In the case of the beam in which a hole was drilled (Fig. 5B), the amplitudes of the part in which a hole was drilled were also higher than that of the theoretical wave shape, and the curvature of that part was higher than that of the same part of the theoretical wave shape.
As mentioned above, it was shown that in the case of the beam containing a defect with lower elasticity (e.g., a knot, grain deviation, or hole) the amplitudes near the defect and the curvature of the defective part increased compared with the theoretical wave shape.
These results show that not only the presence of defects can be detected but also that the location and the elasticity of the defective parts can be estimated by comparing the beam's wave shape with the theoretical wave shape.
3
2
~=
-I
-2 3
%~176 A: a knot at 51cm oO0~/~ '
, , , [ . . . . I . . . . I . . . . [ ' ' ' l i l l r r I I l l , l l l l ' l i . . . . [ ~ , , '
0 <
-1 -2 3
B: a knot at 58cm
. . . . f . . . . l . . . . l . . . . I . . . . l , i l l l r r a i [ i r i i [ r r l i ~ i r l ~
-1 -2
C: a knot at 77cm
, , , I . . . . I . . . . I . . . . I . . . . I . . . . I , , l l l l r l j r l l l i l l I
10 20 30 40 50 60 70 80 90 100 Length (cm)
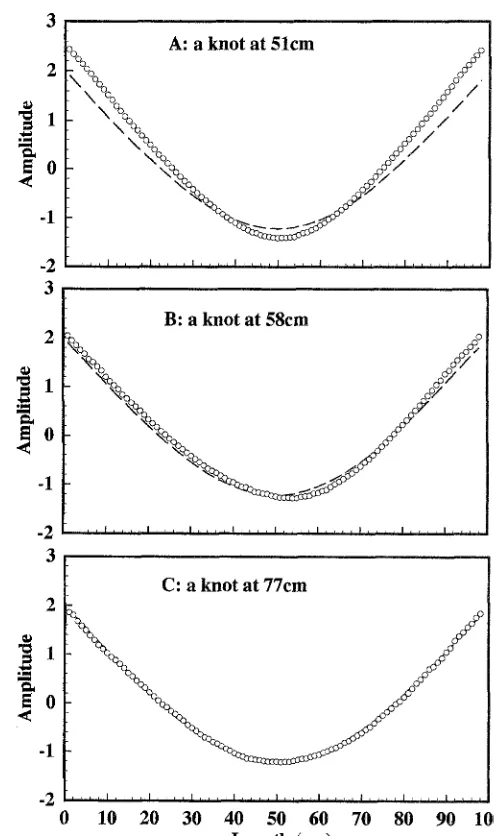
Fig. 8. Influence of k n o t location o n the flexural vibration wave s h a p e at the first m o d e . Open symbols', wave s h a p e of w o o d e n b e a m with a knot; broken line, theoretical wave s h a p e
Estimating the location of the defect by means of the flexural vibration wave shape
As described in the preceding section, the location of the defect can be estimated by tapping the beam containing the defect and examining the wave shape. A beam containing a knot whose center was located near the center (51cm) of the beam, a beam containing a knot whose center was lo- cated slightly apart from the center (58 cm) of the beam, and a beam containing a knot whose center was located near the node point (77 cm) were used for measurements. The wave shapes of these three beams were determined to investigate the reliability of estimating the defect's location.
288
the a m p l i t u d e was m o s t s e p a r a t e d f r o m the t h e o r e t i c a l w a v e c o r r e s p o n d e d to the l o c a t i o n of the knot. This result s u g g e s t e d t h a t the l o c a t i o n of the defect can b e e s t i m a t e d with high accuracy. In the case of the b e a m containing a k n o t (B: a b o u t 3 c m d i a m e t e r , p e r f o r a t e d ) slightly distant f r o m the c e n t e r of the b e a m , a similar result was o b t a i n e d ; t h a t is, the a m p l i t u d e of the k n o t ' s l o c a t i o n was most sepa- r a t e d f r o m the t h e o r e t i c a l wave, and the l o c a t i o n of the k n o t can b e a c c u r a t e l y e s t i m a t e d . In the case of the b e a m containing a k n o t (C: a b o u t 6 c m d i a m e t e r , a b o u t l cm d e p t h ) far f r o m the c e n t e r of the b e a m a n d n e a r the n o d e point, the w a v e s h a p e was significantly different f r o m the t h e o r e t i c a l wave, and the m a x i m u m a m p l i t u d e shifted to the right. B e c a u s e the d e p t h of the k n o t was shallow, t h e r e was only a small difference f r o m the t h e o r e t i c a l wave shape. H o w e v e r , the a m p l i t u d e s w e r e m o s t s e p a r a t e d f r o m the t h e o r e t i c a l w a v e shape in the range of 7 5 - 8 0 c m in the s a m e l o c a t i o n as t h a t of the knot.
T h e s e results s u g g e s t e d that defects l o c a t e d n e a r the central p a r t of a b e a m can b e easily d e t e c t e d , and the loca- tion of the defect can b e e s t i m a t e d with high accuracy b a s e d on the flexural v i b r a t i o n wave s h a p e o b t a i n e d by the trans- fer function. M o r e o v e r , it is t h o u g h t t h a t the elasticity of e v e r y p a r t of t h e b e a m can be e s t i m a t e d using the c u r v a t u r e of the wave shape. C o n s e q u e n t l y , the testing m e t h o d de- s c r i b e d in the p r e s e n t study s h o u l d b e f u r t h e r investigated.
Conclusions
F o r the p u r p o s e of n o n d e s t r u c t i v e l y d e t e c t i n g w o o d defects such as knots, the flexural v i b r a t i o n w a v e s h a p e at the first m o d e g e n e r a t e d b y t a p p i n g the b e a m was d e t e r m i n e d using
the transfer function, and the wave s h a p e was c o m p a r e d with the t h e o r e t i c a l wave shape for h o m o g e n e o u s material. A s a result, the flexural v i b r a t i o n wave s h a p e at the first m o d e of the u n i f o r m b e a m a l m o s t c o m p l e t e l y coincided with the t h e o r e t i c a l wave shape. In the case w h e r e the b e a m c o n t a i n e d a defect such as a knot, the wave s h a p e obviously differed f r o m the t h e o r e t i c a l wave s h a p e a r o u n d the defect. T h e s e results suggest t h a t it is possible to d e t e c t the pres- ence of defects and e s t i m a t e their locations. M o r e o v e r , be- cause it is t h o u g h t that the defective p a r t ' s elasticity can be e s t i m a t e d b y analyzing the c u r v a t u r e of the wave shape, r e l a t e d studies will b e further pursued.
References
1. Sobue N (1986) Measurement of young's modulus by the transient longitudinal vibration of wooden beams using a fast Fourier trans- formation spectrum analyzer. Mokuzai Gakkaishi 32:744-747 2. Miyauchi M, Fujita S, Hattori Y, Itoh H, Tooya R (1994) Measure-
ment of Young's modulus of sugi lumber by analysis of longitudinal tap tone (II) (in Japanese). Wood Ind 49:312-317
3. Kamioka H, Kataoka A (1982) The measurement error factor of ultrasonic velocity in wood (in Japanese). Mokuzai Gakkaishi 28:274-283
4. Nanami N, Nakamura N, Arima T, Okuma M (1992) Measuring the properties of standing trees with stress waves. I. The method of measurement and the propagation path of the waves. Mokuzai Gakkaishi 38:739-746
5. Nagamatsu A (1993) Introduction to modal analysis (in Japanese). Coronasha, Tokyo, pp 221-351
6. Miyamura M, Nakajima S (1996) Report of the research results about life and district [Heisei 7 nendo seikatsu chiiki ryudo kenkyu chosa kenkyu seika houkokusho] (in Japanese). pp 94-106 7. Ookubo N (1982) Modal analysis of machine [Kikai no moudaru
anarishisu] (in Japanese). Chuoudaigaku 8hupanbu, Tokyo, pp 1-45 8. Tsubouchi T (1942) Theory of vibration [Shindo-ron] (in Japanese).