Seismic Performance of Exterior RC Beam–Column Joints Retrofitted
using Various Retrofit Solutions
Gia Toai Truong, Ngoc Hieu Dinh, Jong-Chan Kim, and Kyoung-Kyu Choi*
(Received October 15, 2016, Accepted May 8, 2017, Published online September 12, 2017)
Abstract: Beam–column joints in existing concrete buildings might not satisfy the design requirements for seismic reinforcement details specified in current seismic design codes. Thus, in this study, various retrofit solutions for existing exterior beam–column joints with non-seismic details were developed: head re-bars anchoring, carbon fiber reinforced polymer (CFRP) wrapping, haunch retrofit element, and steel jacketing with various shapes and sizes. To investigate the seismic performance of exterior joints strengthened with the proposed retrofit solutions, seven half-scale exterior reinforced concrete beam–column joints including one control specimen and six retrofitted specimens were fabricated and tested under cyclic loading simulating earthquake loading. The test results showed that the proposed retrofit solutions could partially enhance the seismic capacity of the beam–column joints: steel jackets could increase deformation and load-carrying capacities; steel haunch elements could increase the load-carrying capacity, stiffness, and dissipated energy; and head re-bar anchoring and CFRP wrapping did not significantly effect on the seismic capacity of the beam–column joints.
Keywords:seismic retrofit, exterior concrete beam–column joints, head re-bars, carbon fiber reinforced polymers, haunches, steel jackets.
1. Introduction
The moment resisting frame is one of the most widely used structure systems in reinforced concrete (RC) buildings subjected to gravity and/or seismic loading. From a struc-tural point of view, while beam–column joints that connect main structural members (i.e., beams and columns) are the weakest components, they are the most complicated com-ponents as they transfer internal forces between the structural members. In many developing countries (e.g. Korea), existing concrete buildings constructed before the 1980s were designed to resist mainly gravity loads. Thus, in the past, many reinforced concrete buildings in developing countries collapsed during severe earthquakes (including those in Costa Rica in 1991 (Al-Tarazi2000), in Nicaragua in 1992 (Kanamori and Kikuchi1993), and in Egypt in 1995 (Suarez et al. 1995)). It was found that in many cases the collapse of such reinforced concrete buildings was caused by inadequate reinforcement details of beam–column joints.
According to a previous investigation (the Korea National Emergency Management Agency2011) in Korea, concrete beam–column joints designed without consideration of earthquake load have certain material and geometrical
characteristics: low concrete strength; plain steel re-bars; inadequate or no transverse reinforcement in beam–column joints; and insufficient anchorage detailing leading to lack of concrete confinement (Santersiero and Masi2015; Pampanin et al. 2002; Engindeniz et al. 2005). When such concrete buildings are subjected to earthquake loading, the beam– column joints (in particular, the corner and exterior joints) could fail in brittle manner, which might trigger partial or entire collapse of the buildings (Rashidian et al.2016; Pet-rone et al. 2016). Thus, the rehabilitation of such beam– column joints is a prerequisite to resist seismic loads.
To develop retrofit techniques for external beam–column joints with non-seismic details, a number of studies have been performed. Shafaei et al. (2014) strengthened four non-seismically detailed RC beam–column joints with steel angles, which were mounted using prestressed cross-ties. With the use of the retrofit technique, slippage was prevented by increasing the joint area of the beam bottom reinforce-ment, the plastic hinge was relocated far from the column face, and the shear strength, stiffness, energy dissipated, and ductility capacity were also significantly increased up to 50, 120, 220, and 220%, respectively.
El-Amoury and Ghobarah (2002) investigated the seismic performance of the joints retrofitted with glass fiber-rein-forced polymers (GFRP). The proposed rehabilitation schemes consist of two systems: the first system is used for upgrading the shear strength of the joint with two U-shaped GFRP layers, and the second system is used for upgrading the bond-slip of the steel bars. The use of GFRP jacketing significantly enhanced the ductility and the load-carrying School of Architecture, Soongsil University, 369
Sangdo-ro, Dongjak-gu, Seoul 06978, South Korea. *Corresponding Author; E-mail: [email protected]
CopyrightThe Author(s) 2017. This article is an open
access publication
International Journal of Concrete Structures and Materials Vol.11, No.3, pp.415–433, September 2017
capacity of the rehabilitated joints (52% higher than that of non-retrofitted joints). The brittle joint shear failure of the retrofitted specimens was eliminated, the bonding between concrete and beam top reinforcement was improved, the stiffness degradation of the joints was reduced, and the dissipated energy increased by up to six times compared to that of non-retrofitted joints.
Del Vecchio et al. (2014) also investigated the seismic performance of exterior RC beam–column joints retrofitted with fiber-reinforced polymers (FRP) through an experi-mental program carried out on six full-scale test specimens. From the test results, it was found that the observed maxi-mum strain of FRP (approximately 1.0%) was larger than 0.4% as design maximum strain and the amount of FRP joint reinforcement significantly influenced on joint panel defor-mations. Based on such test results, analytical models were also developed to predict the shear strength of beam–column joints having light reinforcement details retrofitted with FRP systems (Del Vecchio et al. 2015; Pantazopoulou et al. 2016). In addition, Ronagh and Baji (2014) and Del Vecchio et al. (2016) simulated the shear behaviour of RC beam– column joints using finite element method (FEM). In the analysis by Del Vecchio et al. (2016), the anchorage effect of beam bars and the shear contribution of the FRP strength-ening system were delicately accounted for, and the analysis results showed a good agreement with the test results in terms of strength, global deformation, crack pattern, strength and stiffness degradation, and pinching.
Pampanin et al. (2006) experimentally investigated the effectiveness of various haunch retrofit solutions on the seismic response of the reinforced concrete beam–column joints. The haunch elements were used including diagonal axial elements and they were hinged or welded to the steel plates at both ends to form haunch elements. These haunch elements were connected to the beams and columns by using two partially prestressed external rods along with two anchors, which were directly fastened to the beams and columns. The shear strength and ductility capacity of the retrofitted joints were significantly improved, and the failure mode was changed to flexural hinging in the beam.
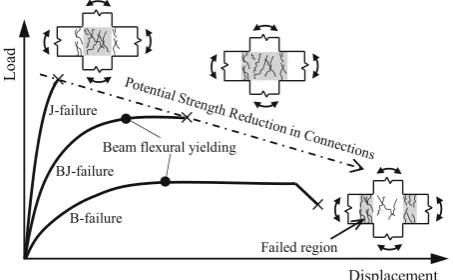
The failure modes of the beam–column joints were inves-tigated and classified into three types according to the study by Lee et al. (2009). In Fig.1, J-failure refers to the
connection failure before plastic hinges formed at the ends of adjacent beams, which is associated with low displacement and ductility capacity. BJ-failure refers to the connection failure after the plastic hinges develop at both ends of adjacent beams, and B-failure refers to beam failure in the plastic hinge regions while beam–column connections remain elastic. Compared to J-failure, the BJ- and B-failures are more ductile modes, since BJ- and B-failures involve beam yielding.
Judging from the research results mentioned above and other literatures (Campione et al. 2015; Ruiz-Pinilla et al. 2014; Bansal et al.2016; Tsonos2010; Sharma et al.2014), it was obvious that such developed retrofit techniques were effective in enhancing the seismic performance of exterior beam–column joints. However, the most significant disad-vantage of the previous retrofit techniques was the lack of practicability. In some cases, the surfaces of the joints par-allel to the beam direction cannot be covered with retrofit materials because of the existence of beams in orthogonal directions. The floor space in the upper story could be considerably minimized because of the retrofit materials; the durability can be weakened because of the holes drilled through the beams and columns, and the use of concrete jacketing could increase the dimensions and weight of the structures. Thus, the retrofit techniques for exterior beam– column joints should be designed and constructed consid-ering the architectural requirements of the existing buildings, and thus a minimum retrofit is usually allowed by building owners. In the studies by Bakis et al. (2002) and Del Vecchio et al. (2014), it was indicated that the seismic performance of the beam–column joints could be effectively enhanced even by strengthening one side of the joint panel zones.
In this study, for minimum and efficient retrofit of exterior beam–column joints, various practical rehabilitation solutions were proposed using internally embedded head re-bars, car-bon fiber reinforced polymer (CFRP) wrapping, steel haunch elements, and steel jacketing. Thus, to verify the proposed retrofit methods, experimental studies were performed. In total, seven half-scale test specimens were constructed; one was a control specimen and the other six specimens were retrofitted with different proposed retrofit methods. All test specimens were then tested under simulated seismic loading. The structural performance of retrofitted exterior beam–col-umn joints was analysed in terms of various factors: load–drift hysteretic behavior, stiffness, dissipated energy, and damping ratio. The purpose of this experimental program was aimed at providing better understanding of seismic performance of the concrete beam–column joints strengthened with different retrofit materials. An advancement of practical retrofit solu-tions for the beam–column joints could be adopted based on the findings in the current studies.
2. Experimental Program
2.1 Test Specimens
From the study by Priestley (1997), it was found that in the existing buildings, which were designed to resist mainly gravity loads, beam–column joints could not perform well Beam flexural yielding
J-failure
BJ-failure
B-failure
da
o
L
Displacement Failed region
Fig. 1 Types of failure modes of the beam–column joints (Lee et al.2009).
under seismic loading. This was mainly due to the fact that poor confinement details led to low ductility of the beam– column joints.
In Korea, based on the report investigated by the Korea National Emergency Management Agency (2011), the beam–column joints of buildings constructed during the 1980s did not satisfy the requirement of seismic reinforce-ment details in current design codes. In such existing buildings, stirrups or ties with 90hooks and large spacing were used, and the anchorage of the top longitudinal rein-forcing bars of beams was bent down inside the connection regions, while the anchorage of the bottom longitudinal reinforcing bars was bent down away from the connection regions, which might decrease the strength and deformation capacity of the connections (Priestley 1997; the Korea National Emergency Management Agency2011).
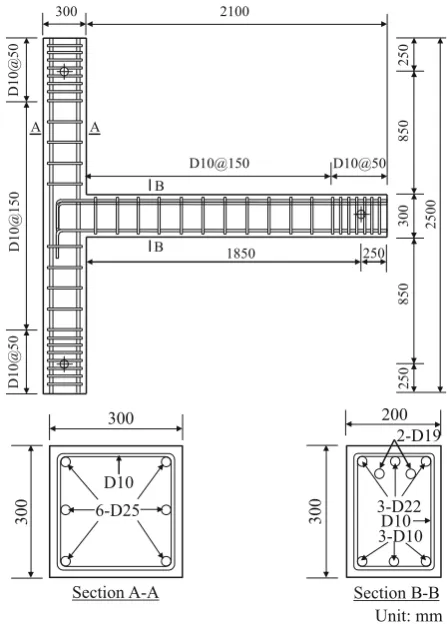
In this study, to investigate the seismic performance of reinforced concrete frames after retrofitting, seven exterior non-retrofitted concrete beam–column joint specimens with a scale factor of 1/2 were designed, detailed, and constructed in accordance with the Korea building code (AIK1982). The purpose was to simulate the exterior beam–column joints of existing RC frame buildings constructed in 1980s in Korea. One of these specimens was used as a control specimen and the other six specimens were retrofitted by various retrofit methods. Figures2,3,4,5,6,7,8 and Table1present the geometries and details of all test specimens. The control specimen was denoted as J-0, as shown in Fig.2. In the figure, a beam with a cross section of 200 mm9300 mm was connected to a column with a cross section of 300 mm9300 mm at the mid-height point. The square-shaped cross section of the columns was determined after Antonopoulos and Triantafillou (2003) and Shafaei et al. (2014). It is noted that the purpose of this study was to investigate the seismic performance beam–column joints failed in J failure mode, and thus the joint shear strength of a control specimen J-0 was determined to be less than the joint shear demand corresponding to flexural yielding of the beams (Lee et al.2009). In addition, to avoid column failure ahead of joint failure, the longitudinal reinforcement ratio of the column was determined as 3.4%, and the top and bottom longitudinal reinforcement ratios of the beam were 3.5 and 0.43%, respectively. The expectation of the failure modes of the beam–column joints is presented in Appendix 1. It is noted that J-0 has the same material and geometrical prop-erties as those of the retrofitted specimens, except for the retrofitted parts.
The aim of retrofitting the exterior joints was to enhance the ductile behavior after failure of the joints by providing half joint shear strength (0.5Vc) as residual strength by shear reinforcement (see Appendix2). For practical purposes, high seismic performance of the joints was not considered an aim of the study. In addition, it should be noted that in test specimens, only a portion of the joint panel zones was ret-rofitted with retrofit materials to minimize the retrofit of transverse beams and floor slabs in real structures. Figure3 shows the details of specimen J-A, which was strengthened with head re-bars having a diameter of 16 mm, a length of
300 mm, and specified yield strength of 400 MPa. In the figure, eight head re-bars were equally installed into two vertical lines with 150 mm spacing in the joint panel zone. For each vertical line, four head re-bars were installed with a vertical spacing of 50 mm to each other (ACI 318-142014). The details of specimen J-CFRP are presented in Fig. 4. J-CFRP was wrapped with two plies of CFRPs and then fixed with a vertical line of ten CFRP anchors along the column. The CFRPs used have a length of 1100 mm and a width of 100 mm, and only two sides of the column section were strengthened with CFRPs. The presence of CFRPs was expected to improve the joint confinement and to avoid the failure of the CFRP anchors (Ozbakkaloglu and Saatcioglu 2009; Brena and McGuirk2013). It is noted that in this study only one specimen strengthened with CFRPs was tested. In fact, many other strengthening layouts of FRPs, in particular, at the corners between columns and beams were investigated and showed good retrofit effect (Del Vecchio et al. 2014; Mahmoud et al.2014).
Figure5 shows the details of specimen J-H, which was strengthened with haunch elements made by steel plates (SS400) having a thickness of 16 mm and specified yield strength of 400 MPa. In the figure, the plastic hinge regions of the beam and column below the beam, which were adjacent to the joint panel zone, were three-sided (or U-shaped), strengthened with steel gutters, and connected together by a diagonal steel plate to form a haunch. In addition, two sides of the steel gutters were installed with
D10@150 D10@50
300 2100
0
5
1
@
0
1
D
0
5
@
0
1
D
250
850
300
850
250
2500
0
5
@
0
1
D
B
B
A A
200
3-D10
300 3-D22D10 2-D19 300
300 6-D25
D10
Section A-A Section B-B
Unit: mm
250 1850
anchor bolts HILTI HSL-3 M12/20 (the diameter of 12 mm and the length of 120 mm). It is noted that haunches are expected to change the failure mode from J failure to BJ or B failure. The evaluation of the strength of the steel haunch elements is presented in Appendix3. In this study, theb(and b0) factor (which was used to determine the redistribution of the shear between the beam, column, and haunch elements in the joint) is equal to 2.69, indicating that the bending moments and the shear forces in the beams and columns could be reduced by up to 30%. Haunches were not installed in the upper story of the joint to avoid architectural incon-venience after the retrofit because the haunches could occupy the space in the upper story.
Figures 6, 7, and8 show the details of specimens J-SJ1, J-SJ2, and J-SJ3, respectively, which were strengthened with steel jackets (SS400) having a thickness of 16 mm and the specified yield strength of 400 MPa. The difference between the three specimens was the steel jacketing configuration. In specimen J-SJ1 (Fig.6), the two opposite sides of the col-umn have straight steel plates with a width of 100 mm and a length of 1100 mm. In specimen J-SJ2 (Fig.7), two opposite sides of the column are strengthened with U-shaped steel plates having a width of 100 mm, a height of 200, and a length of 1100 mm. Specimen J-SJ3 (Fig.8) was strength-ened with two steel plates placed along the columns with a length of 510 mm. In addition, two other steel plates with a
200
300
300
Head re-bars D16
150
300
Beam Column A A
300
Head re-bars D16
50
50
50
-A
(a) Elevation (b) Section A (c) Photo of J-A
Unit: mm
Fig. 3 Details of retrofitted specimen J-A.
50
80
80
140
180
100
100
90
130
100
11
0
0
50
B
CFRPs (2 plies)
300
Beam Column
A A
CFRP anchors
B 300
100
75
300
300 CFRPs (2 plies) Epoxy
CFRP anchors
120
120
75 100
-A
(b) Section A
(a) Elevation (c) Photo of J-CFRP
Unit: mm
Fig. 4 Details of retrofitted specimen J-CFRP.
300 B B 73 73 73 73 60 73 25 425 74 73 73 73 73 74 440 205 91 58 56 10 82 67 56 205 Steel plate Steel plate 300 Beam Column A A Anchor bolts 300 362 300 205 Steel plate Epoxy Corner welding
56 58 91 Anchor bolts 120 120 200 262 300 205 91 67
56 Anchor bolts
80 Corner welding Steel plate Epoxy 50 50 -H -A
(d)Photo of J
(b)Section A
(a)Elevation
(c) Section B-B
Unit: mm
Fig. 5 Details of retrofitted specimen J-H.
B Steel plate 300 Beam Column A A Anchor bolts 50 100 130 70 180 100 100 80 140 100 11 0 0 50 B 300 100 75 300 342 300 Steel plate Epoxy Anchor bolts 120 120 75 100 Beam Column 300 200 300 -B -SJ1 -A
(c) Section B (d) Photo of J
(b) Section A
(a)Section A-A
Unit: mm
Fig. 6 Details of retrofitted specimen J-SJ1.
B Steel plate 300 Beam Column A A Anchor bolts 50 500 B 300 60 180 80 140 50 65 75 200 100 300 100 Beam Column 300 200 300 -B 300 342 300 Steel plate Epoxy Anchor bolts 120 120 75 200 65 60 -SJ2
(c) Section B (d) Photo of J
(a) Elevation (b) Section A-A
Unit: mm Fig. 7 Details of retrofitted specimen J-SJ2.
Beam 300
300
-B
141 80 141 362 100 100 B Steel plate 300 Beam Column A Anchor bolts 125 B 300 100 75 11 0 80 120 75 510 A Epoxy ` 300 362
Steel plate Corner welding Anchor bolts 120 120 300 75 100 -SJ3 -A
(c) Section B (d) Photo of J
(b) Section A (a) Elevation
Unit: mm
T
able
1
Main
parameters
of
test
specimens.
Specimens
f
0(MPa)c
a
Retrofit
properties
Beams
Columns
T
ypes
Retrofit
materials
Locations
Dimensions
b
9
h
(mm
9
mm)
T
o
p
reinforcement
(volume
ratio)
Bottom
reinforcement (volume
ratio)
Dimensions
b
9
h
(mm
9
mm)
Longitudinal reinforcement (volume
ratio)
J-0
20.87
Control
–
–
200
9
300
3-D22
?
2-D19
(3.5%)
3-D10
(0.43%)
300
9
300
6-D25
(3.4%)
J-A
22.85
Head
re-bars
anchoring
8
head
re-bars
Panel
zone
J-CFRP
20.37
CFRP
wrapping
CFRP
sheets
(2
layers,
2
sides)
?
2
sides
CFRP
anchors
Panel
zone
J-H
19.80
Haun
ch
retrofit
solution
Steel
haunch
elements
(beam
bottom
?
anchor
bolts
–
J-SJ1
20.14
Steel
jacketing
Steel
plates
(16
mm,
2
sides)
?
2
sides
anchor
bolts
Panel
zone
J-SJ2
20.93
Steel
jacketing
U-shaped
steel
plates
(16
mm,
2
sides)
?
2
sides
anchor
bolts
Panel
zone
J-SJ3
18.64
Steel
jacketing
Steel
plates
(16
mm,
3
sides)
?
3
sides
anchor
bolts
Panel
zone
a
Compressive
strength
of
concrete
on
the
loading
date.
length of 362 mm and a width of 100 mm were also placed on the column faces above and below the beam. In all three specimens, the steel jackets were also installed with anchor bolts (HILTI HSL-3 M12/20). The area of the steel plates was designed to avoid the failure of the anchor bolts (ACI 318-14 2014). The evaluation of the shear strength con-tributed by retrofit materials is presented in Appendix4.
2.2 Materials
To investigate the seismic performance of the existing concrete frame buildings constructed during the 1980s in Korea (AIK1982), a low compressive strength of concrete (fc018 MPa) and yield strength (fy&300 MPa) of steel re-bars were used. Table1 shows the average compressive strength of each specimen at the loading day, which was determined based on the compressive tests according to KS F 2405 (2010). In the table, the compressive strengths for all specimens ranged from 18.64 to 22.85 MPa.
A tension test of the steel reinforcing bars was also per-formed following the guidance specified in KS B 0802 (2013) and 0814 (2001). The specified yield strength of the D10, D19, D22, and D25 steel reinforcing bars is 300 MPa. The average yield strengths obtained,fy, of steel re-bars were 406, 375, 383, and 392 MPa for the D10, D19, D22, and D25, respectively, exceeding the specified yield strength of 300 MPa. Figure9a shows the typical stress–strain rela-tionship of steel re-bars for D19 acquired from the test.
The CFRPs used had the average thickness of 0.293 mm, the ultimate strain of 0.015, the ultimate tensile strength of 3450 MPa, and the elastic modulus of 230,000 MPa as values provided by the manufacturers. The head anchor bolts used in specimen J-A has a diameter of 16 mm and the specified tensile strength of 400 MPa. Figure9b presents the tensile test of the steel jacket plates (SS400) used in this test. In the figure, the yield strength of SS400 was 430 MPa, exceeding the specified yield strength of 400 MPa. Here-after, in the evaluation of the experimental results in this study, the material strength obtained from the tests is used instead of the specified strength of concrete, steel re-bars, and retrofit materials.
2.3 Test Setup
A strong three-dimensional steel frame was assembled to carry out testing of the beam–column connections subjected to cyclic lateral loading. Figure10 presents a schematic drawing and photos of the test setup. In the figure, the col-umn of the connection was placed in a vertical position and the beam was placed in a horizontal position. The test specimens were considered to be hinged at both column ends: the top and the bottom ends of the columns were connected to a hydraulic actuator and strong floor, respec-tively. In addition, lateral cyclic loading was applied to the top part of the columns, simulating earthquake loading by a 500 kN hydraulic actuator. The end of the beam was pinned by an axial steel link pin connected at its base. A lateral
0 100 200 300 400 500 600
0 0.02 0.04 0.06 0.08 0.1
(a) Tensile test of steel re−bars
0 100 200 300 400 500 600
0 0.02 0.04 0.06 0.08 0.1
Stress (MPa)
Strain
σ ɛt σ
D19 (fy= 375MPa)
σ σ
Strain
Stress (MPa)
SS400 (fy= 430MPa)
(b) Tensile test of steel jacket plates
Fig. 9 Testing of materials:atensile test of steel re-bars and
btensile test of steel jacket plates.
Lateral support Lateral actuator
(500 kN)
Strong floor
Hinge LVDT
Colum
n
e
ma
rf
n
oit
ca
e
R
2250
1000
1000 Rigid
Link Hinge
250
(Pull) - + (Push)
2100
Unit: mm Beam
250
Actuator
Specimen
Lateral support
Rigid link Hinge
Hinge
Reaction frame
support system was connected to a reaction frame to prevent out-of-plane movement of the test specimens.
Figure11a presents the cyclic loading history used in this test according to the guide of ACI 374.2R-13 (2013). In the figure, two cycles were repeated at each drift ratio level of 0.25, 0.5, 0.75, 1, 2, 3, 4, 5%, and so on until failure. The determination of the drift ratio is shown in Fig.11b, which was mainly based on the ratio of the displacement and the length of the column. In this study, no axial load was applied on the top of the columns since such application of axial load increased the joint stiffness (Pantelides et al. 2002, 2008; Quintero-Febres and Wight 2001). However, further inves-tigation is needed on the effect of the column compression force on the behavior of beam–column connections.
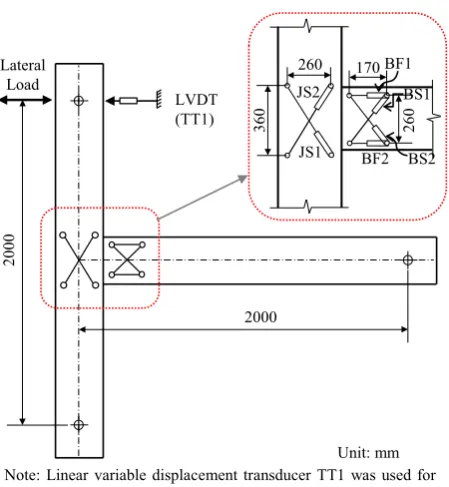
Figure12 presents the location of the linear variable dis-placement transducers (LVDTs) attached to the control specimen. An LVDT TT1 was placed at the upper end of the column to measure the total lateral displacement. Shear deformation of the panel zones and the flexural and shear deformation of adjacent beams were measured by a set of LVDTs. It is noted that for retrofitted specimens, only LVDT TT1 was used to measure the lateral displacement. The other
LVDTs were not attached to the retrofitted specimens due to the existence of the retrofit materials on the surfaces of the columns and beams around the joint panel zone.
Fourteen ordinary strain gauges were attached to the lon-gitudinal and transverse reinforcing bars of the beams and columns around the joint panel zones to measure the steel strains developed during different loading stages. In addi-tion, ordinary strain gauges were attached to the surface of the strengthening materials such as headed anchors, CFRPs, haunches, and steel jackets to measure the material strains. Figure13shows the arrangement of ordinary strain gauges. In the figure, the column reinforcing bars were gauged at the location directly above the connection part (strain gauges nos. 1 and 2). The beam reinforcing bars were gauged at two different locations: adjacent to the connection part (strain gauges no. 3–6) and inside the connections (strain gauges nos. 7–12) to check the yield penetration of beam rein-forcement. Strain gauges nos. 13 and 14 were attached to measure the transverse re-bar strains of the columns and beams. Both the displacement and strain data were collected using the data acquisition system.
2.4 Retrofit Techniques
In this study, seven reinforced concrete beam–column connections were cast and six specimens were then retro-fitted, excluding the control specimen. The retrofit process was carried out according to actual construction procedures. In the case of specimen J-A (Fig.3), the holes were pre-drilled according to a designed configuration, and the work was carefully carried out to avoid damage of the internal concrete and steel re-bars. The head re-bars were then installed through the holes and completely filled with mortar. In the case of specimen J-CFRP (Fig.4), before wrapping the CFRPs, the surfaces of the two column sides were carefully cleaned to coat an epoxy adhesive layer along the column length of 1100 mm to ensure the bonding between the CFRPs and the column surfaces. After this stage, two plies of CFRPs were wrapped on the prepared surfaces of the column. The CFRP anchors were then installed in the holes, which were pre-drilled and cleaned before coating with epoxy adhesive. It should be noted each CFRP anchor must be fully impregnated with epoxy adhesive to ensure the bond between the CFRP sheets and CFRP anchors (Grelle and Sneed2013).
In order to strength specimen J-H (Fig.5) with steel haunch elements, steel gutters were prefabricated from plate-shaped steel plates and then assembled on the column and beam surfaces after coating with an epoxy adhesive layer. Anchor bolts were then installed through the pre-drilled holes at a length of 120 mm into the concrete column and beam. Finally, a steel plate was welded on site with the bottom surfaces of the steel gutters to form a haunch according to the designed configuration.
In specimens J-SJ1 (Fig. 6), J-SJ2 (Fig.7), and J-SJ3 (Fig.8), the steel jackets were prefabricated as plate-shaped (Figs.6 and 8) and U-shaped panels (Fig.7), and the steel jackets were then assembled on the column faces after coating with an epoxy adhesive layer. The anchor bolts were
-6 -4 -2 0 2 4 6
0 2 4 6 8 10 12 14 16
)
%(
oit
ar
tfi
r
D
Number of cycles 0.25% 0.5%0.75% 1%
2% 3% 4%
5%
(a) Lateral displacement history
Δ
H
L
Drift ratio (%) = Δ 100 H×
(b) Drift determination on column Fig. 11 Loading protocol:alateral displacement history and
bdrift determination on column.
LVDT (TT1) Lateral
Load
260
360 260
170
2000
0
0
0
2
Unit: mm JS1
JS2
BF1
BS2 BS1
BF2
Note: Linear variable displacement transducer TT1 was used for all specimens
Fig. 12 Location of LVDTs in control specimen.
then installed through the pre-drilled holes at a length of 120 mm into the concrete columns. Finally, in specimen J-SJ3, the free ends of the steel jackets were welded together.
3. Experimental Results and Discussion
3.1 Damage Observations
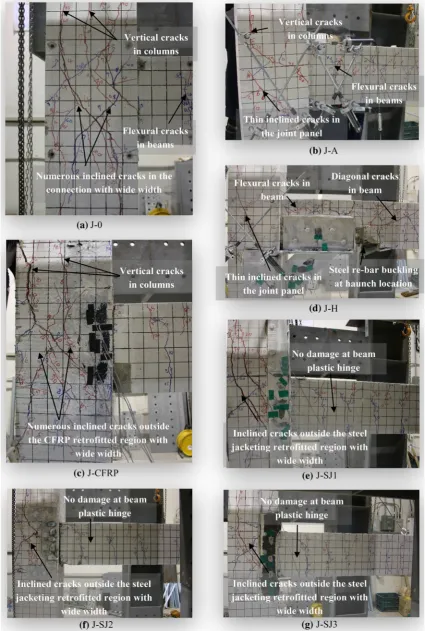
Figure14 shows the damage observation and crack pat-tern at the end of testing. In the case of control specimen J-0 (Fig.14a), flexural cracks initially appeared at a drift level of 0.5% from the bottom of the beam and quickly propa-gated to the neutral axis of the beam at a drift level of 1.0%. Then, at a drift level of 1.5%, thin flexural cracks appeared at the beam–column interface and spread along the beam length. With repeating loading cycles, inclined cracks first began to occur in the joint panel zone at a drift level of 3.0% for the negative direction of loading (in Fig.15, the negative axis of drift ratio corresponds to the case where the beam is subjected to negative bending moment). Then, numerous inclined cracks in the joint panel zone with a large width increased as the loading progressed, indicating shear failure of the joint panel zone. After the occurrence of
the inclined cracks in the joints, the width of the cracks continued to increase and the cracks in the beams ceased to increase. Subsequently, at a drift level of 5%, several thin vertical and horizontal cracks appeared in the joint panel zone; in addition, flexural cracks appeared at the widened beam–column interface, which was attributed to the slip-page of the bottom reinforcing bars of the beam. The test was intentionally terminated at a drift level of 12%, and no significant crushing of concrete was observed at the end of testing in the plastic hinge regions of the beam and column; in particular, no spalling of concrete cover occurred in the joint panel zone, regardless of the presence of major inclined cracks with the large width.
The overall behavior of specimens J-A (Fig.14b), J-CFRP (Fig.14c), J-SJ1 (Fig.14e), J-SJ2 (Fig.14f), and J-SJ3 (Fig.14g), which were strengthened with head re-bars, CFRPs, and steel jackets, respectively, was similar to that of control specimen J-0. However, in the cases of J-A, J-SJ1, J-SJ2, and J-SJ3, the number of cracks in the joint panel zones was significantly reduced; in addition, the joint inclined crack width in J-A was narrower than that of control specimen J-0. This was because the use of head re-bars and steel jackets were effective in arresting the crack
95
222
233
233
222
95
1
4
2
5
3
220
220
212 212
1 2 3
4
5 T1
T2 B1 B2
95
222
233
233
222
95
1
4
2
5
3
50
100
100
100
100
50
1 4 2 5
3
50
50
205
205
1
2
3
Beam 181 181
4
5
-A -CFRP
(a) Gauge arrangement (b) J (c) J (d) J-H
-SJ1 -SJ2
(e) J (f) J (g) J-SJ3
A
A
A-A 1
2
3,4
5,6 7,8
11,12 13
14 9,10
Ordinary strain gauges (longitudinal steel re-bars in columns and beams) Ordinary strain gauges (transverse steel re-bars in columns and beams)
Ordinary strain gauges at the retrofit location to measure strain of steel jackets, CFRPs, head steel re-bars Unit: mm Fig. 13 Arrangement of strain gauges attached to steel re-bars and retrofit surfaces:agauge arrangement,bJ-A,cJ-CFRP,d
development. Moreover, in the case of J-SJ3, by using the proposed retrofit method, the slippage of the beam bottom reinforcing bars was significantly prevented. At the end of testing (at a drift level of 12%), no spalling of concrete cover
was observed in the joint panel zones. The failure of these retrofitted specimens, except for J-SJ3, was characterized by the beam failure in the negative direction of loading with wide flexural cracks at the beam–column interfaces. Fig. 14 Specimen damage at the end of testing:aJ-0,bJ-A,cJ-CFRP,dJ-H,eJ-SJ1,fJ-SJ2, andgJ-SJ3.
Figure14d shows the damage and crack pattern of specimen J-H, which was strengthened with haunch ele-ments. First, at a drift level of 1.0%, flexural cracks
appeared in the beam; with the increasing drift level, numerous flexural cracks newly developed but the crack width was significantly narrower than that of J-0. From the -60
-40 -20 0 20 40
-8 -6 -4 -2 0 2 4 6 8
-60 -40 -20 0 20 40
-8 -6 -4 -2 0 2 4 6 8
-60 -40 -20 0 20 40
-10 -8 -6 -4 -2 0 2 4 6 8
(c) J-CFRP
(a) J-0 (b) J-A
-100 -80 -60 -40 -20 0 20 40
-8 -6 -4 -2 0 2 4 6 8
(d) J-H
-60 -40 -20 0 20 40
-10 -8 -6 -4 -2 0 2 4 6 8
(e) J-SJ1
-60 -40 -20 0 20 40
-10 -8 -6 -4 -2 0 2 4 6 8
(f) J-SJ2
-60 -40 -20 0 20 40
-10 -8 -6 -4 -2 0 2 4 6 8
(g) J-SJ3
(
da
ol
la
re
ta
Lk
N
)
(
da
ol
la
re
ta
Lk
N
)
(
da
ol
la
re
ta
Lk
N
)
(
da
ol
la
re
ta
Lk
N
)
Drift ratio (%)
Drift ratio (%)
Re-bar yielding Joint inclined cracks Joint horizontal cracks Joint vertical cracks CFRPs
Head re-bars
Haunches
Steel jacketing
Steel jacketing Steel jacketing
200
3D10 300 3D22
D1
0
2D19
Beam
300
300 6D25 D10
Column Pnp=12.5 kN
Pnn=-54.6 kN
Pnp=12.8 kN
Pnn=-58.8 kN
Pnp=12.4 kN
Pnn=-53.5 kN
Pnp=12.3 kN
Pnn=-52.2 kN
Pnp=12.4 kN
Pnn=-53.0 kN
Pnp=12.5 kN
Pnn=-54.7 kN
Pnp=12.2 kN
Pnn=-49.7 kN
Pvc=-28.4 kN
Pvc=-29.8 kN
Pvc=-28.1 kN
Pvc=-27.7 kN
Pvc=-27.9 kN Pvc=-28.5 kN
Pvc=-26.9 kN
drift level of 4%, several thin inclined cracks appeared in the joint panel zone and in the beam for a negative direction of loading. With repeating loading cycles, at a drift level of 10%, concrete crushing was observed in the beam outside the retrofitted part accompanying the buckling of the beam bottom longitudinal re-bars. This was attributed to the effects of stress concentration caused by the haunch ele-ment, leading to a brittle local failure in the beam and a sudden loss of load-carrying capacity (Sharma et al.2010; Genesio 2012). In addition, the obtained test results indi-cated that the use of haunch elements resulted in the relo-cation of the plastic hinge region from the interface between the column and the beam to the beam.
3.2 Load–Drift Hysteretic Relationships
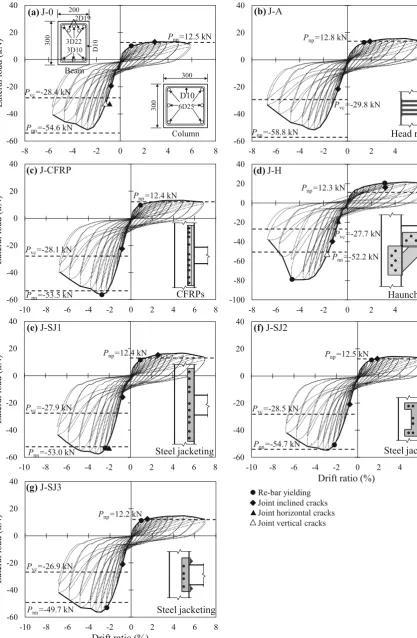
Figure15shows the load–drift hysteretic relationships of the test specimens. In this study, drift ratio (h) was defined as D/H, whereDis the lateral displacement andHis the column height (see Fig.11b). The nominal lateral load-carrying capacities (Pnp and Pnn) of each specimen based on beam flexural strength were evaluated by using the actual material strength obtained from test results, wherePnpandPnnare the positive and negative nominal lateral load-carrying capacities, respectively. In Fig.15,Pnpis less thanPnnbecause the beams were designed to resist mainly gravity loads. Pvcwas also evaluated corresponding to joint shear strength.
In Fig.15, in the negative direction of loading, the max-imum lateral load was greater than that in the positive direction of loading because the top longitudinal reinforce-ment ratio of beams was greater than the bottom longitudinal reinforcement ratio. In the case of the control specimen J-0, the maximum lateral load was less than the values of Pnn predicted based on beam flexural strength (Fig.15a). This failure of the joint could be classified as shear failure.
In Fig.15a, the control specimen J-0 exhibited high deformation capacity exceeding 5% in load–drift hysteretic response, even though pinching was severe and significant strength degradation was observed after the peak load. It is noted that the pinching effect of the load–drift hysteretic response leads to low energy dissipation of the specimens (Liang et al. 2016). In the negative loading direction, the yielding of longitudinal re-bars was not observed; mean-while, in the positive loading direction, the longitudinal re-bars had yielded at a drift ratio of 0.92%. After yielding of the beam bottom longitudinal re-bars, the joint was damaged with numerous wide inclined cracks and several horizontal or vertical cracks.
The load–drift hysteresis loops of the retrofitted specimens were almost the same as that of the control specimen J-0. However, most retrofitted specimens except for J-A and J-SJ2 showed maximum lateral loads greater than the values predicted by beam flexural strength. This indicates that the joint failed after beam yielding. Thus, in the retrofitted specimens, the structural behavior would be relatively more ductile than that of J-0. In the J-SJ series, J-SJ1 and J-SJ3 were more effective than J-SJ2.
3.3 Load–Drift Envelop Curves
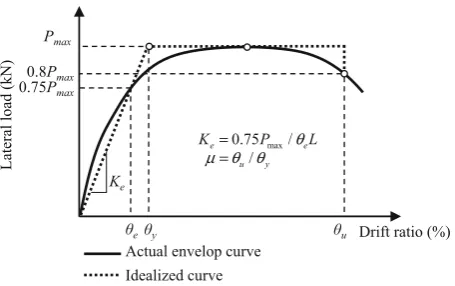
Figure16 compares the load–drift envelop curves for all RC beam–column joints, which were strengthened with head re-bars, CFRPs, steel haunch elements, and steel jackets. In the envelop curves, the peak load, effective stiffness (Ke), yield drift ratio (hy), ultimate drift ratio (hu), and drift duc-tility factor (l) were determined. Figure17shows the defi-nition of the deformation capacity and effective stiffness of a typical RC beam–column joint. In the figure, Ke is the effective stiffness which is evaluated as an initial segment of the backbone curve;he[= 0.75Pmax/(KeL)] is the drift ratio corresponding to 0.75Pmax in the ascending part of the envelop curve, whereLis the column length,hyis the yield drift ratio defined at Pmax, hu is the ultimate drift ratio at specimen failure (where a 20% drop in the descending part of the envelop curve from the peak load is observed (0.8Pmax)), and l (=hu/hy) is the drift ductility factor at specimen failure and is determined by the ratio between the ultimate drift ratio at specimen failure and the yield drift ratio. Table2 shows the effective stiffness (Ke) and the deformation capacity (hy,hu, andl) in the negative loading direction of all specimens.
In Fig.16a, in the negative loading direction, the control specimen J-0 reached the peak load of-51.75 kN at a drift ratio of -2.75% and the ultimate drift ratio of J-0 was 5.51%. Meanwhile, in the case of specimen J-A, which was strengthened with the head re-bars, the peak load and deformation capacity of J-A were almost the same as those of J-0. In the case of specimen J-CFRP (Fig.16b), with the wrapping of the CFRPs, the peak load and deformation capacity of specimen J-CFRP were slightly greater than those of J-0; however, the difference was not considerable. The peak load of J-CFRP was-56.25 kN at a drift ratio of
-2.78% and the ultimate drift ratio was 5.77%. From the test results, CFRP wrapping is not effective in increasing either strength or deformability. However, it is noted again that only one specimen strengthened with CFRPs was tested and the strengthening layout of CFRPs used in this test was also newly developed. Meanwhile, in the studies by Realfonzo et al. (2014) and Singh et al. (2014), the beam–column joint specimens strengthened with various layouts of CFRPs were tested and the test results showed that the strength and ductility of beam–column joints could be increased up to approximately 72 and 98%. Further research is necessary for better understanding this behaviour.
Specimen J-H, which was retrofitted with steel haunch elements, showed greater peak load than that of J-0 (Fig.16c). In the negative direction of loading, J-H reached the peak load of-79.31 kN at a drift ratio of-4.66%, but the deformation capacity was not enhanced. It is clear that hunch elements are efficient in increasing the strength.
The peak load and deformation capacity of specimens J-SJ1, J-SJ2, and J-SJ3, which were retrofitted with steel jackets, were slightly greater than those of J-0. In the neg-ative loading direction, J-SJ1, J-SJ2, and J-SJ3 reached the peak loads of-57.27,-54.71, and-56.31 kN at the drift ratios of -2.81, -2.75, and -2.81%, respectively; the
ultimate drift ratios were 6.51, 6.36, and 6.26%, respectively. From the test results, the J-SJ series using steel jackets are effective to increase both strength and deformability.
In addition, as shown in Table2, the effective stiffness and yield drift ratio of J-H were greater than those of J-0 by approximately 20.47 and 27.45%, respectively; meanwhile, the effective stiffness and yield drift ratio of the other ret-rofitted specimens were almost the same as those of J-0. Moreover, the drift ductility (l) of the retrofitted specimens did not considerably differ from that of J-0.
3.4 Strain Profiles
Figure18shows the strain profiles for longitudinal re-bars of the beams obtained from the test results. In Fig.18a, the strains of the top longitudinal re-bars in the beams were the average values obtained from the steel strain gauges, namely 3 and 4, which were attached to the D22 re-bars and were located at the beam–column joint interface (see Fig.13a). In the negative direction, as shown in Fig.18a, the strains of the test specimens increased with the increasing drift ratio and did not show significant difference. The maximum strain of J-0 and J-A was -0.00147 at a drift ratio of -2.74%; thus, the longitudinal re-bar strains of J-0 and J-A did not reach their yield strain of-0.0015; this means that the beam top longitudinal reinforcement of J-0 and J-A remained in the elastic range. Meanwhile, the maximum strains of the retrofitted specimens ranged from -0.00151 to -0.00170, exceeding their yield strain of -0.0015. In the positive direction, yielding of the beam top longitudinal re-bars was not observed.
Figure18b shows the average strains of the beam bottom longitudinal re-bars, which were obtained from the steel strain gauges (namely 5 and 6) attached to the D10 steel re-bars and located at the beam–column joint interface (see Fig.13a). In the figure, in the positive direction, the longi-tudinal re-bar strains of most test specimens reached their -60
-40 -20 0 20 40
-8 -6 -4 -2 0 2 4 6 8
-60 -40 -20 0 20 40
-8 -6 -4 -2 0 2 4 6 8
-100 -80 -60 -40 -20 0 20 40
-8 -6 -4 -2 0 2 4 6 8
-60 -40 -20 0 20 40
-8 -6 -4 -2 0 2 4 6 8
(a) Head re-bars (b) CFRP wrapping
(d) Steel jacketing (c) Haunches
J-0 J-A
Pun,max=-51.66 kN
Drift ratio (%)
L
ateral load
(kN
)
L
ateral load
(kN
)
L
ateral load
(kN
)
Drift ratio (%) Drift ratio (%)
Pun,max=-51.75 kN
Pup,max=13.16 kN
Pup,max=15.75 kN
Pun,max=-51.75 kN
J-0 J-CFRP Pun,max=-56.25 kN
Pup.max=13.16 kN
Pup.max=13.28 kN
J-0 J-H
Pun,max=-79.31 kN
Pun.max=-51.75 kN
Pup,max=13.16 kN
Pup,max=21.64 kN
J-0 J-SJ1 J-SJ2 J-SJ3 Pup,max=13.16 kN
Pup,max=14.73 kN
Pup,max=16.61 kN
Pup,max=14.36 kN
Fig. 16 Effects of various retrofit applications on load–drift relationships: ahead re-bars, bCFRP wrapping,c haunches, and
dsteel jacketing.
θy θu
Pmax
0.8Pmax
Actual envelop curve Idealized curve 0.75Pmax
θe
/
u y
μ θ θe=0.75 max/ e
K = P θL
Ke
Lateral load
(kN)
Drift ratio (%)
yield strain of 0.0016. After this stage, the retrofitted spec-imens J-A, J-CFRP, J-SJ1, and J-SJ2 exhibited significantly high tensile strain. In the negative direction, except for J-0, J-H, and J-SJ3, the beam bottom longitudinal re-bars of the other retrofitted specimens yielded. In general, this data confirms the effectiveness of the proposed retrofit solutions and explains the ductile structural behavior observed in the test results.
3.5 Stiffness Degradation
In this study, the secant stiffness of the test specimens at each point of envelop curves was defined as the ratio between the lateral load and correlative lateral displacement.
Figure19shows the secant stiffness of the test specimens in the positive and negative directions. In general, the stiffness of the test specimens decreased with the increasing drift ratio; such degradation is attributed to the development of flexural and shear cracking in the beams and in the joint panel zones. As shown in the figure, in the negative direc-tion, the retrofitted specimen J-H exhibited higher stiffness than that of the control specimen J-0; this was attributed to the enlargement of the joints and the enhanced concrete confinement in the joints by using the steel haunch elements. At early drift ratio of 0.35%, J-A also showed higher stiff-ness than that of J-0; however, after that, the stiffstiff-ness of J-A suddenly decreased. Meanwhile, in the case of the other retrofitted specimens, at each loading cycle, the stiffness was almost the same as that of J-0. In the positive direction, except for J-H, of which the stiffness was higher than that of J-0, the other retrofitted specimens showed almost the same secant stiffness as that of J-0.
3.6 Dissipated Energy and Damping Ratio In this study, the dissipated energy at each loading cycle was calculated as the area enclosed by a hysteretic loop at that loading cycle. The cumulative dissipated energy was evaluated as the summation of areas calculated for each loading cycle. Figure20a shows a comparison of the cumulative dissipated energy for the test specimens according to the various retrofit applications. In general, Table 2 Effective stiffness and ductility in a negative loading direction obtained from test results.
Specimens Ke(kN/mm) hy(%) hu(%) l
J-0 1.27 1.53 5.51 3.60
J-A 1.27 1.53 5.51 3.60
J-CFRP 1.34 1.58 5.77 3.65
J-H 1.53 1.95 5.18 2.66
J-SJ1 1.21 1.77 6.51 3.68
J-SJ2 1.29 1.59 6.36 4.00
J-SJ3 1.30 1.63 6.26 3.84
-0.0015 -0.0005 0.0005 0.0015 0.0025
-6 -4 -2 0 2 4 6
Strain (mm/mm)
Drift ratio (%)
J-0 J-A
J-SJ1 J-SJ2
J-SJ3 J-H
J-CFRP
Yield strain (0.0015)
Gauges 3,4
(a) Steel strain of top longitudinal re-bars in beams (gauges 3, 4)
-0.005 -0.0025 0 0.0025 0.005
-6 -4 -2 0 2 4 6
Strain (mm/mm)
Drift ratio (%)
J-0 J-A
J-SJ1 J-SJ2 J-SJ3 J-H J-CFRP
Yield strain (-0.0016) Yield strain (0.0016)
Gauges 5,6
(b) Steel strain of bottom longitudinal re-bars in beams (gauges 5, 6)
Fig. 18 Strain profiles for longitudinal steel re-bars in beams.
0 0.2 0.4 0.6 0.8 1 1.2 1.4 1.6 1.8
-4 -2 0 2 4
Secant stif
fness (kN/mm)
Drift ratio (%)
J-0 J-A J-CFRP J-H J-SJ1 J-SJ2 J-SJ3
Fig. 19 Stiffness degradation curves.
except for J-H, the dissipated energy of most specimens showed the same trend and no significant difference was observed corresponding to the control specimen J-0. In the case of specimen J-H retrofitted with haunch elements, for the drift ratios below 2%, J-H dissipated almost the same energy as that of J-0. Then, the dissipated energy of J-H was significantly greater than that of J-0 by approximately 45% at a drift ratio of 6.6%.
The damping ratio (n), which is one of the most important indices characterizing the dynamic response of the struc-tures, is defined as Ed/4pEs, where Ed is the dissipated energy per cycle and Es is the elastic strain energy. Fig-ure20b shows the damping ratio versus drift ratio of the test specimens for a negative loading direction. In general, as shown in the figure, the damping ratios of the retrofitted specimens were almost the same as that of the control specimen J-0. At the elastic state, the damping ratios were around 0.1–0.12, then decreased to 0.036–0.044 at a drift ratio of 0.77%; beyond 0.77%, the damping ratios slightly increased to 0.06–0.08.
4. Conclusions
In this study, seven half-scale reinforced concrete beam– column joint specimens were designed to simulate the existing joints in concrete buildings constructed around 1980s in Korea. Six of the specimens were then retrofitted and tested under seismic loading only and one specimen was used as the control. The retrofit solutions applied in this test were head re-bars anchoring, CFRPs wrapping, haunch elements, and steel jacketing. Based on the results obtained in this study, the primary findings are as follows:
• In the retrofitted joints, except for J-CFRP, cracking damage (the number and the width of cracking) in the joint panel zone was significantly diminished by eye. • The retrofit methods developed in this study including
head re-bar anchoring, CFRP wrapping, haunch, and steel jacketing could partially enhance the strength and deformation capacity of the beam–column joints:
– In the joint retrofitted with haunch elements (J-H), the lateral load-carrying capacity was significantly increased up to approximately 53.3% but the defor-mation capacity was not enhanced. In addition, in specimen J-H, the plastic hinge region was relocated from the beam–column interface to inside the beam. – Retrofitting with steel jackets, the deformation capacities and the lateral load-carrying capacities of specimens J-SJ1, J-SJ2, and J-SJ3 were improved up to approximately 10.7 and 18.1%, respectively. However, steel jacketing and using steel haunch elements would be potential for corrosion and it is difficult to handle the heavy steel plates (Truong et al.2017).
– The uses of CFRP wrapping and head re-bar anchoring did not effectively improve the strength and deformation capacity of the beam–column joints in this test. In the case of J-CFRP, the lateral load-carrying capacity and the deformation capacity were slightly increased but the difference was not consid-erable. In contrast, the lateral load-carrying capacity and deformation capacity of specimen J-A were the same as those of J-0. Further research is needed for better understanding this behaviour.
• The stiffness of J-H was greater than that of J-0, while that of the other retrofitted specimens was almost the same as that of J-0. However, the stiffness degradation rates of the retrofitted specimens were similar to that of J-0.
• The energy dissipation capacity of most specimens strengthened with head re-bars, CFRPs, and steel jackets showed almost the same trend as that of J-0, but the dissipated energy of the retrofitted specimen J-H contin-ued to increase up to 45%. On the contrary, the application of retrofit materials did not considerably affect the damping ratio.
0 0.05 0.1 0.15 0.2 0.25
0 2 4 6 8
Drift ratio (%)
Damping
ratio
J-0 J-A J-CFRP J-H J-SJ1
J-SJ3 0
5 10 15 20 25 30 35
0 2 4 6 8
Dissipated ener
gy
(kNm)
Drift ratio (%)
J-0 J-A J-CFRP J-H J-SJ1
J-SJ3 Elastic strain
energy (Es)
Energy dissipation per cycle (Ed)
Lateral load (kN)
Deformation (mm)
Acknowledgements
This research was supported by a Grant (NRF-2014R1A1A2053499) from the National Research Founda-tion of Korea, Grant funded by the Korean Government.
Open Access
This article is distributed under the terms of the Creative Commons Attribution 4.0 International License (http:// creativecommons.org/licenses/by/4.0/), which permits un restricted use, distribution, and reproduction in any medium, provided you give appropriate credit to the original author(s) and the source, provide a link to the Creative Commons license, and indicate if changes were made.
Appendix 1: Determination of Failure Modes
of Beam–Column Joints
According to the studies by Lee et al. (2009) and Teraoka et al. (1996), failure of the beam–column joints could be classified into three types: B failure, BJ failure, and J failure. Figure1 presents the types of failure mode of the beam – column joints. In the figure, B failure (Vc/Vu[1.8) indicates flexural yielding of beams undergoing large inelastic defor-mation until ultimate rotational capacity without shear fail-ure in joints; BJ failfail-ure (1BVc/VuB1.8) indicates joint failure after initial yielding of beam reinforcement; and J failure (Vc/Vu\1) indicates joint failure by shear force without yielding of beam reinforcement, where Vc is the joint shear capacity andVuis the joint shear demand. In this study, the ratioVc/Vuof the control specimen (J-0) was 0.73. The evaluation processes of the joint shear capacity (Vc) and the joint shear demand (Vu) of the concrete beam–column joints are presented in Appendix2.
Appendix 2: Evaluation of Shear Strength
of Beam–Column Joints
In ACI 352R-02 (2002), the shear capacity of the joint (Vc) is evaluated as follows in Eq. (1):
Vc¼0:083c
ffiffiffiffi f0
c
p
bjhc ð1Þ
wherefc0 is the concrete compressive strength, andbjandhc are the effective joint width and the depth of the column in the direction of joint shear being considered, respectively. The joint shear demand (Vu) is evaluated based on the beam yield mechanism to check the failure mechanism of the joints.
The nominal lateral load-carrying capacity of the columns (Pn) is evaluated based on the assumption of yielding in beam reinforcement at the connection, as shown in Fig.21.
Pn ¼
VbLb
Hc
¼ Mb
Lb0:5hc
Lb Hc
ð2Þ
wherePn=Pnp or Pnn;Vband Mbare the shear force and moment developed by yielding of beam reinforcement, respectively; and Lb and Hc are the length of beams and columns, respectively.
Appendix 3: Design Procedure of Haunch
Elements through Retrofit of Beam–Column
Joints
Figure22shows the bending moment and shear diagrams of the beam–column joints after retrofitting with haunch elements according to the study by Chen (2006). In the figure, the bending moment (Mbc) and shear in column (Vc0)
at the interface of the joints were evaluated as follows in Eqs. (3) and (4), respectively.
Mbc¼MbðmaxÞþð1bÞVbL0
hbbVb
2 tana ð3Þ
Vc0¼ð1b0ÞVc ð4Þ
(1-β’)Vc
Vc
Vc
β’Vc
(Hc-hb)/2
Mbc
βVb Vb
Mb(max)
1 (1-β)Vb
L’ Lb-(hc/2)-L’
Lb-(hc/2)
(a) (b)
Fig. 22 Moment and shear diagrams after retrofitting with haunch elements (Chen2006):amoment diagram in the beam andbshear diagram in the column.
Pn=Pnp(or Pnn)
Hc
hc
Mb
Critical section
Lb
Vb
Vu
Vcol
Tb
hb
Pn=Pnp(or Pnn)
Fig. 21 Force equilibrium in beam–column joint.
b¼b a
6Lhbþ3ahbþ6bLþ4abþ2Ibb
3
IcaHcþ
3IbHLbb3
2Ica2Hcþ
3IbhcHLbb2
Ica2Hc
3hbþ6bhbþ4b2þ2K12daEcoscIb2aþ
6Ibb2
a2A cþ
2Ibhcb2
Ica þ
3Ibhcb2
Ica2 þ
3Ibh2cb3
2Ica3
2 4
3 5
ð5Þ
b0¼b Hc Lbtana
ð6Þ
Kd¼
EsAd
Lh
ð7Þ
Lh¼
ffiffiffiffiffiffiffiffiffiffiffiffiffiffiffi a2þb2 p
ð8Þ
H¼Hchb2b ð9Þ
L¼Lbhc2a ð10Þ
whereMb(max)is the maximum bending moment in the beam;Vb is the shear force in the beam;bandb0are the factors expressing the effectiveness of the retrofit solution by determining the redistribution of the shear between the beam, column, and haunch elements in the joint;aandbare the projected length of the haunch elements on the beam and column, respectively;hb is the depth of the beam; Ib and Ic are the effective inertial moment of the beam and column, respectively;ais the angle between beam and diagonal haunch element; andKd is the stiffness of the haunch elements. The shear demand in the joint (Vu) was evaluated by considering the beam yield mechanism.
Appendix 4: Design Procedure of Head
Re-bars, Steel Jackets, and CFRPs for Retrofit
of Beam–Column Joints
In this study, the retrofit purpose of exterior beam–column joints was to provide the joints with residual strength of half joint shear strength (0.5Vc). Thus, shear strength (Vs) pro-vided by retrofit materials should be greater than 0.5Vc.
Vs0:5Vc¼0:0415c
ffiffiffiffi f0
c
p
bjhc ð11Þ
In the cases of specimens retrofitted with head re-bars,Vs is calculated according to KCI (2012).
Vs¼AvfytðlsinaþcosaÞ ð12Þ
wherefytis the tensile strength of head re-bars,Avis the total area of head re-bars crossing an inclined shear plane,ais the angle between shear reinforcement and shear plane in the joint panel zone (in this study,ais assumed as 45), andlis the coefficient of friction (= 1.4 for normalweight concrete placed monolithically).
In the cases of specimens retrofitted with steel jackets,Vs is evaluated according to Eurocode 8-3 (2005). It is noted that only 50% of the steel yield strength of the jacket is used.
Vs¼0:5hc
2tsbs
s fyt;dðcothþcotbÞsinb ð13Þ
wheretsis the thickness of the steel jackets,bsis the width of the steel jackets,sis the space of the steel jackets (bs/s=1, in the
case of continuous steel plates),his the strut inclination angle,b is the angle between the axis of the steel jackets and the axis of the member (b =90, in the case of continuous steel plates), andfyt,dis the design yield strength of the steel jackets.
In the cases of specimens retrofitted with CFRPs, the contribution of CFRPs to the shear strength is evaluated according to ACI 440.2R-02 (2012).
Vs¼
AfvffeðsinaþcosaÞdf
sf
ð14Þ
Afv ¼bntfwf ð15Þ
ffe ¼efeEf ð16Þ
efe¼0:0040:75efuðfor two-sided wrappingÞ ð17Þ
whereAfvis the area of the CFRPs,ffeis the effective tensile stress of CFRPs at ultimate state,dfis the depth of the joint wrapped by CFRPs,a is the angle of CFRPs to the hori-zontal axis,sfis the space between two CFRPs plies,bis the number of wrapping surfaces of members,nis the number of CFRPs plies,tfis the thickness of the CFRP sheet,wfis the reduction factor (wfis 0.85 for two-sided wrapping),efeis the effective strain level of CFRPs,Efis the elastic modulus of CFRPs, andefuis the ultimate strain of CFRPs.
References
ACI 352R. (2002). Recommendations for Design of beam– column connections in monolithic reinforced concrete structures. Farmington Hills, MI: American Concrete Institute.
ACI Committee 440. (2012). Guide for the design and con-struction of externally bonded FRP systems for strength-ening concrete structures, ACI 440.2R-02. USA: American Concrete Institute.
ACI 374.2R-13. (2013).Guide for testing reinforced concrete structural elements under slowly applied simulated seismic loads. ACI Committee 374.
ACI 318-14. (2014). Building code requirement for structure concrete (ACI 318-14). Farmington Hills, MI, USA: American Concrete Institute.
Al-Tarazi, E. (2000). The major gulf of the Aqaba earthquake, 22 November 1995—Maximum intensity distribution. Natural Hazards, 22(1), 17–27.
Antonopoulos, C. P., & Triantafillou, T. C. (2003). Experi-mental investigation of FRP-strengthening RC beam–col-umn joints.Journal of Composites for Constructions, 7(1), 39–49.
Bansal, P. P., Kumar, M., & Dar, M. A. (2016). Retrofitting of exterior RC beam–column joints using ferrocement jackets. Earthquakes and Structures, 10(2), 313–328.
Brena, S. F., & McGuirk, G. N. (2013). Advances on the behavior characterization of FRP-anchored carbon fiber-reinforced polymer (CFRP) sheets used to strengthen con-crete frames. International Journal of Concrete Structures and Materials, 7(1), 3–16.
Campione, G., Cavaleri, L., & Papia, M. (2015). Flexural response of external R.C. beam–column joints externally strengthened with steel cages.Engineering Structures, 104, 51–64.
Chen, T.-H. (2006). Development of a low invasive seismic retrofit solution for under-designed frame systems based on a metallic haunch.Master Thesis, University of Canterbury, Christchurch, New Zealand.
Del Vecchio, C., Di Ludovico, M., Balsamo, A., Prota, A., Man-fredi, G., & Dolce, M. (2014). Experimental investigation of exterior RC beam–column joints retrofitted with FRP system. Journal of Composites for Construction, 18(4), 04014002. Del Vecchio, C., Di Ludovico, M., Prota, A., & Manfredi, G.
(2015). Analytical model and design approach for FRP strengthening of non-conforming RC corner beam–column joints.Engineering Structures, 87,8–20.
Del Vecchio, C., Di Ludovico, M., Prota, A., & Manfredi, G. (2016). Modelling beam–column joints and FRP strength-ening in the seismic performance assessment of RC exist-ing frames.Composites Structures, 142,107–116. El-Amoury, T., & Ghobarah, A. (2002). Seismic rehabilitation
of beam–column joint using GFRP sheets. Engineering Structures, 24, 1397–1407.
Engindeniz, M., Kahn, L. F., & Zureick, A.-H. (2005). Repair and strengthening of reinforced concrete beam–column joints: State of the art.ACI Structural Journal, 102(2), 1–14. Eurocode 8. (2005).Design of structures for earthquake
resis-tance—Part 3: assessment and retrofitting of buildings, EN 1998-3-2005. Brussels, Belgium: European Committee for Standardization, CEN.
Genesio, G. (2012). Seismic assessment of RC exterior beam– column joint and retrofit with haunches using post-installed anchors. PhD Dissertation, Institut fu¨r Werkstoffe im Bauwesen der Universita¨t Stuttgart, Germany.
Grelle, S. V., & Sneed, L. H. (2013). Review of anchorage systems for externally bonded FRP laminates.International Journal of Concrete Structures and Materials, 7(1), 17–33. Kanamori, H., & Kikuchi, M. (1993). The 1992 Nicaragua earthquake: A slow tsunami earthquake associated with subducted sediments.Nature, 361,714–716.
KCI 2012. (2012). Design code of concrete structure. Seoul: Korean Concrete Institute.
KS B 0814. (2001). Method of tensile test for metallic materials. Seoul: Korean Standard Information Center.
KS B 0802. (2013).Method of tensile test for metallic materi-als. Seoul: Korean Standard Information Center.
KS F 2405. (2010). Standard test method for compressive strength of concrete. Seoul: Korean Standard Information Center.
Lee, J. Y., Kim, J. Y., & Oh, G. J. (2009). Strength deterioration of reinforced concrete beam–column joints subjected to cyclic loading.Engineering Structures, 31(9), 2070–2085. Liang, X.-W., Wang, Y.-J., Tao, Y., & Deng, M.-K. (2016). Seismic performance of fiber-reinforced concrete interior beam–column joints. Engineering Structures, 126, 432–445.
Mahmoud, M. H., Afefy, H. M., Kassem, N. M., & Fawzy, T. M. (2014). Strengthening of defected beam–column joints using CFRP.Journal of Advanced Research, 5,67–77. Ozbakkaloglu, T., & Saatcioglu, M. (2009). Tensile behavior of
FRP anchors in concrete.ASCE Journal of Composites for Construction, 13(2), 82–92.
Pampanin, S., Calvin, G. M., & Moratti, M. (2002). Seismic behaviour of R.C. beam–column joints designed for gravity loads. 12th European Conference on Earthquake Engi-neering. London, England.
Pampanin, S., Christopoulos, C., & Chen, T. H. (2006). Development and validation of a metallic haunch seismic retrofit system for existing under-designed RC frame buildings.Earthquakes Engineering & Structural Dynam-ics, 35,1739–1766.
Pantazopoulou, S., Tastani, S., Thermou, G., Triantafillou, T., Monti, G., Bournas, D., et al. (2016). Background to the European seismic design provisions for retrofitting RC elements using FRP materials.Structural Concrete, 17(2), 194–219.
Pantelides, C. P., Clyde, C., & Reaveley, L. D. (2002). Perfor-mance-based evaluation of reinforced concrete building exterior joints for seismic excitation.Earthquake Spectra, 18(3), 449–480.
Pantelides, C. P., Hansen, J., Nadauld, J., & Reaveley, L. D. (2008). Assessment of RC building exterior joints with substandard details. PEER Report No. 2002/18, Pacific Earthquake Engineering Research Centre, College of Engineering, University of California, Berkeley.
Petrone, F., Shan, L., & Kunnath, S. K. (2016). Modeling of RC frame buildings for progressive collapse analysis. Interna-tional Journal of Concrete Structures and Materials, 10(1), 1–13.
Priestley, M. J. N. (1997). Displacement-based seismic assess-ment of reinforced concrete buildings. Journal of Earth-quake Engineering, 1(1), 157–192.
Quintero-Febres, C. G., & Wight, J. K. (2001). Experimental study of reinforced concrete interior wide beam–column connections subjected to lateral loading. ACI Structural Journal, 98(4), 572–582.
Rashidian, O., Reza, A., Ahmadi, R., & Nav, F. M. (2016). Progressive collapse of exterior reinforced concrete beam– column sub-assemblages: Considering the effects of a transverse frame.International Journal of Concrete Struc-tures and Materials, 10(4), 479–497.
Realfonzo, R., Napoli, A., & Pinilla, J. G. R. (2014). Cyclic behavior of RC beam–column joints strengthened with FRP systems. Construction and Building Materials, 54, 282–297.
Ronagh, H. R., & Baji, H. (2014). On the FE modelling of FRP-retrofitted beam–column subassemblies. International
Journal of Concrete Structures and Materials, 8(2), 141–155.
Ruiz-Pinilla, J. G., Pallares, F. J., Gimenez, E., & Calderon, P. A. (2014). Experimental tests on retrofitted RC beam–col-umn joints underdesigned to seismic loads. General approach.Engineering Structures, 59,702–714.
Santersiero, G., & Masi, A. (2015). Seismic performance of RC beam–column joints retrofitted with steel dissipation jack-ets.Engineering Structures, 85,95–106.
Seismic Simulation Test Center of Pusan National University, Development of Technologies for Improvement of Seismic Performance on the Existing Low-rise Buildings, National Emergency Management Agency, 2011, 585 pp. (in Korean).
Shafaei, J., Hosseini, A., & Marafet, M. S. (2014). Seismic retrofit of external RC beam–column joints by joint enlargement using prestressed steel angles. Engineering Structures, 81, 265–288.
Sharma, A., Genesio, G., Reddy, G. R., Eligehausen, R., Pampanin, S., & Vaze, K. K. (2010). Experimental inves-tigations on seismic retrofitting of reinforced concrete beam–column joints. 14th Symposium on Earthquake Engineering. Roorkee: Indian Institute of Technology.
Sharma, A., Reddy, G. R., Eligehausen, R., Genesio, G., & Pampanin, S. (2014). Seismic response of reinforced con-crete frames with haunch retrofit solution. ACI Structural Journal, 111(3), 673–684.
Singh, V., Bansal, P. P., Kumar, M., & Kaushik, S. K. (2014). Experimental studies on strength and ductility of CFRP jacketed reinforced concrete beam–column joints. Con-struction and Building Materials, 55,194–201.
Suarez, G., Pardo, M., Dominguez, J., Ponce, L., Walter, M., Boschini, I., et al. (1995). The Limon, Costa Rica earth-quake of April 22, 1991: Back arc thrusting and collisional tectonics in a subduction environment. Tectonics, 14(2), 518–530.
Teraoka, M., Kanoh, Y., Sasaki, S., & Hayashi, K. (1996). An estimation of ductility in interior beam–column sub-assemblages of reinforced concrete frames.Journal-Society of Materials Science Japan, 45,1033–1041.
Truong, G. T., Kim, J.-C., & Choi, K.-K. (2017). Seismic per-formance of reinforced concrete columns retrofitted by various methods.Engineering Structures, 134,217–235. Tsonos, A.-D. (2010). Performance enhancement of R/C