R E S E A R C H
Open Access
Taguchi-Grey relation analysis for
assessing the optimal set of control
factors of thermal barrier coatings
for high-temperature applications
Mohammed Yunus
*, Mohammad S. Alsoufi and Shadi M. Munshi
Abstract
Background:In an aerospace industry, the efficient use of thermally sprayed coatings for high-temperature applications is achieved by improving the thermal characteristics (TC) such as thermal drop/barrier (TD) and thermal fatigue cycles (TFC). The characterization of ceramic coatings demands a better understanding of TC and their performance.
Methods: In this paper, an attempt has been made to use hybrid Taguchi design method based grey relation analysis (GRA) for optimizing the control factors such as the thickness of coating, type of coating, bond coating and exposed temperature. The necessary experiments were carried out using Taguchi L16 factorial design of experiments for analysis based on the larger the better signal-to-noise (S/N) ratio. The multi-response/output optimization and grading of control factors were successfully carried out by GRA.
Results: The significance of each factor as regards TD and TFC were investigated. The ANOVA results showed that most important parameters at 95 % confidence level and were validated with a confirmation test using optimum process factors. It shows an improvement in the TC of thermal barrier coatings.
Conclusions: This work revealed that the hybrid GRA with Taguchi technique had improved the durability and efficient usage of TBC for high-temperature applications.
Keywords: Thermal characteristics, Thermal drop, Hybrid Taguchi-Grey, Ceramic coatings, ANOVA
Background
The preparation of an engineering surface to withstand severe working conditions such as high temperature, corrosive environment, excessive wear and so on de-mands suitable surface modification techniques for exist-ing materials and alloys by coatexist-ing with thermally sprayed industrial ceramic coatings (Gibson et al. 2013; Javadi et al. 2014; Koilraj et al. 2012; Lakshminarayanan and Balasubramanian 2007; Pan et al. 2007; Yunus and Alsoufi 2016). Thermal barrier coatings (TBC) are cer-amic oxide coatings applied to the metal substrate and are widely used in aerospace, automobiles, gas turbines, and power generators and so on in order to increase the
life of engineering materials. TBCs, due to their low thermal conductivity, act as an insulator and protect the metal substrate from high temperature as well as the corrosive environment. Generally, TBCs consist of a pair of layers: the first layer is a metallic bond coat to protect the metal substrate from corrosion, oxidation and as well as increases adhesive intensity with a coating layer, whereas the second layer is ceramic oxide coating pro-tects metal from high temperature as well as from exces-sive wear and corrosion. The TBCs are generally applied on the substrate of a metal substrate. The desirable properties of these include high thermal expansion, low thermal conductivity and excellent thermal cycling resistance. In a complex and multivariate performance systems such as engineering design and material
characterization system, where many parameters
* Correspondence:[email protected]
Department of Mechanical Engineering, College of Engineering and Islamic Architecture, Umm Al-Qura University, Makkah, Kingdom of Saudi Arabia
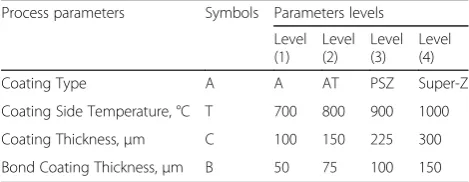
simultaneously influence the system to determine their state of development. Typically, we want to know the parameters which affect the system more or little. However, a relationship between various parameters is usually grey due to unclear, incomplete and uncertain information. Moreover, difficult to obtain practical and experimental data due to scattered too much to analyze. Two conventional statistical techniques (fac-tor and regression analysis) frequently used on the data consisting of the relationship between dependent and independent parameters. However, these analyses prescribe mutual influence between variables, the large volume of data and should conform to the typ-ical distribution. However, usually, difficult to obtain the internal factors relationship data. Therefore, trad-itional multivariate statistical methods possess a hard time in getting a convincing explanation. Therefore, a new analysis method needs to be addressed to over-come the disadvantages of regression and factor ana-lysis and multi-response method. Grey relational analysis (GRA) has been recommended to solve our problem, a kind of efficient tool to perform system analysis, lays a framework for modelling, forecasting, and clustering of grey systems. Grey relational has the many advantages such as small sample having no typ-ical distribution, no requirement of independent vari-ables and a small amount of calculation. Additionally, GRA analysis is already proved to be a straightfor-ward and accurate method for selecting parameters for those problems with unique characteristics (Gibson et al. 2013; Javadi et al. 2014; Koilraj et al. 2012; Laksh-minarayanan and Balasubramanian 2007; Mishra and Ma 2005; Pan et al. 2007; Yunus and Alsoufi 2015). Therefore, the present study will utilize the GRA to establish grey relational grade (GRG with a ranking scheme to place the series of the grey relationship be-tween both independent and dependent parameters. GRA is a judgment model for deciding influential pa-rameters in multi-output systems using rearranged GRG according to their magnitude order. Table 1 provides the control parameters and their levels adopted for studying the application of industrial ceramic
TBCs. Tests were conducted using Taguchi L16 orthog-onal array.
Grey relational analysis (GRA)
Deng Julong et al. presented the GRA approach (Cavaliere et al. 2008) for estimating the magnitude of the relationship between arrays of experiments using GRG. GRA is employable in the optimization of control
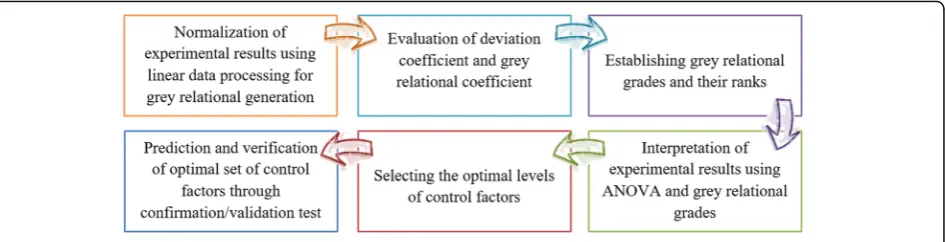
factors having multi-performances/responses/outputs
through the GRG (Cavaliere et al. 2008). Mostly, GRA is successfully utilized in a process with limited or inad-equate information (Fig. 1). Various stages involved in the GRA technique are:
Step No.1: Normalizing or data preprocessing would be the initial step conducted to normalize (transforming measured units into dimensionless parameters) the test results on the scale of zero and one due to the series of the degree of the process factors are different (Cavaliere et al. 2008; Lin 2002). In this grey relational generating step, initial series are changed into a collection of com-parable series. Several methods are available to pre-process the grey data. In this work, Taguchi design method based GRA used to optimize TC of TBCs at high-temperature application parameters for multiple response quality features such as TD and TFC to with-stand high temperature in studying the amount of bar-rier offered (temperature drop occurring across the coating) and lifespan of coatings over the metal sub-strate. Multiple objective features were depending upon the quality characteristics of the initial data. It represents the initial ideal array and preprocessed data (compatibil-ity series) byzjð Þh z0
jð Þh ,j= 1, 2, 3,…,u;h= 1, 2, 3,…,v,
whereuandvare the number of trials and data
obser-vations, respectively. Moreover, on the quality features of original data, the principal divisions identified for normalizing the initial series using either Eq. (1) for “smaller-the-better” or Eq. (2) for “larger-the-better” (Sharma et al. 2005):
z
j ¼
max z0jð Þh−z0jð Þh
max z0
jð Þh−min z0jð Þh ð1Þ
z
jð Þ ¼h z0
jð Þh −min z0jð Þh
max z0
jð Þh −min z0jð Þh ð
2Þ
where, max z0jðhÞ and minz0jðhÞ are the greatest and least values of z0jðhÞ, the series after the data processing
(or compatibility series) and zjð Þh is the original series
of the target/end value. In the present analysis, u= 16 andv= 2 are used.
Step No.2: Calculate the grey relational coefficient (GRC) using the deviation coefficient from Eq. (3). Deviation coefficient is defined as the arbitrary value Table 1Process parameters and their levels for thermal
characteristics of coatings
Process parameters Symbols Parameters levels
Level (1) Level (2) Level (3) Level (4)
Coating Type A A AT PSZ Super-Z
Coating Side Temperature, °C T 700 800 900 1000
Coating Thickness,μm C 100 150 225 300
of the variation between the compatibility and refer-ence series:
Δo
jð Þ ¼h z0jð Þh−zjð Þh ð3Þ
where, ΔojðhÞ is the deviation coefficient, zjðhÞ is the ideal series (or reference series) andz0
jðhÞis the
compat-ible series. The GRC is then determined using Eq. (4):
γ¼ ¼ z
0 hzjð Þh
|fflfflfflfflfflfflfflfflfflfflfflfflffl{zfflfflfflfflfflfflfflfflfflfflfflfflffl} GRCðbetween 0 and 1Þ
¼ΔΔominþς⋅Δmax
jð Þ þh ς⋅Δmax ð4Þ
Step No.3: Calculate the GRGs γz0⋅zj is obtained
by the weighted sum of theζGRC which represents the
level of relationship between ideal and compatible series and evaluated using Eq. (5):
γ z 0⋅zj
¼N1γ z
0ð Þh ⋅γ zjð Þh
ð5Þ
Step No.4: Ranking of GRG where GRGs are se-quenced in decreasing order to obtain the higher/leading value of the GRG which represents substantial correl-ation degree between the ideal and the compatible series. The maximum value of the GRG represents the optimal mixture/blend of process parameters for the aspired outputs.
Experimental methodology
In this wok, all experiments have been carried out on mild steel flat specimens coated with atmospheric plasma spraying method using commercial industrial ceramic coating powder materials operated at optimum
spray parameters. Alumina (Al2O3), Alumina-Titania
(Al2O3+ TiO2), Super-Z alloy (20 % Al2O3+ 80 % PSZ)
and partially stabilized zirconia (PSZ) and of varying
coating thicknesses (100 to 300 μm) were used for the
preparation of different coating surfaces. Using 40 KW Sulzer, Metco plasma spray with a seven MB gun; coat-ing powders sprayed on the substrate which was grit
blasted, degreased as well as applied with an alloy layer
of NiCrAl bond coat of 50 to 100μm thickness
accord-ing to the spray parameters.
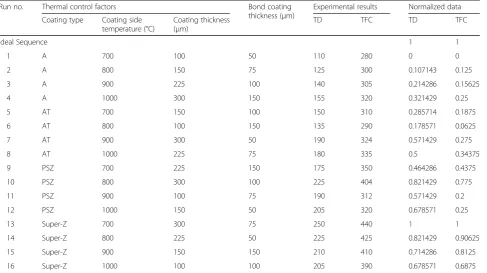
The experimentation on thermal characteristics was carried out using a high-temperature flame to estimate temperature drop across the thickness of coating called thermal drop (TD) and a number of cycles withstood known as thermal fatigue cycles (TFC) (Lakshminarayanan and Balasubramanian 2007). Four levels for every process parameter were selected without taking the parametric interaction effect into consideration. The control factors considered were the type of coating powder (A), the temperature on coating side (T), coating thickness (C) and bond coat thickness (B). The numerical values of control factors at various levels are depicted in Table 1. In multi-output optimization, it is always expected that there is some loss in quality characteristics when com-pared to a single-output optimization to always improve the overall quality. The proper adoption of various process factors and their assigned levels that stir these quality characteristics will enhance TCs. The graded characters examined were TD and TFC. The Taguchi design meth-odology for four factors of four levels is used to imple-ment the system of the orthogonal array (OA) trials/ experiments. An L16 OA having 16 × 4 array is utilized in the current work. The trials are conducted according to the pattern of the OA and the output values are obtained provide in Table 2.
Thermal drop/barrier test (TD)
Thermal drop tests were carried out by measuring the temperature of a metal substrate before and after heating the coating side surface in the range of 700 and 1000 °C for about 20 to 30 min to reach steady state. Temperature drop across the substrate and ceramic coating are noted down. A pair of thermocouples of chrome-alumel type
(K-type) has been used for measuring the temperature
difference values are measured for L16 OA as shown in Table 2 (Koilraj et al. 2012).
Thermal fatigue cycling (TFC) test
A thermal fatigue cycling test is carried out to inves-tigate the resistance or strength of coating as regards sudden changes in temperature (heating and cooling) (Javadi et al. 2014; Koilraj et al. 2012; Lakshminaraya-nan and Balasubramanian 2007; Mishra and Ma 2005) and to examine the withstanding of the sprayed coat-ings under the severity of thermal cycling. The TBCs were subjected to thermal fatigue cycles by heating the coated surface to an oxyacetylene flame until it reaches approximately 1000 °C temperature for about one minute and subsequently cooled down by air blow until the temperature drops to around 30 °C in the atmospheric conditions for about one minute. The TFC process will be repeated until the coated surface fails and peels off from the substrate to deter-mine the number of cycles it withstood as detailed in Table 3.
Results and discussion
Multi-response optimization of control factors using GRA
The performance of thermal characteristics is decided from the maximum value of TD and TFC of TBCs. Also,
TD and TFC are selected “higher-the-better” type for
normalization in GRA approach. We used Taguchi’s
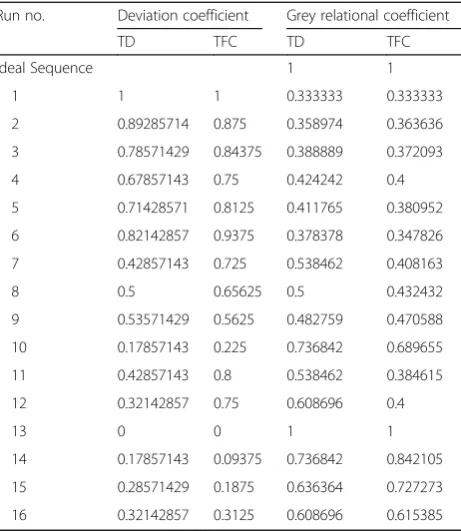
L16 OA to optimize the multiple-response of thermal characteristics of TBC to propose their use in the field of higher temperature applications. Thus, the data series have “larger-the-better” TCs. The “ larger-the-better”methodology using Eq. (2), was employed for data pre-processing (Das et al. 2014). The normalized values of TD and TFC are given in Table 3. The GRC (shown in Table 4) of TD and TFC was computed using Eq. (4) by the deviation sequences obtained from Eq. (3). All the control factors have equal weighting and set at 0.5. Next, the weight of both responses has been used to compute the GRG by using Eq. (5), for each trial are given in Table 4 (El-Gallab and Sklad 1998). Precise observations from Table 4 and Fig. 2, indicate that trial number 13 has the excellent performance for both re-sponses TD and TFC between all experiments as the larger GRG mean the comparable sequence is exhibiting a stronger correlation with the ideal series (Singh and Kumar 2004). GRA was employed to find the highest sig-nificant parameter based on the hypothesis that a mixture of the levels provides the greatest average response and is the optimal parameters combination to increase the life-span of TBC for high-temperature applications. From maximum average GRG, optimum parameter level has been found as A4T1C4B2, i.e., Super-Z coating material,
heating of coating at 700 °C, 300 μm coating thickness
and 75μm bond coat thickness. Response tables were gen-erated using the Taguchi design method to evaluate the Table 2Experimental output results and data processing of TC of TBCs
Run no. Thermal control factors Bond coating
thickness (μm)
Experimental results Normalized data
Coating type Coating side temperature (°C)
Coating thickness (μm)
TD TFC TD TFC
Ideal Sequence 1 1
1 A 700 100 50 110 280 0 0
2 A 800 150 75 125 300 0.107143 0.125
3 A 900 225 100 140 305 0.214286 0.15625
4 A 1000 300 150 155 320 0.321429 0.25
5 AT 700 150 100 150 310 0.285714 0.1875
6 AT 800 100 150 135 290 0.178571 0.0625
7 AT 900 300 50 190 324 0.571429 0.275
8 AT 1000 225 75 180 335 0.5 0.34375
9 PSZ 700 225 150 175 350 0.464286 0.4375
10 PSZ 800 300 100 225 404 0.821429 0.775
11 PSZ 900 100 75 190 312 0.571429 0.2
12 PSZ 1000 150 50 205 320 0.678571 0.25
13 Super-Z 700 300 75 250 440 1 1
14 Super-Z 800 225 50 225 425 0.821429 0.90625
15 Super-Z 900 150 150 210 410 0.714286 0.8125
average value of the GRG for each process parameter level, as illustrated in Table 5 for thermal characteristics of TBC coatings.
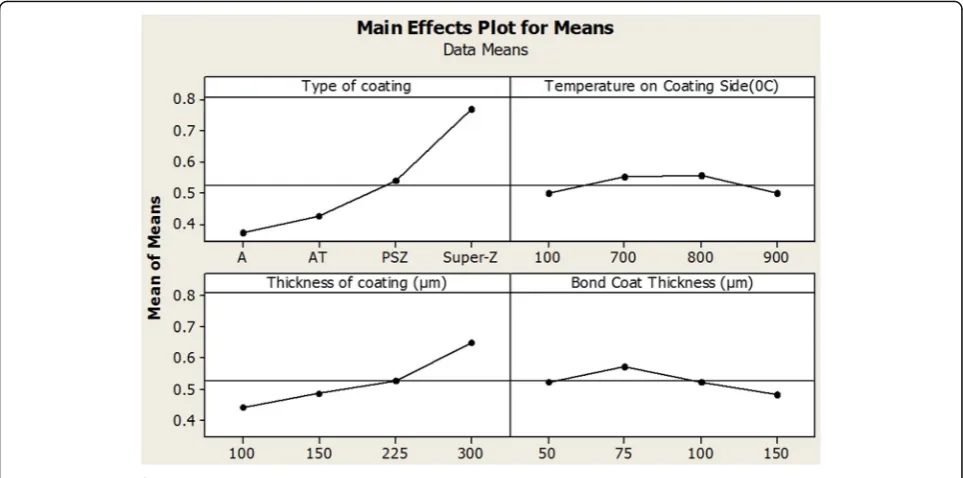
Table 5 shows the greatest values of GRG obtained for the combination of A4-T3-C4-B2. It depicts the optimal combination of TBC control factors for the multiple outputs of TC during estimation of lifespan for high-temperature applications. A4-T3-C4-B2 combination indi-cates the type of coating of Super-Z alloy, the temperature on coating side of 1000 °C, Coating thickness of 300 μm and bond coat thickness of 75μm. The main effect plots for means of GRG are shown in Fig. 2. The dashed lines in the main effect plots describe the total average of the GRG. Figure 3 reveals the different residual plots of
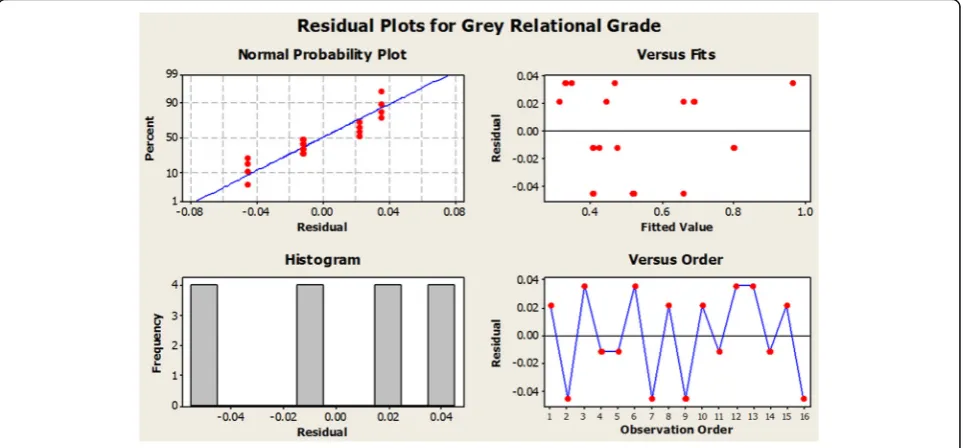
GRG which are evaluated to understand the effective-ness of method used in the optimization (Mohammed and Rahman 2011).
Analysis of variance (ANOVA) for GRG
ANOVA is employed to determine the grades or ranks of GRA at 95 % confidence level for investigating the signifi-cance level of control factors on multiple TC of TBC Coat-ings at high-temperature applications using Minitab® 17 statistical software (Sato and Kokawa 2003). A total sum of squared variances (SST) can be estimated using Eq. (6):
SST ¼ XN
j¼1
yj–ym
ð Þ2 ð6Þ
where, N= number of trials in the OA, yj= mean of
GRG for jth trial and ym= total average of GRG. Mean square (MS) can be obtained by dividing the SS by the corresponding degree of freedom (DF), i.e.,
MS¼DFSS ð7Þ
The most/principal significant process parameter (sig-nificant influence on the output attributes) is one which has a higherFvalue (or smallerPvalue). The percentage contribution of a parameter can be evaluated by dividing SST with the corresponding SS, as presented in Eq. (8). There is also a residual plot for GRG (Khalid 2005).
%of contribution¼SST
SS 100 ð8Þ
The ANOVA results for GRG of TBCs have been given in Table 6. It is seen that only the coating type played most significant thermal control factor for TD and TFC considered simultaneously during high temperature appli-cations of TB coatings. The percentage of contribution control factor of the type of coating for the multi-response thermal characteristics of TBCs is 72.98.
Verification of results using confirmation/ratification test
The optimal set of factors combination in achieving max-imum TD and TFC is obtained using Taguchi based GRA as A4-T3-C4-B2. A confirmation test was carried out by using an A4-T3-C4-B2 optimal setting. The results of the verification test were 265 °C for TD (temperature fall from coating side to substrate side) and TFC of 466 (number of cycles withstood). The validation test result is observed better than the experiments carried out in Table 3. Once, we find an optimal combination of TC process parameters and the principal significant parameter for TD and TFC of TBC, the final step would be to verify the practicability of proposed Taguchi design method based GRA by carrying
out some validation tests. The optimum GRG, гopt, is
computed as (Khalid 2005): Table 3Deviation and grey relational coefficients of thermal
characteristics of TBCs
Run no. Deviation coefficient Grey relational coefficient
TD TFC TD TFC
Ideal Sequence 1 1
1 1 1 0.333333 0.333333
2 0.89285714 0.875 0.358974 0.363636
3 0.78571429 0.84375 0.388889 0.372093
4 0.67857143 0.75 0.424242 0.4
5 0.71428571 0.8125 0.411765 0.380952
6 0.82142857 0.9375 0.378378 0.347826
7 0.42857143 0.725 0.538462 0.408163
8 0.5 0.65625 0.5 0.432432
9 0.53571429 0.5625 0.482759 0.470588
10 0.17857143 0.225 0.736842 0.689655
11 0.42857143 0.8 0.538462 0.384615
12 0.32142857 0.75 0.608696 0.4
13 0 0 1 1
14 0.17857143 0.09375 0.736842 0.842105
15 0.28571429 0.1875 0.636364 0.727273
16 0.32142857 0.3125 0.608696 0.615385
Table 4GRG response tables and their order
Run no. Grey relational grade Order Run no. Grey grade Order
1 0.333333 16 9 0.476673 7
2 0.361305 15 10 0.713249 3
3 0.380491 13 11 0.461538 10
4 0.412121 11 12 0.504348 6
5 0.396359 12 13 1 1
6 0.363102 14 14 0.789474 2
7 0.473312 8 15 0.681818 4
βopt ¼βmþ X
i¼1
c βi−βm
ð9Þ
where,βmis the total average of the GRG,βi, is the aver-age of the GRG of ithfactor at the optimum level, and c is the number of largest significant TBC control factors (Khalid 2005). In both cases, the values of TD and TFC for an optimal combination of control factors were adequately larger as compared to those of initial set of process parameters and equal to 0.8168. Additional experiments are performed at optimum levels of pa-rameters and the average of additional experimental results is taken for the verification/confirmation test.
Table 7 provides the predicted value of GRG and
cor-responding validation test results. It is noticed that TBC characteristics viz. TD is elevated from 226 to 265 °C and TFC is improved from 431 to 466 num-bers of cycles withstood.
Conclusions
Thermal characteristics experiments were carried out using TBCs as a coating material. We have accumulated the amount of thermal barrier (TD) and a number of thermal fatigue cycles (TFC) under various conditions and combinations of TBC param-eters. The Taguchi design based GRG approach was applied in the present investigation to optimize the multi-output of the control parameters of TC for high-temperature applications of TBC coatings. The follow-ing conclusions have been formed to summarize the results:
The evaluation of GRG quantifies the overall
performance of control factors of thermal characteristics for TBC coatings lifespan when used in high-temperature applications.
Taguchi design method based GRA is a very
helpful technique for performing multi-output Fig. 2Total mean of GRG vs. process parameters
Table 5Mean grey relational grade at each level
Process parameters Grey relational grade Max.–Min. Rank
Level (1) Level (2) Level (3) Level (4)
Coating Type 0.3718 0.4247 0.5390 0.7708 0.3990 1
Coating Side Temperature, °C 0.4987 0.5516 0.5568 0.4993 0.0581 4
Coating Thickness,μm 0.4425 0.4860 0.5282 0.6497 0.2072 2
Bond Coating Thickness,μm 0.5251 0.5723 0.5255 0.4834 0.0888 3
optimization to forecast the TD and TFC of TBCs at high temperature applications.
From the response table, the largest value of the
GRG is achieved for the type of coating of Super-Z
lloy, coating thickness of 300μm, the bond coating
thickness of 75 μm and temperature on coating
side of 1000 °C for thermal characteristics of TBC coatings for high-temperature applications. These could be recommended levels of TBC coating control parameters for high-temperature applications in the aerospace industry for maximizing thermal barrier/ drop (TD) and thermal fatigue cycles withstood (TFC) considered.
Results of ANOVA for the grades of the GRA
revealed that factor A (coating type) is the principal significant control factor of a thermal characteristic which affects the multi-output characteristics of
TBCs. The contribution of type of coatings of Super-Z alloy is quite large 72.98 % in comparison to the other set of control factors (coating thickness, bond coat thickness and temperature on coating side) of TBCs used in the aerospace industry. The best performance characteristics were obtained with these set of parameters.
Confirmation tests/experiments disclosed that the
improvement in GRG of an optimal combination of parameters is 0.9628 compared to an initial setting of parameters 0.8168. The optimum levels of TBC factors can bring several significant enhancements in the control factors.
Therefore, the GRA based on Taguchi design
method can be applied to an optimization of control factors of multi-output performance and using the combination of optimal TC process parameters, necessary improvement in the production of efficient TBCs for high temperature applications can be fulfilled.
Fig. 3Residual plots of GRG
Table 6Results of ANOVA on GRG
Parameters DF SS Adj MS F P Contribution
ratio
Coating Type 3 0.376542 0.125514 23.71 0.014 72.98
Coating Side Temperature, °C
3 0.012243 0.004081 0.77 0.582 2.37
Coating Thickness, μm
3 0.095492 0.031831 6.01 0.087 18.51
Bond Coat Thickness, μm
3 0.015810 0.005270 1.00 0.501 3.064
Error 3 0.015883 0.005924 - - 3.078
Total 15 0.515969 - - - 100.00
Table 7TBC performance results at high temperature using initial and optimal process parameters
Initial process parameters
Optimal process parameters
Prediction Experiment
Level A3-T3-C3-B3 A4-T3-C4-B2 A4-T3-C4-B2
TD 226 - 265
TFC 430 - 466
Authors’contributions
Authors have made substantial contributions to conception, design, in the acquisition of data, and analysis and interpretation of data. Authors participated in drafting the article or revising it critically for important intellectual content. Authors involved in the final approval of the version to be submitted.
Competing interests
The authors declare that they have no competing interests.
Received: 22 April 2016 Accepted: 4 October 2016
References
Cavaliere P, Squillace A, Panella F (2008) Effect of welding parameters on mechanical and micro structural properties of AA6082 joints produced by friction stir welding. J Mater Process Technol 200:364–372
Das DK et al (2014) Properties of ceramic-reinforced aluminium matrix composites–a review. Int J Mech Mater Eng 9(1):1–16
El-Gallab M, Sklad M (1998) Machining of Al/SiC particulate metal matrix composites: Part II: Workpiece surface integrity. J Mater Process Technol 83(1–3):277–285 Gibson BT et al (2004) Friction stir welding: Process, automation, and control. J
Manuf Proc 16(1):56–73.
Javadi Y, Sadeghi S, Najafabadi MA (2014) Taguchi optimization and ultrasonic measurement of residual stresses in the friction stir welding. Mater Des 55:27–34 Khalid, Terry (2005) An outsider looks at friction stir welding. Report #ANM-112N-05 Koilraj M et al (2012) Friction stir welding of dissimilar aluminium alloys AA2219
to AA5083–Optimization of process parameters using Taguchi technique. Mater Des 42:1–7
Lakshminarayanan AK, Balasubramanian V (2007) Process parameters optimization for friction stir welding of RDE-40 aluminium alloy using Taguchi technique. T Nonferr Metal Soc 18:548–554
Lin TR (2002) Optimization technique for face milling stainless steel with multiple performance characteristics. Int J Adv Manuf Technol 19(5):330–335 Mishra RS, Ma ZY (2005) Friction stir welding and processing. Mater Sci Eng R 50:1–78 Mohammed Y, Rahman JF (2011) Optimization of usage parameters of ceramic
coatings in high temperature applications using Taguchi design. Int J Eng Sci Tech (IJEST) 3(8):6364–6371
Pan LK et al (2007) Optimizing multiple quality characteristics via Taguchi method-based Grey analysis. J Mater Process Technol 182(1–3):107–116
Sato YD, Kokawa H (2003) Friction stir welding (FSW) process. Weld Int 17(11):852–853 Sharma P et al (2005) Process parameter selection for strontium ferrite sintered
magnets using Taguchi L9 orthogonal design. J Mater Process Technol 168:147–151
Singh H, Kumar P (2004) Tool wear optimization in turning operation by Taguchi method. Indian J Eng Mater Sci 11:19–24
Yunus M, Alsoufi MS (2015) A Statistical Analysis Of Joint Strength Of Dissimilar Aluminium Alloys Formed By Friction Stir Welding Using Taguchi Design Approach, Anova For The Optimization Of Process Parameters. IMPACT: Int J Res Eng Tech (IMPACT: IJRET) 3(7):63–70
Yunus M, Alsoufi MS (2016) Multi-output optimization of tribological characteristics control factors of thermally sprayed industrial ceramic coatings using hybrid Taguchi-grey relation analysis. Friction 3(4):208–216
Submit your manuscript to a
journal and benefi t from:
7 Convenient online submission 7 Rigorous peer review
7 Immediate publication on acceptance 7 Open access: articles freely available online 7 High visibility within the fi eld
7 Retaining the copyright to your article