O R I G I N A L A R T I C L E
Open Access
Microstructural simulation of friction stir
welding using a cellular automaton
method: a microstructure prediction of
AZ91 magnesium alloy
Parviz Asadi
1*, Mohammad Kazem Besharati Givi
1and Mostafa Akbari
2Abstract
Background:Recently, some researchers have simulated FSW using FEM and studied the influence of process parameters and tool geometry on material flow, welding force, and temperature and strain distributions during friction stir processing. Additionally, in terms of microstructure modeling, various approaches such as the Cellular Automaton (CA) model have been developed to simulate microstructural evolution during plastic deformation processes.
Method:In this work, a finite element model (FEM) is established to study the microstructure evolution during friction stir welding (FSW) of AZ91 magnesium alloy. To this aim, first, the hot compression tests at different temperatures and strain rates were carried out to achieve the flow stress curves. Then, the hardening parameter, the recovery parameter and the strain rate sensitivity were calculated according to flow stress results and using the Kocks−Mecking model. Next, a continuum based thermo-mechanically coupled rigid-viscoplastic FEM model was proposed in Deform-3D software to simulate the FSW of AZ91 magnesium alloy. To evaluate microstructure of the weld zone a model is proposed based on the combination of Cellular Automaton and Laasraoui-Jonas models.
Results:Temperature history, strain distribution and welding force are achieved through thermomechanical model and microstructure and grain size distribution are achieved by microstructure evolution model. The effects of rotational and traverse speeds on the grain size and microstructure of weld zone are considered.
Conclusion:There is a good agreement between results of numerical models and experiments in the aspects of welding forces, temperature history and grain size. Additionally, the proposed microstructure evolution model can simulate accurately the dynamic recrystallization (DRX) process during FSW and its resulted microstructure. Keywords:FSW simulation; Microstructural evolution; DRX; Cellular automaton; Laasraoui-Jonas model
Background
AZ91, a magnesium alloy, is one of the most commer-cially and commonly used magnesium alloys. This alloy, containing 9 wt% Al, 1 wt% Zn, and 0.2–0.3 wt% Mn as major alloying elements, contains a good combination of castability, mechanical strength, and ductility (Suresh et al. 2009). This has made AZ91 a popular light metal alloy especially among automotive industries whose aim is manufacturing lightweight vehicles (Srinivasan et al.
2010). However, the use of AZ91 in different industries is not yet extended comparing to its competitors such as aluminum alloys and plastics, partially due to the diffi-culty in controlling its microstructure (Asadi et al. 2010a).
Friction stir welding (FSW) as a relatively new welding technique has gained wide applications in different in-dustries such as aerospace, automotive, and maritime. It has been utilized to weld and process different aluminum (Heidarzadeh et al. 2015), Mg (Asadi et al. 2012; 2010b; Motalleb-nejad et al. 2014; Faraji and Asadi 2011), and Cu (Farrokhi et al. 2013) alloys, some of * Correspondence:[email protected]
1
School of Mechanical Engineering, College of Engineering, University of Tehran, Kargarshomali St, Po Box: 11155/4563, Tehran, Iran
Full list of author information is available at the end of the article
which are classified as practically unweldable alloys in use of conventional welding methods.
Recently, some researchers have simulated FSW using a finite element model (FEM). Buffa et al. (2013; 2012; 2006) simulated friction stir welding using a 3D finite element method. Their model effectively determines the relation-ships between the tool forces and process parameters. Shojaeefard et al. (2013) studied the influence of pin profile and shoulder diameter on material flow, welding force, temperature, and strain distributions. Marzbanrad et al. (2014) investigated the effect of tool pin profile, and Asadi et al. (2011a;Tutunchilar et al. 2012a) studied the effect of the process parameters on material flow, temperature, and strain distributions during friction stir processing.
It is clear that the grain size in the weld zone has a great influence on the mechanical properties of weld such as hardness, tensile strength, plasticity, and toughness prop-erties, and therefore, fine-grain structure could enhance these properties (Asadi et al. 2010b; Farrokhi et al. 2013; Heidarzadeh et al. 2014). Since it is difficult and time con-suming to investigate experimentally the microstructure of weld, numerical simulations could be very applicable in different manufacturing processes (Liu et al. 2013; Wang et al. 2010). In terms of microstructure modeling, various approaches such as the cellular automaton (CA), the Monte Carlo model, and the phase field model have been developed to simulate microstructural evolution during processes (Liu et al. 2013). Although all these models suc-cessfully simulate microstructural evolution, most of the CA model is employed because of its length scale calibra-tions and straightforward time. Discrete spatial and tem-poral evolution of complex systems via applying local or global deterministic or probabilistic transformation rules to the location of a lattice is the main algorithm of the CA method. Many researchers have shown that CA offers a computationally efficient framework for simulation of microstructural evolution (Liu et al. 2013).
Timoshenkov et al. simulated the microstructure evolu-tion in steel using CA for thermo-mechanical treatment. Tsai et al. (2010) predicted the morphologies in the solidi-fication process for Cu-0.6Cr (mass fraction, %) alloy and Wang et al. (2010) simulated the dynamic recrystallization (DRX) characteristic in hot compression of steel using the CA method. They stated that the CA model can simulate the nucleation and growth kinetics of dynamically recrys-tallized grains in hot working process. Besides these advantages, this method could not consider solely the effects of the process parameters on DRX and the rela-tionship between the nucleation sites and the distribution of dislocation density (Liu et al. 2013).
In fact, dislocation density plays a crucial role in nu-cleation and therefore, in microstructural evolution dur-ing DRX (Qian and Gou 2004). In order to evaluate the dislocation density, many models have been developed,
such as the Laasraoui-Jonas (LJ) model (Laasraoui and Jonas 1991), the Kocks-Mecking (KM) model (Mecking and Kocks 1981), and the Estrin-Mecking (EM) model (Yazdipour et al. 2007). These models are internal vari-able dislocation density models and deal with calculation of flow stress and evaluation of dislocation density dur-ing hot deformation processes. Additionally, the modi-fied LJ model (Gourdet and Montheullet 2003) considers the effects of grain boundary migration on dislocation density. Therefore, the modified LJ model grants a more realistic evolution for dislocation density. Li et al. (2012) used the LJ model to simulate the microstructural evolu-tion during hot extrusion of Mg-Al-Ca-based alloy. Similarly, Liu et al. (2013) simulated the DRX for hot compression of AZ31 magnesium alloy.
In the present study, a model is developed to simulate the microstructural evolution of AZ91 magnesium alloy during FSW. To this aim, first, the flow stress curves are obtained via the hot compression tests carried out at dif-ferent temperatures and strain rates. Then, the hardening parameter, the recovery parameter, and the strain rate sen-sitivity are calculated according to flow stress results. Next, a continuum based thermo-mechanically coupled rigid-viscoplastic FEM model for the FSW process is proposed in Deform-3D software coupled with the combination of CA and LJ models for microstructural evolution and dis-location density computation. The relationship between the nucleation rate and the dislocation density as well as between critical strain, critical dislocation density, and DRX are investigated. Next, the optical-microscope images from weld zone and base metal are used to validate the microstructure predicting model. Furthermore, nucleation and grain growth are shown by the micro-images extracted from simulation. Finally, the effect of the process parame-ters on grain size is studied.
Methods
The methods of this research include some experimental investigations and tests, numerical model for the process simulation, and the microstructure evolution formula-tion for modeling of dynamic recrystallizaformula-tion. All these methods are described in below.
Experimental setup
AZ91 magnesium alloy plates with the chemical compos-ition shown in Table 1 and in 5-mm thickness were fric-tion stir welded in different condifric-tions. The rotafric-tional and traverse speeds were varied between 710–1400 rpm and
Table 1Chemical composition of the AZ91 magnesium alloy used in this study
Element Al Zn Mn Si Cu Ni Fe Mg
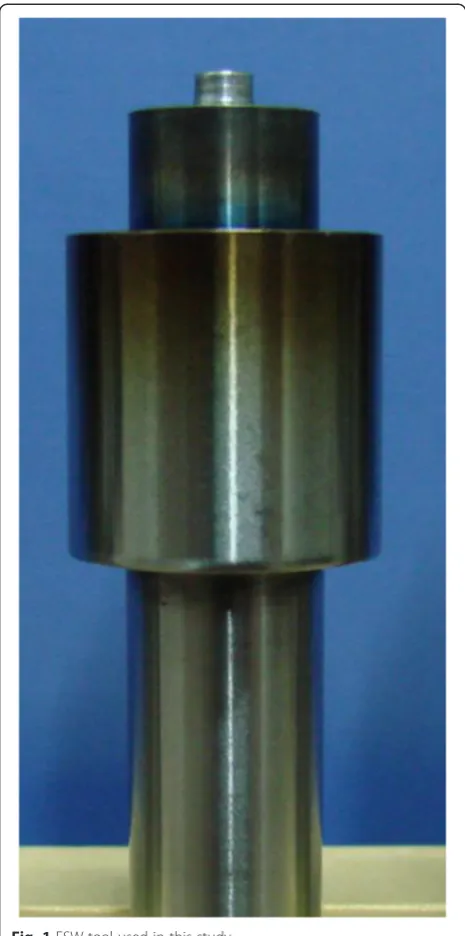
25–100 mm/min, respectively. The FSW tool was made of 2344 hot working steel with a circular pin in a 5-mm diameter and 4.8-mm height (Fig. 1). The tool shoulder diameter was 18 mm and the tool tilt angle was 3°. To track the temperature variations during the process, an in-frared thermometer with ±3 °C accuracy was employed. Meanwhile, a one-component Kistler dynamometer was utilized to measure the axial force.
The welded specimens were cut in transverse sections and prepared by standard metallographic techniques. The etching solution was composed of 5 mL acetic acid, 5 mL HCl, 6 g picric acid, 7 mL nitric acid, 100 mL ethanol, and 10 mL water for 1–2 s. Microstructural
observations of the samples were carried out by optical microscopy (OM), and a linear intercept method was employed to measure the average grain size (d= 1.74 L; L is the linear intercept size).
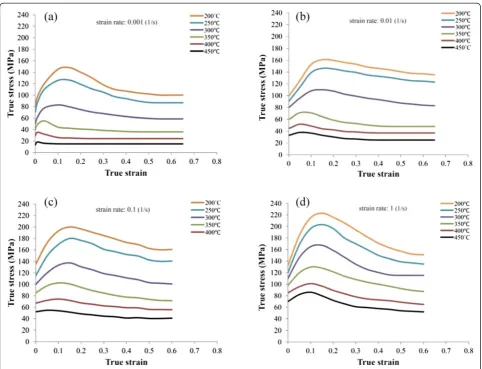
In order to acquire the flow stress of the AZ91 Mg alloy, hot compression test was conducted at different temperatures among 200–450 °C and strain rates of 0.001, 0.01, 0.1 and 1 s−1. The hot compression test specimens were 15 mm in height and 10 mm in diameter.
Numerical model of friction stir welding
Due to the ability of accurate modeling of severe plastic deformation (SPD) processes, Deform-3D™ software is employed to simulate the FSW (Tutunchilar et al. 2012a). To simplify the problem, the tool was selected as a rigid material and workpiece was supposed to be a rigid-viscoplastic material.
The Arrhenius equation was chosen to determine the relationship between the strain rate, the flow stress, and the temperature (Asadi et al. 2011a).
The tool and workpiece were meshed non-uniformly in about 25,000 and 58,000 tetrahedral elements, and an automatic remeshing system was utilized. Finer elements in 0.5 mm mean size were placed under the tool pin and shoulder. A shear friction factor of 0.4 was selected due to the best agreement between the experimental and simulated results for temperature history. Figure
2 illustrates the simulated model for welding of AZ91 magnesium alloy, and Fig. 3, comparing the temperature history and axial force results, shows a good agreement between the experimental and predicted forces.
Microstructure evolution model
The microstructural evolution during FSW of AZ91 magnesium alloy is simulated using the combination of CA and LJ methods in Deform-3D software which are coupled to the thermo-mechanically, rigid-viscoplastic FEM model of FSW.
Evidently, the dislocation density is the most effective fac-tor on nucleation and microstructure evolution during hot deformation processes (Liu et al. 2013; Qian and Gou 2004). Therefore, besides the temperature history, calcula-tion of dislocacalcula-tion density is crucial in microstructure evo-lution of the FSW process. The temperature history will be achieved via the FSW FEM model. However, the dislocation density calculation requires coupled models (such as CA and LJ).
Dislocation density calculation
The main factors affecting the dislocation density during plastic deformation are evidently these three concurrent phenomena: (1) work hardening (WH), (2) dynamic re-covery (DRV), and (3) DRX (Liu et al. 2013). In the
present research, the modified LJ model was employed to illustrate the evolution of dislocation density during DRX in the FSW process:
dρi¼ h−rρi
dε−ρidV ð1Þ
In this equation, ρi is the dislocation density in the ith
grain; h, the strain hardening parameter; r, the recovery coefficient parameter; ε, the strain; and dV, the volume swept by grain boundary movement. To precisely calcu-late the amount of parameters in LJ model (Eq. 1) the KM model is also used:
_
ρi¼ K1pffiffiffiffiρi−K2ρi
_
εp
eff ð2Þ
where K1 is the constant denoting the work hardening
and K2 is the softening parameter for dislocation
annihilation.
Nucleation and growth during DRX
Several nucleation models are developed for DRX, but Qian and Gou (2004), by proposing Eq. 2, showed that the nucleation rate is proportional linearly to strain rate and exponentially to temperature.
_
n¼Cεe_ −RTΔHabs ð3Þ
where ṅ represents the nucleation rate; ΔH, the activa-tion energy, acquirable by the flow curves; R, the gas constant; Tabs, absolute temperature; and C, a constant.
The relationship reveals that by increasing the process temperature and strain rate, the nucleation number raises.
In the metals with medium to low stacking fault energy such as Mg, the DRX onsets when the dislocation dens-ity reaches a critical value (Liu et al. 2013; Roberts and Ahlblom 1978). Generally, nuclei predominantly nucle-ate along the grain boundaries in which sufficient stored energy is present by a critical dislocation density:
ρcd¼
20γiε_
3blMτ2 ð4Þ
whereb represents the Burger’s vector;l, the dislocation free path;M, the grain boundary mobility;τ, the disloca-tion line energy; and γi, the grain boundary energy, which can be computed by Eq.5(Xiao et al.2008):
Fig. 2Simulated model in Deform-3D software for FSW of AZ91 magnesium alloy sheets
Fig. 3Simulation and experimental results foratemperature history andbaxial force. Rotational speed, 1400 rpm and traverse speed, 25 mm/min
γi¼ γm ; θi≥15
γm
θi θm
1−ln θi θm
; θi<15
8 <
: ð5Þ
Whereγmis the high angle grain boundary energy which
can be described by Equation6;θi, is the misorientation among the ith recrystallized grain and its neighbor; and θm, the misorientation between high angle boundaries.
γm¼
μbθm
4πð1−vÞ ð6Þ
where, vis the Poisson ratio.The grain boundary migra-tion velocity is influenced by the net pressure on the boundary and can be described as:
vi¼MFi 4πr2
i
ð7Þ
where vi represents the grain boundary migration vel-ocity;M, the grain boundary mobility;ri, the ith recrys-tallized grain radius; and Fi, the driving force is attainable through Eq.7.
Fi¼4πr2iτρi−8πriγi ð8Þ
Cellular automaton method
A representative volume in 1000 × 1000 μm is used in the CA model and discretized using 250,000 tetragonal cells. Each cell involves four variables: one variable for orientation showing the orientation of grain and calcu-lates the energy of grain boundary by Eqs. 5 and 6; one variable for status indicating which grain is recrystal-lized; one for dislocation density determining the site en-ergy by Eqs. 1 and 2; and one for color exhibiting different grains. The orientation is randomly selected to be between 0 and 180° for base metal and recrystallized grains, and dislocation density is set to be zero for re-crystallized grains. When the dislocation density goes beyond the critical value, obtained by Eq. 4, the DRX starts. Next, the nucleation rate can be calculated by Eq. 3 for each time step. In terms of recrystallized grain growth, the recrystallized grain can continuously grow until the driving force (Fi) is positive. The growth vel-ocity (vi) can be obtained through Eqs. 7 and 8 for each
time step. The radius of the ith recrystallized grain rep-resents the volume swept by the grain boundary. Then, the dislocation density can be calculated by Eq. 1 for each time step. These computations are terminated, when the pset strain is reached.The cells in which re-covery happens are random (Peckzak and Luton 1993), and to select certain number of lattices Nrfor recovery
occurrence in each time step, the following equation is selected:
Nr¼
2N1N2
K h dεð Þ
1−2mo ð9Þ
whereN1andN2represent the number of rows and
col-umns in cells and K is the material constant (Peckzak and Luton1993).
Work hardening and recovery parameters
The true stress-strain curves, obtained from the hot com-pression test, at different temperatures and strain rates are illustrated in Fig. 4. It is evident that the flow curves in-volve four stages of (1) work hardening, (2) transition, (3) softening, and (4) steady, up to breaking down. The single peak in the flow curves implies the occurrence of DRX (Asadi et al. 2011a; Xin et al. 2010). It can be observed from Fig. 4a–d that increase in temperature results in a re-duction in the incubation period. This phenomenon is mostly affected by the critical strain and dislocation accu-mulation rates (Song et al. 2014).The work hardening rate can be calculated from the slope of true stress-strain curves in the work hardening stage (Liu et al. 2013). The average strain hardening parameter (h) and the recovery coefficient parameter (r) can be calculated through Eqs. 10 and 11 (Gourdet and Montheullet 2003):
h¼h0ε_mexp mΔHb
RTabs
ð10Þ
r¼r0ε_−mexp −mΔHb
RTabs
ð11Þ
whereε_ represents the strain rate;m, the strain rate sen-sitivity; ΔHb, the activation energy for self-diffusion; h0,
the hardening parameter (in Eq.10); andr0, the recovery
parameter (in Eq.11).
By applying regression analysis for flow stress results, the values forh0,r0, andmare achieved as: 1.34e13, 15.6,
and 0.2, respectively (for more details see ref. (Liu et al. 2013; Guangyin et al. 2001; Unigovski 2009)). The mater-ial parameters used in the simulation process are summa-rized in Table 2.
Results and discussion
Temperature history and strain distribution during FSW
It is well-accepted that frictional heat and plasticizing action formed by the FSW tool over the process causes the joining of two parts. Generation of a certain amount
of frictional heat along with the presence of a high hydrostatic pressure along the joint line are the crucial requirements during the FSW to keep the processing material in a well-plasticized region with a suitable temperature, and finally to form a sound weld.
Figure 5 shows temperature distribution in the cross section of welds produced by different rotational and traverse speeds. It is obvious that, for all welding condi-tions, temperature profile is nearly symmetric about the weld line, since the tool rotational speed is a dominating factor in heat generation rather than the tool traverse speed (Buffa et al. 2006). Furthermore, the figure reveals that the peak temperature grows as an increase in rota-tional speed or a decrease in traverse speed takes place. In summary, it can be mentioned that by increasing the rotational speed to traverse speed ratio (w/v) the heat generation will be increased.
The strain distribution in the cross section of weld is shown in Fig. 6 for welds produced by different rotational and traverse speeds. It is obvious that the strain profiles are asymmetric about the weld line and the maximum
Table 2Materials parameters for AZ91 magnesium alloy used in simulation model
Material parameter Value
Primary dislocation density,
ρ0(μm− 2
) 0.01 (Liu et al.2013)
Shear modulus,G(MPa) 17,000 (Guangyin et al.Knezevic et al.2010) 2001;
Activation energy for
self-diffusion,ΔHbmolkJ 140 (Guangyin et al.2001)
Activation energy,ΔHkJ
mol 147
Material constant in Eq. 9,K 6030 (Liu et al.2013)
Shear friction factor,m 0.4
Hardening parameter,h0 1.34e13
Recovery parameter,r0 15.6
Strain rate sensitivity,m 0.2
strain is biased towards the advancing side because of the positive combination of the traverse and rotational speeds which leads to a higher plastic deformation and strain rate (Asadi et al. 2011a; Tutunchilar et al. 2012a).
It can be seen that an increase in the rotational speed or a decrease in the traverse speed results in an increase in the amount of strain. Indeed by increasing the rota-tional speed to traverse speed ratio (w/v), the tool pin rotation rate in a certain distance increases, leading to a rise in strain of material under processing.
Microstructure evolution during FSW
It is well-known that DRX during FSW will cause the gen-eration of fine equiaxed grains in the stir zone. Process pa-rameters, tool geometry, welding material composition, temperature history, vertical pressure, and active cooling are the effective factors on the microstructure and grain size of the weld (Besharati Givi and Asadi 2014). In this paper, the effects of FSW on the microstructure of base metal as well as the effects of process parameters on the
microstructure of stir zone are discussed by simulation results.
Song et al. (2014) simulated the microstructure evolu-tion during FSW of titanium alloy using CA model and reported that their established model is more suitable for hot compression process. However, they did not compare the grain size with an experimental microstruc-ture and did not report any simulated microstrucmicrostruc-ture of the weld zone.
As mentioned before, the combination of LJ and KM models is employed to analyze the microstructural evo-lution of AZ91 magnesium alloy during the FSW. Fig. 7 shows the experimental and simulated microstructures for the base metal. In fact, according to the average grain size of the experimental microstructure, the number of grains in a certain area of CA cell (1000 × 1000 μm) can be obtained. Next, in this area a determined number of nuclei are distributed randomly and are then allowed to grow. The microstructure obtained by simulation for base metal can be seen in Fig. 7a, in which the different grains are represented by different colors while the black
Fig. 5Temperature distribution in the weld zonea1400 rpm, 25 mm/min;b1400 rpm, 50 mm/min; andc710 rpm, 50 mm/min
lines show the grain boundaries. The grain size distribu-tion in this figure indicates the average grain size of
~130 μm. Grain size in the experimental base metal
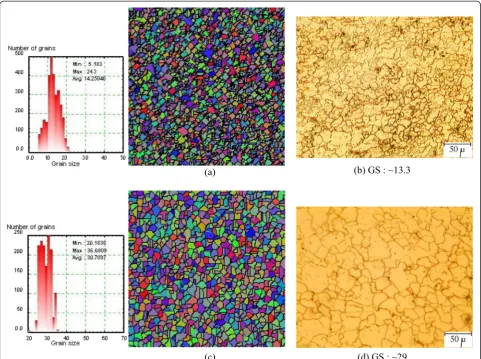
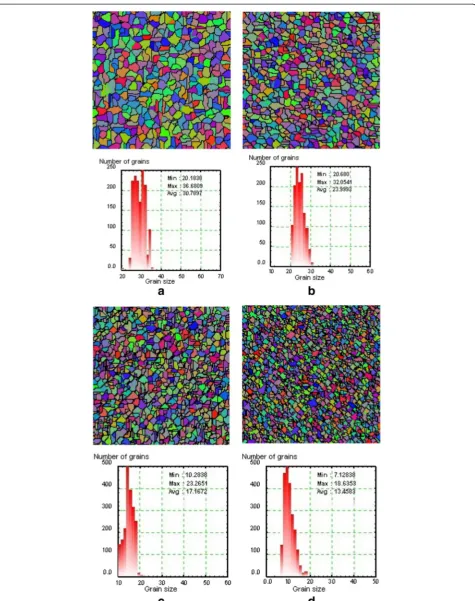
(Fig. 7b), calculated by linear intercept, is also about 130μm. To verify the ability of presented model in predicting the microstructure of weld zone, the simulated microstructures are compared with the experimental ones in Fig. 8 for the specimens produced by rotational and traverse speeds of 710 rpm × 50 mm/min and 1400 rpm × 25 mm/min. Com-paring the average grain size for simulated and experimen-tal microstructures reveals a good agreement between them. It demonstrates that the model presented for simula-tion of recrystallizasimula-tion during FSW of AZ91 magnesium alloy works precisely and can be employed to predict the microstructure and grain size in the stir zone.
As cited before, by increasing thew/v, the heat gener-ation is increased and therefore the grain growth and
grain size will be increased. Thew/vratio for Fig. 8a, b is 710
50 ¼14:2 , and it is 140025 ¼56 for Fig. 8c, d. In this
case, the grain size is increased from 13.3μm in Fig. 8b to 29μm in Fig. 8d.
Comparing the microstructures for base metal and weld zone (Figs. 7 and 8), and as reported widely in literature, the grain size is reduced drastically by FSW (from 130μm in base metal to 10–30μm in the weld zone). The combin-ation of high temperature, as a result of frictional heat, and high strain rate, due to the severe plastic deformation, leads to generation of fine recrystallized grains in the stir zone (Fig. 8) (Asadi et al. 2012; 2010b). Therefore, the grain re-finement occurs by the DRX including nucleation and growth. The presented model can precisely reveals the changes in microstructure during the DRX process.
Figure 9 shows the nucleation and grain growth steps simulated by the presented model. This figure clearly
Fig. 7aSimulated andbexperimental; microstructure of base metal
illustrates that the new grains nucleate from the old
grains’ boundary (Fig. 9b) and then start to grow
(Fig. 9c). Indeed, the nucleation of new grains occurs in the preferential sites, and then, due to the presence of enough heat and the dislocation density difference, the grain growth begins and continues as far as the driving force for boundary migration is positive. Since in the center of stir zone, there are enough heat and strain rate, the microstructure is filled all by the recrystallized fine grains (Fig. 9e).
In each step (Fig. 9a–e), the figures on the left side and middle shows the microstructure of stir zone and the figure on the right side illustrates the dislocation accumulation map of that step. The darker points in the dislocation accumulation map represent the areas with higher dislocation density. Noting to the disloca-tion accumuladisloca-tion maps at different steps, it can be concluded that, by nucleation and growth, white points form inside the dark areas in the map and on-set to consume them. Therefore, little by little, the
dark areas reduce demonstrating the reduction of dis-location density.
It should be stated that by deformation progress, the dislocation density goes beyond a critical value and the DRX initiates. Then, the new grains with zero disloca-tion density start to grow. On the other side, the simul-taneous work hardening generates dislocation density inside the DRX grains and thus, the driving force for grain boundary migration drops down as far as the growth stops. On the other words, the driving force for the grain growth reduces gradually as its dislocation density inside the grain increases with deformation pro-gress and finally the grain growth ceases. Also in another case, if the DRX grain sticks into another, both grains cease to grow at the clash point, while free sections of their boundaries can continue the growth. Additionally, in very high deformation rates, the DRX grain’s boundar-ies again can become nucleation sites, if its dislocation density reaches the critical value for nucleation (Liu et al. 2013; Song et al. 2014).
Fig. 9a–eNucleation and grain growth steps simulated by the presented model to predict the microstructure in stir zone.Leftandmiddle: snapshot of microstructure of the weld zone during DRX, andright: dislocation accumulation
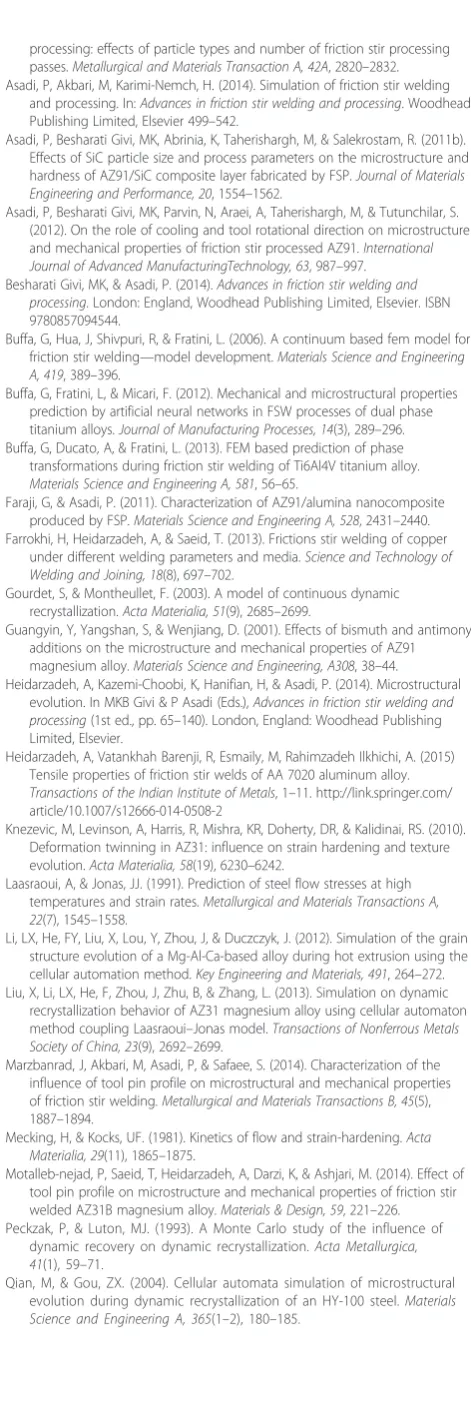
Fig. 11Microstructure of stir zone in the weld produced in rotational speed of 1400 rpm and traverse speed ofa25,b50,c80, and d100 mm/min
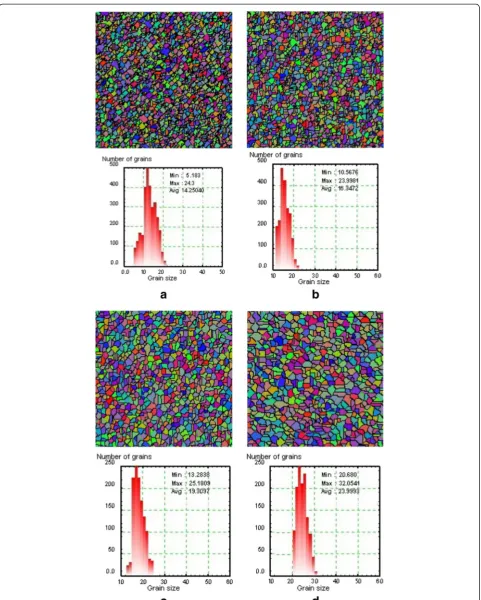
Figure 10, illustrating the microstructure and grain size distribution for welds simulated in different rotational speeds, reveals that the average grain size in the stir zone rises as the tool rotational speed increases. This result is widely reported by experimental works (Besharati Givi and Asadi 2014; Asadi et al. 2011b). Similarly, Fig. 11 shows the microstructure and grain size distribution for the welds simulated in different traverse speeds where the rotational speed is 1400 rpm. It is clear that by increasing the traverse speed, the average grain size reduces. Indeed, increase inw/vresults in a rise in the amount of generated heat and peak temperature, leading to acceleration of grain growth step, and thus, the final microstructure will contain larger grains (Salekrostam et al. 2010; Tutunchilar et al. 2012b).
Conclusions
In this work, a finite element model is established to study the microstructure evolution during FSW of AZ91 magnesium alloy. The hardening parameter, the recovery parameter, and the strain rate sensitivity, required for the model, are calculated according to flow stress results. A continuum based thermo-mechanically coupled rigid-viscoplastic FEM model is proposed in Deform-3D soft-ware to simulate the FSW of AZ91. To evaluate micro-structure of the weld zone, a model is proposed based on the combination of cellular automaton and Laasraoui-Jonas models. Results show that the simulated microstruc-ture of the weld zone has a good agreement with that of the experiments. The proposed model can simulate the dynamic recrystallization process during friction stir weld-ing and predict the grain size and microstructure of the weld zone precisely. The simulated grain size under differ-ent process parameters reveals that by increasing thew/v parameter, the grain size increases.
Competing interests
The authors declare that they have no competing interests.
Authors’contributions
PA carried out all the experimental tests. PA and MA performed the simulation of process and microstructural evolution method and formulation. MK and BG edited the manuscript as the supervisor of the project. All authors read and approved the final manuscript.
Author details
1
School of Mechanical Engineering, College of Engineering, University of Tehran, Kargarshomali St, Po Box: 11155/4563, Tehran, Iran.2School of
Automotive Engineering, Iran University of Science and Technology, Tehran, Iran.
Received: 5 June 2015 Accepted: 19 July 2015
References
Asadi, P, Faraji, G, & Besharati, MK. (2010a). Producing of AZ91/SiC composite by friction stir processing (FSP).International Journal of Advanced
ManufacturingTechnology, 51, 247–260.
Asadi, P, Faraji, G, Masoumi, A, & Besharati Givi, MK. (2010b). Experimental investigation of magnesium-base nanocomposite produced by friction stir
processing: effects of particle types and number of friction stir processing passes.Metallurgical and Materials Transaction A, 42A, 2820–2832. Asadi, P, Akbari, M, Karimi-Nemch, H. (2014). Simulation of friction stir welding
and processing. In:Advances in friction stir welding and processing. Woodhead Publishing Limited, Elsevier 499–542.
Asadi, P, Besharati Givi, MK, Abrinia, K, Taherishargh, M, & Salekrostam, R. (2011b). Effects of SiC particle size and process parameters on the microstructure and hardness of AZ91/SiC composite layer fabricated by FSP.Journal of Materials Engineering and Performance, 20, 1554–1562.
Asadi, P, Besharati Givi, MK, Parvin, N, Araei, A, Taherishargh, M, & Tutunchilar, S. (2012). On the role of cooling and tool rotational direction on microstructure and mechanical properties of friction stir processed AZ91.International Journal of Advanced ManufacturingTechnology, 63, 987–997. Besharati Givi, MK, & Asadi, P. (2014).Advances in friction stir welding and
processing. London: England, Woodhead Publishing Limited, Elsevier. ISBN 9780857094544.
Buffa, G, Hua, J, Shivpuri, R, & Fratini, L. (2006). A continuum based fem model for friction stir welding—model development.Materials Science and Engineering A, 419, 389–396.
Buffa, G, Fratini, L, & Micari, F. (2012). Mechanical and microstructural properties prediction by artificial neural networks in FSW processes of dual phase titanium alloys.Journal of Manufacturing Processes, 14(3), 289–296. Buffa, G, Ducato, A, & Fratini, L. (2013). FEM based prediction of phase transformations during friction stir welding of Ti6Al4V titanium alloy.
Materials Science and Engineering A, 581, 56–65.
Faraji, G, & Asadi, P. (2011). Characterization of AZ91/alumina nanocomposite produced by FSP.Materials Science and Engineering A, 528, 2431–2440. Farrokhi, H, Heidarzadeh, A, & Saeid, T. (2013). Frictions stir welding of copper
under different welding parameters and media.Science and Technology of Welding and Joining, 18(8), 697–702.
Gourdet, S, & Montheullet, F. (2003). A model of continuous dynamic recrystallization.Acta Materialia, 51(9), 2685–2699.
Guangyin, Y, Yangshan, S, & Wenjiang, D. (2001). Effects of bismuth and antimony additions on the microstructure and mechanical properties of AZ91 magnesium alloy.Materials Science and Engineering, A308, 38–44. Heidarzadeh, A, Kazemi-Choobi, K, Hanifian, H, & Asadi, P. (2014). Microstructural
evolution. In MKB Givi & P Asadi (Eds.),Advances in friction stir welding and processing(1st ed., pp. 65–140). London, England: Woodhead Publishing Limited, Elsevier.
Heidarzadeh, A, Vatankhah Barenji, R, Esmaily, M, Rahimzadeh Ilkhichi, A. (2015) Tensile properties of friction stir welds of AA 7020 aluminum alloy.
Transactions of the Indian Institute of Metals, 1–11. http://link.springer.com/ article/10.1007/s12666-014-0508-2
Knezevic, M, Levinson, A, Harris, R, Mishra, KR, Doherty, DR, & Kalidinai, RS. (2010). Deformation twinning in AZ31: influence on strain hardening and texture evolution.Acta Materialia, 58(19), 6230–6242.
Laasraoui, A, & Jonas, JJ. (1991). Prediction of steel flow stresses at high temperatures and strain rates.Metallurgical and Materials Transactions A, 22(7), 1545–1558.
Li, LX, He, FY, Liu, X, Lou, Y, Zhou, J, & Duczczyk, J. (2012). Simulation of the grain structure evolution of a Mg-Al-Ca-based alloy during hot extrusion using the cellular automation method.Key Engineering and Materials, 491, 264–272. Liu, X, Li, LX, He, F, Zhou, J, Zhu, B, & Zhang, L. (2013). Simulation on dynamic
recrystallization behavior of AZ31 magnesium alloy using cellular automaton method coupling Laasraoui–Jonas model.Transactions of Nonferrous Metals Society of China, 23(9), 2692–2699.
Marzbanrad, J, Akbari, M, Asadi, P, & Safaee, S. (2014). Characterization of the influence of tool pin profile on microstructural and mechanical properties of friction stir welding.Metallurgical and Materials Transactions B, 45(5), 1887–1894.
Mecking, H, & Kocks, UF. (1981). Kinetics of flow and strain-hardening.Acta Materialia, 29(11), 1865–1875.
Motalleb-nejad, P, Saeid, T, Heidarzadeh, A, Darzi, K, & Ashjari, M. (2014). Effect of tool pin profile on microstructure and mechanical properties of friction stir welded AZ31B magnesium alloy.Materials & Design, 59, 221–226. Peckzak, P, & Luton, MJ. (1993). A Monte Carlo study of the influence of
dynamic recovery on dynamic recrystallization.Acta Metallurgica, 41(1), 59–71.
Roberts, W, & Ahlblom, B. (1978). A nucleation criterion for dynamic recrystallization during hot working.Acta Metallurgica, 26(5), 801–813. Salekrostam, R, Besharati Givi, MK, Asadi, P, & Bahemmat, P. (2010). Influence
of friction stir processing parameters on the fabrication of SiC/316L surface composite.Defect and Diffusion Forum, 297, 221–226. Shojaeefard, MH, Khalkhali, A, Akbari, M, & Asadi, P. (2013).Investigation of
friction stir welding tool parameters using FEM and neural network
(Proceedings of the Institution of Mechanical Engineers, Part L: Journal of Materials Design and Applications).
Song, KJ, Dong, ZB, Fang, K, Zhan, XH, & Wei, YH. (2014). Cellular automaton modelling of dynamic recrystallisation microstructure evolution during friction stir welding of titanium alloy.Materials Science and Technology, 30(6), 700–711.
Srinivasan, A, Pillai, UTS, & Pai, BC. (2010). Effects of elemental additions (Si and Sb) on the ageing behavior of AZ91 magnesium alloy.Materials Science and Engineering A, 527, 6543–6550.
Suresh, M, Srinivasan, A, Ravi, KR, Pillai, UTS, & Pai, BC. (2009). Influence of boron addition on the grain refinement and mechanical properties of AZ91 Mg alloy.Materials Science and Engineering A, 525, 207–210. Tsai, DC, & Hwang, WS. (2010). Numerical simulation of solidification
morphologies of Cu-0.6Cr casting alloy using modified cellular automaton model.Transactions of Nonferrous Metals Society of China, 20(6), 1072–1077.
Tutunchilar, S, Haghpanahi, M, Besharati Givi, MK, Asadi, P, & Bahemmat, P. (2012a). Simulation of material flow in friction stir processing of a cast Al–Si alloy.Materials and Design, 40, 415–426.
Tutunchilar, S, Besharati Givi, MK, Haghpanahi, M, & Asadi, P. (2012b). Eutectic Al–Si piston alloy surface transformed to modified hypereutectic alloy via FSP.Materials Science and Engineering A, 534, 557–567.
Unigovski, YB. (2009). Creep-rupture behavior of Die-cast magnesium alloys.
Journal of Metals, Materials and Minerals, 19(1), 1–7.
Wang, KL, Fu, MW, & Lu, J. (2010). FEM-based modeling of dynamic recrystallization of AISI 52100 steel using cellular automaton method.Key Engineering Materials, 447, 406–411.
Xiao, NM, Zheng, CW, Li, DZ, & Li, YY. (2008). A simulation of dynamic recrystallization by coupling a cellular automaton method with a topology deformation technique.Computer Materials Science, 41(3), 366–374. Xin, RL, Wang, BS, Zhou, Z, Huang, GJ, & Liu, G. (2010). Effect of strain rate and
temperature on microstructure and texture for AZ31 during uniaxial compression.Transactions of Nonferrous Metals Society of China, 20, 594–598. Yazdipour, N, Dehghan-Manshadi, A, Davies, CHJ, & Hodgson, PD. (2007).
Simulation of dynamic recrystallization using irregular cellular automata.
Materials Forum, 31, 164–176.
Submit your manuscript to a
journal and benefi t from:
7Convenient online submission 7Rigorous peer review
7Immediate publication on acceptance 7Open access: articles freely available online 7High visibility within the fi eld
7Retaining the copyright to your article
Submit your next manuscript at 7 springeropen.com