Modeling the Fresh and Hardened Stage Properties of
Self-Compacting Concrete using Random Kitchen Sink Algorithm
Dhanya Sathyan
1),* , Kalpathy Balakrishnan Anand
1), Aravind Jaya Prakash
1),
and Bhavukam Premjith
2)(Received June 14, 2017, Accepted January 15, 2018)
Abstract: High performance concrete especially self compacting concrete (SCC) has got wide popularity in construction industry because of its ability to flow through congested reinforcement without segregation and bleeding. Even though European Federation of National Associations Representing for Concrete (EFNARC) guidelines are available for the mix design of SCC, large number of trials are required for obtaining an SCC mix with the desired engineering properties. The material and time requirement is more to conduct such large number of trials. The main objective of the study presented in this paper is to demonstrate use of regularized least square algorithm (RLS) along with random kitchen sink algorithm (RKS) to effectively predict the fresh and hardened stage properties of SCC. The database for testing and training the algorithm was prepared by conducting tests on 40 SCC mixes. Parametric variation in the SCC mixes were the quantities of fine and coarse aggregates, superplasticizer dosage, its family and water content. Out of 40 test results, 32 results were used for training and 8 set results were used for testing the algorithm. Modelling of both fresh state properties viz., flowing ability (Slump Flow), passing ability (J Ring), segregation resistance (V funnel at 5 min) as well as hardened stage property (compressive strength) of the SCC mix was carried out using RLS and RKS algorithm. Accuracy of the model was checked by comparing the predicted and measured values. The model could accurately predict the properties of the SCC within the experimental domain.
Keywords:self compacting concrete, rheological properties of SCC, hardened properties of SCC, regularized least squares, random kitchen sink.
1. Introduction
In the construction of heavily reinforced structural mem-bers one of the biggest problems encountered is the com-paction of concrete. Improper comcom-paction can lead to low quality and poor performance. In such structures it is diffi-cult to use mechanical vibrators or manual compaction methods and the solution is to develop a mix which does not need compaction. This led to the introduction of self com-pacting concrete in the late 1980s by Nagamoto and Ozava (1999). The fresh stage characteristics of SCC include high passing ability to flow through congested reinforcements under its own weight, flowing ability to flow and fill the formwork under self weight and segregation resistance. The above requirements of SCC can be measured using J ring
test, slump flow test and V funnel test at 5 min respectively. The hardened stage properties of SCC include its compres-sive strength, split tensile strength etc. The mix propor-tioning of SCC is done in such a way that it satisfies the rheological and hardened properties.
As it is very difficult to establish a general relation between the SCC properties and its ingredients a large number of trials (involving time, material and labour) are generally needed to get an SCC mix with required rheo-logical and hardened properties. This brings out the impor-tance of modeling the fresh and hardened stage properties of SCC. The common trend in most of the studies that have been reported is to adopt analytical equation relating the required properties of SCC with its ingredients and then optimizing this equation using regression analysis. These methods are less efficient in the case of nonlinearly separable data (Chien et al.2010). Tools like artificial neural networks (ANN), fuzzy logic etc., have been used to model non lin-early separable data, but if the data size is big they need large space for storing the data and require lot of computational time. Hence a modeling approach which is good for non-linearly separable data with the advantage of limited data storage space and computation time requirement for analysis has greater utility. RKS has been proved as one of such modeling method (Nair et al.2015).
1)
Department of Civil Engineering, Amrita School of Engineering, Amrita Vishwa Vidyapeetham, Coimbatore, Tamil Nadu 641112, India.
*Corresponding Author; E-mail: [email protected]
2)Center for Computational Engineering and Networking,
Amrita School of Engineering, Amrita Vishwa
Vidyapeetham, Coimbatore, Tamil Nadu 641112, India.
CopyrightÓThe Author(s) 2018
International Journal of Concrete Structures and Materials DOI 10.1186/s40069-018-0246-7
2. Background Literature
EFNARC guidelines are available for the mix proportioning of SCC. Compared to conventional concrete, the proportion-ing is complex and no theoretical relationships have been developed between the mixture proportioning and the mea-sured fresh or hardened stage properties of SCC. Large numbers of trials needed to develop SCC mix with the desired properties will lead to wastage of materials and time. This paper demonstrates a nonparametric approach of effectively using regularized least square algorithm along with random kitchen sink algorithm to predict the fresh stage and hardened properties of SCC. Using the experimental data generated in the laboratory, the relationship between the engineering properties and mix proportions are generated. This generated model will be useful to obtain the properties of SCC mixes avoiding the physical performance of the test in laboratory and also reduce the wastage of material and time.
Literature review brings out earlier studies related to the prediction of concrete properties using ANN, fuzzy logic, support vector machines (SVM), design of experiments (DOE) etc. Highlights of some of the recent works related to the prediction are included in this section.
Using fuzzy logic and ANN, the strength of high strength concrete was predicted by Gokmen Tayfur et al. (2014) and a comparative study between the two models was also done. To compare between the models their root mean square error (RMSE), mean relative error (MRE) and mean absolute error (MAE) was found out. Results showed lesser errors for fuzzy logic compared to ANN for the training data set. Testing data error is less for ANN which shows the better prediction capabilities of ANN over fuzzy logic. The insignificant values of error showed that both the models have good extrapolation capabilities. The strength of concrete was analyzed by Yeh (2006) using neural networks and design of experiments (DOE). The effect on the late and early compressive strength when fly ash is used as cement replacement in the range of 0–50% was studied. Water to cementitious material ratio was also varied in the range of 0.3–0.7. The effect of each parameter on the compressive strength was studied. The data collected from DOE were used to develop a high correlation between the compressive strength and component properties. Metaheuristic optimized least squares support vector regres-sion (LSSVR) was used by Pham et al. (2015) to predict the compressive strength of high performance concrete. Least squares support vector regression is an advanced artificial intelligence method that can be effectively used for nonlinear modeling. Using ANN and SVM as bench marks the perfor-mance of the model was verified. The model perforperfor-mance was measured using RMSE and mean absolute percentage error (MAPE). LSSVR achieved the lowest MAPE and RMSE followed by SVM and ANN. The fracture characteristics of high strength and ultra high strength concrete were modeled using support vector regression (SVR) by Yuvaraj et al. (2013). Using coefficient of determination (r2) the accuracy of the model was determined. The value of r2for all the outputs were found to be closer to 1 indicating that the model has good
prediction capability. Yan and Shi (2010) predicted the elastic modulus of normal and high strength concrete by SVM. A comparison was done between SVM and other methods including ANN, fuzzy logic, regression, equations of ACI 363 code etc. The MAPE of the model were 3.13 and 8.42% for high and normal strength concrete in training while it was 3.75 and 9.69% for test data which is better compared to the other models. Other works in the area of modeling of hardened properties of mortar and concrete like compressive strength, flexural strength and torsional strength using different soft computing methods are also reported (Yeh1998; Lee2003; Tang2006; Hossain et al.2006; Tang et al.2007; Pala et al. 2007; Topcu and Saridemir2008; Altun et al.2008; Prasad et al.2009; Khatibinia et al.2016).
Mohebbi et al. (2011) proposed an ANN model on the effect chemical and mineral admixtures on the flow properties of self consolidating cement paste based on 200 training data. The 14 input parameters were the water binder ratio, 4 type mineral admixture quantity, 5 different superplasticizer quantity and 4 viscosity modifying admixture quantity. Mini slump spread diameter and flow cone time were the output parameters. The developed model could predict the optimum quantity of admixtures which have strong influence on the rheological properties of the cement paste. Modeling of the fresh stage properties of concrete using ANN and other soft computing methods are also reported in other studies (Yeh 2007,2008a,2008b; Ghafari et al.2015).
segregation along with compressive strength were modeled using ANN. The feed forward back propagation algorithm was adopted in the study. The model developed had good predictive capability. Few more studies are reported related to modeling of fresh and hardened stage properties of SCC (Pathak et al. 2012; Raheman and Modani 2013; Douma et al.2014; Malagavelli and Manalel2014).
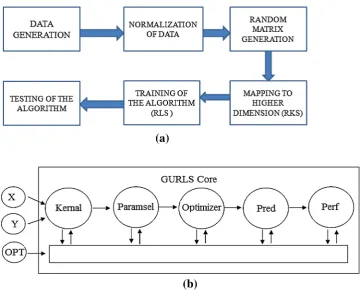
Nair et al. (2015) did a spread sheet implementation for classification of data using random kitchen sink algorithm (RKS). Experiments were performed on linear and non-lin-ear data sets using RKS and regularized least square esti-mation techniques. Classification has been done in an efficient manner by inheriting concepts from linear algebra and optimization theory. Data was mapped into a higher dimension using RKS and weight matrix for optimizing the data generated using regularized least square (RLS). The accuracy levels attained were 100% in case of linear data and 98% for nonlinear data. Preliminary studies have been made to predict the passing ability of the SCC mix using RKS by Prakash et al. (2016).
3. Approach to Modeling and Prediction
3.1 Random Kitchen Sink Algorithm (RKS) Random kitchen sink algorithm is used for mapping nonlinearly separated data sets. It is suitable for classifying very large data sets and follows a non linear kernel method. In machine learning many methods like SVM, neural net-works, fuzzy logic and gaussian mixture model based clas-sifiers are popular out of which SVM is the most popular. Its working is based on the principle of finding a hyper plane that gives the maximum margin between the classes of the given data sets. It is not suitable for large data sets as the kernel matrix is of higher order resulting in large processing time. This problem was overcome by Rahimi and Recht (2007) by using random feature mapping. The storage space and processing time requirement is independent of the number of data points. An explicit feature mapping is done /ð Þx corresponding to radial basis function kernel (RBF). The kernel function is symmetric and a real gaussian func-tion. The kernel function is taken as the inner product of the mapping functions.
k p;ð qÞ ¼\/ð Þp ;/ð Þq [ ð1Þ
Where k (p, q) is a positive definite function and/ðpÞ,/ðqÞ are the mapping functions.
/ðpÞ ¼ 1ffiffiffi L p
ejptX
1
ejptX
2
ejptX
3
: : : :
ejptXL
2 6 6 6 6 6 6 6 6 6 6 4 3 7 7 7 7 7 7 7 7 7 7 5
and/ðqÞ ¼ 1ffiffiffi
L p
ejptX
1
ejptX
2
ejptX
3
: : : :
ejptXL
2 6 6 6 6 6 6 6 6 6 6 4 3 7 7 7 7 7 7 7 7 7 7 5
ð2Þ
To avoid complex calculations the equations can be con-verted into their sine and cosine functions.
3.2 Regularised Least Square Algorithm (RLS) Regularized least square algorithm is used for classifica-tion of data. It trains a classifier and obtains accuracies which determine the efficiencies with which different data sets are classified. It is mainly used in the case of over determined systems. Regularization is a technique used to capture the real trend of data by use of functions and avoids over fitting. Nair et al. (2015) studied the use of regularized least square algorithm for multi class learning. If data set containl class of objects, the total number of features isx and total number of objects isy. The data matrix is of size yx and matrix A is of size yl which holds the label vectors. Matrix B of size xl map x tupil data vectors corresponding to label vector.fðBÞis the objective function.
B ¼argmin
Vyx
jjAYBjj22þkjjBjj22 ð3Þ
f Bð Þ ¼ jjAYBjj22þkjjBjj22 ð4Þ
fðBÞ ¼TrðATAþBTYTYBATYBÞ Tr B TYTA
þTrkBTB ð5Þ
of Bð Þ
oB ¼0)B
¼
YTYþkI
1
YTA ð6Þ
The application of regularized least square algorithm and random kitchen sink algorithm comes together in a tool bar in MATLAB called GURLS (Grand Unified Regularized Least Square). It is a tool bar developed for supervised learning based on regularized least square algorithm. The tool box provides a set of basic functionalities which includes various training strategies and routines to handle computations with very large matrices by means of both memory mapped storage and distributed task execution. It consists of a set of tasks each belonging to a predefined category and a method called GURLScore, implemented through the GURLS routine that is responsible for processing the task pipe line.
4. Experimental Details
The data sets used for training and testing was obtained experimentally. SCC was tested for its rheological and hardened stage properties. The rheological properties of SCC like flowability, passing ability and segregation resis-tance were tested. For hardened properties SCC was tested for its compressive strength. As the mixing process affect the properties of the concrete, the mixing sequence and time of mixing were kept the same throughout the preparation of the training and testing data. The materials were mixed using a tilting drum mixer. Initially dry mixing of the materials (cement, fine aggregate and coarse aggregate) was done for 3 min and then 70% of the mixing water is added to the mixer and mixing is done for 2 min. Superplasticizer along with remaining (30%) water is added after that and mixed for 2 min.
The materials which were used for the preparation of the SCC mix were flyash based portland pozzolana cement (PPC), coarse aggregate (CA), fine aggregate (FA), super-plasticizer (SP) and water. The cement used was tested for its consistency, specific gravity, fineness and compressive strength according to IS 4031 (Part 1-2005a, Part 11-2005b, Part 4-2005c, Part 6-2005d). The obtained values are 37%, 2.9, 2.95 and 35 N/mm2respectively which were compared with the specifications given in IS 1489 (2005) and it sat-isfied the requirements.
Preliminary test were done on both coarse aggregate (maximum size of 12.5 mm) and fine aggregate according to IS 2386 (Part I-2002a, Part III-2002b). The aggregate were tested for their specific gravity, water absorption, bulk
density and fineness modulus. The values were compared with IS 383 (2002) and it satisfied the requirements. The results are given in Table1.
The superplasticizers used were from four different fami-lies. They are Sulphonated Naphthalene Formaldehyde-SNF (SP1), Lignosulphates-LS (SP2), Polycarboxylic Ether-PCE (SP3) and Sulphonated Melamine Formaldehyde-SMF (SP4). Superplasticizers were tested for their densities and solid content according to IS 9103 (2004). The test results are given in Table2. Based on the solid content and density of the superplasticizer the necessary water correction was done on the mix for specific superplasticizer dosage. As the incompatibility between cement and superplasticizer can lead to excessive bleeding, segregation and other undesirable properties (excessive setting time, air entrainment), it is essential to check the compatibility between the two before using it in SCC mixes. In this work the compatible combi-nation approach based on saturation dosage of superplasti-cizer (Sathyan et al.2016) were used. Mini slump and Marsh cone tests were performed on the superplasticized cement paste mix to find the saturation dosages. Bleeding and seg-regation were observed in some SCC mixes (especially with PCE superplasticizer) when the superplasticizer dosage is considerably on the higher side of saturation dosage (but within the manufacturers recommendation). Such mixes were eliminated and superplasticizer quantity was kept in a range close to saturation dosage.
The trials were performed by varying the quantity of fine aggregate, coarse aggregate, type of superplasticizer and its dosage. Fresh stage properties (flowability, filling ability and segregation resistance) of the mixes were checked and only
those mixes which satisfied all requirements were taken for modeling.
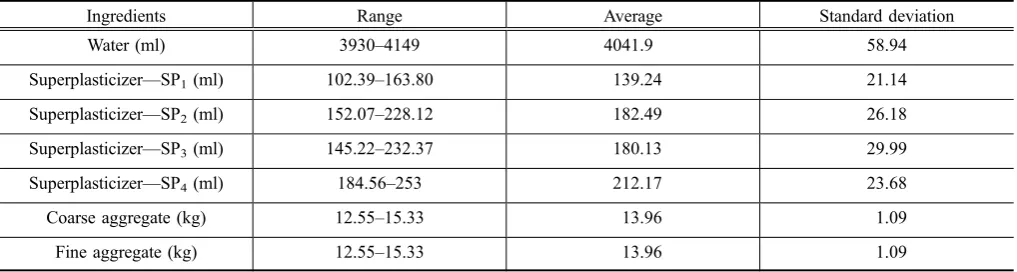
The fine aggregate to total aggregate percentages was varied as 45, 50 and 55. This range was selected based on bulk density tests i.e., the range yielding higher bulk density with lesser voids. The ranges of ingredients used in SCC mixes are given in Table3. As the water cement ratio is maintained constant for all the mixes, there is no change in the quantity of cement used.
SCC was tested for both its fresh and hardened properties. The flowability of the SCC mix was found out by doing slump flow test according to UNI 11041 (2003) and the spread diameter of the concrete was measured. The passing ability of the SCC mix was found out by doing J ring test according to UNI 11045 (2003) specification. The height of concrete just inside and outside J ring bars was measured and their difference was taken. To find the segregation resistance of the SCC mix V funnel test was carried out according to UNI 11042 (2003). The time required for emptying the funnel after 5 min (T5) was noted. The results obtained from all the three tests were compared with the specifications given in UNI 11040 (2003). A mix which satisfies all the three rheological characteristics was accepted as a SCC mix. For finding out the hardened properties, SCC was tested for its compressive strength. For finding the
compressive strength of concrete, cubes were cast of dimension 10910910 cm and tested in accordance with IS 516 (2004). The experimental results obtained for slump flow, V funnel, J-ring and compressive strength was used for both training and testing of the model.
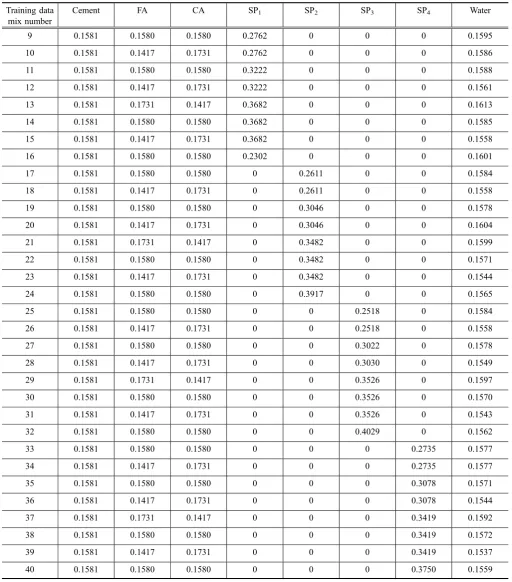
5. Database Preparation and Modeling
The accuracy of prediction of the rheological and hard-ened properties of SCC depends to a great extent on how accurate the training data is. If a larger data set is used, predictions will be more accurate as the model will be able to understand the correlation between the mixture components and the measured engineering properties. The training data consists of 32 data sets. The input parameters consist of weights of mixture ingredients like cement, coarse aggre-gate, fine aggreaggre-gate, four families of superplasticizer dosages and water. The input parameters have been chosen based on their effect on the mix. The respective sources of cement, coarse aggregate and fine aggregate used for all the mixtures were not varied and hence they were all treated as separate single input parameters. As superplasticizers were selected from four different families, their dosages were treated as four separate input parameters. This was necessary as the
Table 1 Aggregate properties.
Type Specific gravity Water absorption (%) Bulk density (kg/m3) Fineness modulus
CA 2.74 1.8 1535 7.46
FA 2.80 5 1320 3.64
Table 2 Superplasticizer properties.
No Superplasticizer designation Density (g/cc) Solid content (%) Saturation dosage (%)
1 SP1 1.23 37.4 0.6
2 SP2 1.17 31.6 0.6
3 SP3 1.09 36.7 0.5
4 SP4 1.23 33.1 1
Table 3 Ranges of ingredients of the SCC mixes.
Ingredients Range Average Standard deviation
Water (ml) 3930–4149 4041.9 58.94
Superplasticizer—SP1(ml) 102.39–163.80 139.24 21.14
Superplasticizer—SP2(ml) 152.07–228.12 182.49 26.18
Superplasticizer—SP3(ml) 145.22–232.37 180.13 29.99
Superplasticizer—SP4(ml) 184.56–253 212.17 23.68
Coarse aggregate (kg) 12.55–15.33 13.96 1.09
effect of different family superplasticizers on the mix char-acteristics were different for the same dosage. More input parameters can be given if we have a large database adopting varieties of materials. The output vector consists of the measured value of slump flow, J ring and V funnel of the SCC mix for fresh stage properties. For the prediction of hardened properties, the output vector consists of the mea-sured values of compressive strength. To measure the accuracy of model, 8 set of test data is used. All the input
and output parameters are normalized using norm method. The formulae is given by
ym¼
y1
jjyjj ð7Þ
jjyjj ¼ ffiffiffiffiffiffiffiffiffiffiffiffiffiffiffiffiffiffiffiffiffiffiffiffiffiffiffiffiffiffiffiffiffiffiffiffiffiffiffiffiffiffiffiffiffiffiffiffiffiffiffiffiffiffiffiffiy2 1þy22þy23þ. . .. . .. . .þy2n q
ð8Þ
Table 4 Normalised input variables of SCC mixtures used to train the algorithm.
Training data mix number
Cement FA CA SP1 SP2 SP3 SP4 Water
9 0.1581 0.1580 0.1580 0.2762 0 0 0 0.1595
10 0.1581 0.1417 0.1731 0.2762 0 0 0 0.1586
11 0.1581 0.1580 0.1580 0.3222 0 0 0 0.1588
12 0.1581 0.1417 0.1731 0.3222 0 0 0 0.1561
13 0.1581 0.1731 0.1417 0.3682 0 0 0 0.1613
14 0.1581 0.1580 0.1580 0.3682 0 0 0 0.1585
15 0.1581 0.1417 0.1731 0.3682 0 0 0 0.1558
16 0.1581 0.1580 0.1580 0.2302 0 0 0 0.1601
17 0.1581 0.1580 0.1580 0 0.2611 0 0 0.1584
18 0.1581 0.1417 0.1731 0 0.2611 0 0 0.1558
19 0.1581 0.1580 0.1580 0 0.3046 0 0 0.1578
20 0.1581 0.1417 0.1731 0 0.3046 0 0 0.1604
21 0.1581 0.1731 0.1417 0 0.3482 0 0 0.1599
22 0.1581 0.1580 0.1580 0 0.3482 0 0 0.1571
23 0.1581 0.1417 0.1731 0 0.3482 0 0 0.1544
24 0.1581 0.1580 0.1580 0 0.3917 0 0 0.1565
25 0.1581 0.1580 0.1580 0 0 0.2518 0 0.1584
26 0.1581 0.1417 0.1731 0 0 0.2518 0 0.1558
27 0.1581 0.1580 0.1580 0 0 0.3022 0 0.1578
28 0.1581 0.1417 0.1731 0 0 0.3030 0 0.1549
29 0.1581 0.1731 0.1417 0 0 0.3526 0 0.1597
30 0.1581 0.1580 0.1580 0 0 0.3526 0 0.1570
31 0.1581 0.1417 0.1731 0 0 0.3526 0 0.1543
32 0.1581 0.1580 0.1580 0 0 0.4029 0 0.1562
33 0.1581 0.1580 0.1580 0 0 0 0.2735 0.1577
34 0.1581 0.1417 0.1731 0 0 0 0.2735 0.1577
35 0.1581 0.1580 0.1580 0 0 0 0.3078 0.1571
36 0.1581 0.1417 0.1731 0 0 0 0.3078 0.1544
37 0.1581 0.1731 0.1417 0 0 0 0.3419 0.1592
38 0.1581 0.1580 0.1580 0 0 0 0.3419 0.1572
39 0.1581 0.1417 0.1731 0 0 0 0.3419 0.1537
Hereymis the normalized value andy1 is the original value.
The values are normalized to one so they will be in the range from 0 to 1. The normalized value of training data is given in Table4.
6. Analysis and Discussion of Result
The success of the model depends on its ability to understand the correlation between the mixture components and the measured engineering properties. The accuracy of the model is determined by its ability to predict the prop-erties of SCC mixture which are familiar and unfamiliar to the model but similar to the mixes used in training. Predic-tion accuracy of the model for familiar and unfamiliar mixes was tested in this study. Accuracy of prediction for familiar mixes were checked using six sets of data selected randomly from training data (Table5). RMSE values of predicted slump flow, J-Ring, V-funnel and compressive strength of the familiar mixes are 0.012, 0.025, 0.023 and 0.025
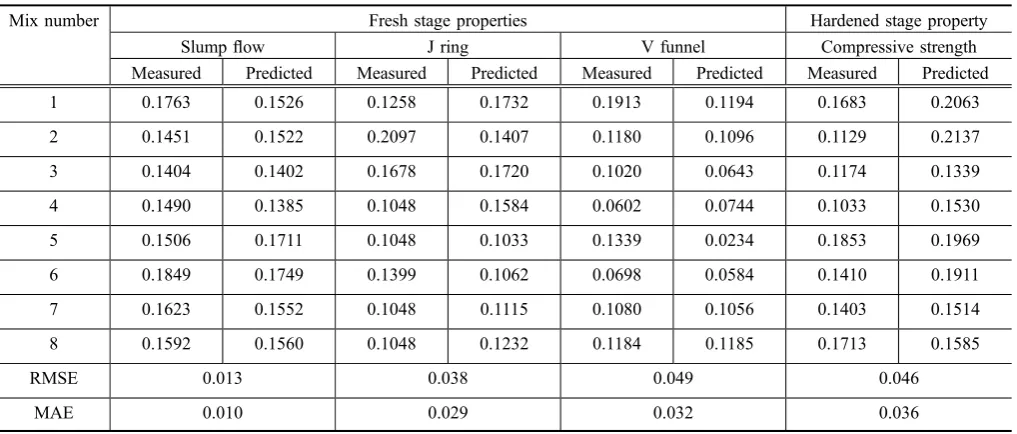
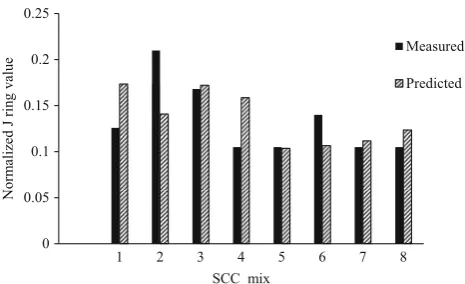
respectively and their mean absolute error (MAE) values are 0.009, 0.019, 0.017 and 0.021 respectively. For testing the prediction accuracy of the unfamiliar mixes, eight separate sets of data (not utilized for training) were used. Predicted and measured values of unfamiliar mixes are given in Table6. RMSE values of predicted slump flow, J-Ring, V-funnel and compressive strength of the unfamiliar mixes are 0.013, 0.038, 0.049 and 0.046 respectively and their MAE values are 0.010, 0.029, 0.032 and 0.036 respectively. Both RMSE and MAE values of the unfamiliar mixes are slightly higher than that of familiar mixes for all the pre-dicted properties. Graphical comparison of the prepre-dicted and measured value is shown in Figs.2,3,4,5.
The prediction accuracy of the model largely depends on number and nature of data available for training. With lim-ited amount of training data available (only 32) in this study, the accuracy of the model could be lower as it captures the influence of all mixture components on the SCC mix in a limited way within the experimental domain (as indicated earlier in Table3). However the preliminary study (Prakash
Table 5 Comparison of measured and predicted normalized values of familiar mixes.
Mix number Fresh stage properties Hardened stage property
Slump flow J ring V funnel Compressive strength
Measured Predicted Measured Predicted Measured Predicted Measured Predicted
10 0.1556 0.1522 0.2097 0.2077 0.1569 0.1753 0.1550 0.1574
18 0.1334 0.1347 0.2097 0.1983 0.1403 0.1437 0.1395 0.1293
26 0.1728 0.1678 0.1747 0.1527 0.1414 0.1502 0.1927 0.1582
27 0.1911 0.1771 0.1399 0.1370 0.0909 0.1109 0.1764 0.1674
33 0.1662 0.1534 0.1049 0.1482 0.1319 0.1812 0.1654 0.1328
37 0.1802 0.1601 0.1678 0.1338 0.1499 0.1514 0.1742 0.1369
RMSE 0.012 0.025 0.023 0.025
MAE 0.009 0.019 0.017 0.021
Table 6 Comparison of measured and predicted normalized values of unfamiliar mixes
Mix number Fresh stage properties Hardened stage property
Slump flow J ring V funnel Compressive strength
Measured Predicted Measured Predicted Measured Predicted Measured Predicted
1 0.1763 0.1526 0.1258 0.1732 0.1913 0.1194 0.1683 0.2063
2 0.1451 0.1522 0.2097 0.1407 0.1180 0.1096 0.1129 0.2137
3 0.1404 0.1402 0.1678 0.1720 0.1020 0.0643 0.1174 0.1339
4 0.1490 0.1385 0.1048 0.1584 0.0602 0.0744 0.1033 0.1530
5 0.1506 0.1711 0.1048 0.1033 0.1339 0.0234 0.1853 0.1969
6 0.1849 0.1749 0.1399 0.1062 0.0698 0.0584 0.1410 0.1911
7 0.1623 0.1552 0.1048 0.1115 0.1080 0.1056 0.1403 0.1514
8 0.1592 0.1560 0.1048 0.1232 0.1184 0.1185 0.1713 0.1585
RMSE 0.013 0.038 0.049 0.046
et al.2018) on comparison of prediction models with respect to split tensile strength showed marginally higher accuracy for RKS model over that of ANN model for the same experimental data set. Enhanced prediction accuracy of the RKS model is also established by comparing the mean absolute error in the predicted values obtained using the proposed RKS model with those of the ANN model (Nehdi et al. 2001), in which the average absolute value of the predicted filling capacity, slump value, segregation resis-tance and compressive strength were 0.05, 0.04, 0.07 and 0.07 respectively.
7. Summary and Conclusion
This study showed that the rheological and hardened properties of SCC can be predicted using regularized least square approach along with random kitchen sink algorithm. The RKS model was able to predict the rheological prop-erties (slump flow, passing ability and segregation resis-tance) and compressive strength of test mixes which were familiar and unfamiliar to the model. Mean absolute error and root mean square error of all predicted properties are less than 0.05. Thus the model is able to understand the rela-tionship amongst the ingredients, capture the effect of the
considered mixture variables and satisfactorily predict the fresh and hardened stage properties of SCC. There is potential to improve the model subsequently by incorporat-ing the effect of the change in site conditions, mixincorporat-ing methods, placing methods etc. in the training data. Such an improved model generated with an extensive data base will be useful for industries to limit the number of trials and thus minimize wastage of materials and labour.
Conflicts of interest
The authors declare that they have no conflicts of interest.
Open Access
This article is distributed under the terms of the Creative Commons Attribution 4.0 International License (http:// creativecommons.org/licenses/by/4.0/), which permits unre stricted use, distribution, and reproduction in any medium, 0
0.05 0.1 0.15 0.2
1 2 3 4 5 6 7 8
Normaliz
ed slump
flow
di
amet
er
SCC Mix
Measured
Predicted
Fig. 2 Measured-versus-predicted normalized values of
slump flow.
0 0.05 0.1 0.15 0.2 0.25
1 2 3 4 5 6 7 8
Norm
alized J
rin
g
v
alu
e
SCC mix
Measured
Predicted
Fig. 3 Measured-versus-predicted normalized values of J
ring.
0 0.05 0.1 0.15 0.2 0.25
1 2 3 4 5 6 7 8
No
rm
alized
V
fu
nnel tim
e
SCC mix
Measured
Predicted
Fig. 4 Measured-versus-predicted normalized values of V
funnel time.
0 0.05 0.1 0.15 0.2 0.25
1 2 3 4 5 6 7 8
Norm
alized com
p
res
siv
e
st
ren
g
th
SCC mix
Measured
Predicted
Fig. 5 Measured-versus-predicted normalized values of
provided you give appropriate credit to the original author(s) and the source, provide a link to the Creative Commons license, and indicate if changes were made.
References
Altun, F., Kisi, O., & Aydin, K. (2008). Prediction the com-pressive strength of steel fiber added lightweight concrete using neural network.Computational Material Science, 42, 259–265.
Belalia Douma, O., Boukhatem, B., & Ghrici, M. (2014). Pre-diction compressive strength of self-compacting concrete containing fly ash using fuzzy logic inference system. In-ternational Journal of Civil, Architectural, Structural and
Construction Engineering, 8(12), 1265–1269.
Chien, W.-H., Chen, L., Wei, C.-C., Hsu, H.-H., & Wang, T.-S. (2010). Modeling slump flow of high performance concrete using a back propagation network.Applied Mechanics and
Materials, 20–23, 838–842. https://doi.org/10.4028/www.
scientific.net/AMM.20-23.838.
Ghafari, E., Bandarabadi, M., Costa, H., & Ju´lio, E. (2015). Prediction of fresh and hardened state properties of UHPC: comparative study of statistical mixture design and an artificial neural network model. Journal of Materials in
Civil Engineering, 27(11), 1–11. https://doi.org/10.1061/
(ASCE)MT.1943-5533.0001270.
Hossain, K. M. A., Lachemi, M., & Easa, S. M. (2006). Arti-ficial neural network model for the strength prediction of fully restrained RC slabs subjected to membrane action.
Computers and Concrete, 3(6), 439–454.
IS 1489. (2005). Indian standard specification for portland
pozzolana cement, Part 1. New Delhi: Bureau of Indian
standards.
IS 2386. (2002a).Indian standard methods of test for aggregate
for concrete, particle size and shape, Part I. New Delhi:
Bureau of Indian Standards.
IS 2386. (2002b).Indian standard specification for methods of test for aggregates of concrete, specific gravity, density,
voids, absorption and bulking, Part III. New Delhi: Bureau
of Indian Standards.
IS 383. (2002).Indian standard specification for coarse and fine
aggregates from natural sources for concrete. New Delhi:
Bureau of Indian Standards.
IS 4031. (2005a). Indian standard specification for method of physical tests for hydraulic cement, determination of
fine-ness by dry sieving, Part 1. New Delhi: Bureau of Indian
standards.
IS 4031. (2005b).Indian standard specification for method of physical tests for hydraulic cement, determination of
den-sity, Part 11. New Delhi: Bureau of Indian standards.
IS 4031. (2005c). Indian standard specification for method of physical tests for hydraulic cement, determination of
con-sistency of standard cement paste, Part 4. New Delhi:
Bureau of Indian standards.
IS 4031. (2005d).Indian standard specification for method of physical tests for hydraulic cement, determination of
compressive strength of hydraulic cement other than
masonry cement, Part 6. New Delhi: Bureau of Indian
standards.
IS 516. (2004).Method of tests for strength of concrete. New Delhi: Bureau of Indian standards.
IS 9103. (2004). Indian standard specifications for concrete
admixtures. New Delhi: Bureau of Indian standards.
Khatibinia, M., Feizbakhsh, A., Mohseni, E., & Ranjbar, M. M. (2016). Modeling mechanical strength of self–compacting mortar containing nanoparticles using wavelet–based sup-port vector machine. Computers and Concrete, 18(6), 1065–1082.
Lee, S. (2003). Prediction of concrete strength using artificial neural networks.Engineering Structures, 25(7), 849–857. Malagavelli, V., & Manalel, P. A. (2014). Modeling of
com-pressive strength of admixture based self-compacting con-crete using fuzzy logic and artificial neural networks.Asian
Journal of Applied Science, 7(7), 536–551.
Mohebbi, A., Shekarchi, M., Mahoutian, M., & Mohebbi, S. (2011). Modeling the effects of additives on rheological properties of fresh self-consolidating cement paste using artificial neural network. Computers and Concrete, 8(3), 279–292.
Nagamoto, N. and Ozawa, K. (1999). Mixture properties of self-compacting, high-performance concrete. Third CANMET/ ACI International Conference on design and materials and
recent advances in concrete technology. Proceedings, V.
M. Malhotra, American Concrete Institute, Farmington
HillsSP-172, 623–637.
Nair Y. C., Binsha, P., Pradeep, V. V., Sowmya, V., Soman, K. P. (2015). Spreadsheet implementation of random kitchen sink for classification. IEEE Sponsored 2nd International Conference on innovations in information. Embedded and communication systems (ICIIECS).
Nehdi, M., El Chabib, H., & Hesham El Naggar, M. (2001). Predicting performance of self compacting concrete mix-tures using artificial neural networks.ACI Materials
Jour-nal, 98(5), 394–401.
Pala, M., Ozbay, E., Oztas, A., & Yuce, M. (2007). Appraisal of long-term effects of fly ash and silica fume on compressive strength of concrete by neural networks.Construction and
Building Materials, 21,384–394.
Pathak, S. S., Sharma, Sanjay, Sood, Hemant, & Khitoliya, R. K. (2012). Prediction of compressive strength of self compacting concrete with fly ash and rice husk ash using adaptive neuro-fuzzy inference system. International Journal of Advanced Computer Science and Applications, 3(10), 119–122.
Pham, A.-D., Hoang, N.-D., & Nguyen, Q.-T. (2015). Predict-ing compressive strength of high-performance concrete using metaheuristic-optimized least squares support vector regression. Journal of Computing in Civil Engineering. https://doi.org/10.1061/(asce)cp1943-5487.0000506. Prakash, A. J., Sathyan, D., Anand, K. B., Premjith, B. (2016).
Prediction of passing ability of self compacting concrete— regularized least square approach.Proceedings of Interna-tional conference on emerging and sustainable
Prasad, B., Eskandari, H., & Venkatarama, B. (2008). Prediction of compressive strength of SCC and HPC with high volume fly ash using ANN.Construction and Building Materials, 23(1), 117–128.
Raheman, A., & Modani, P. O. (2013). Prediction of properties of self compacting concrete using artificial neural network. International Journal of Engineering Research and
Appli-cations, 3(4), 333–339.
Rahimi, A. & Recht, B. (2007). Random features for large scale kernel machines. Advances in neural network processing
systems(pp. 1177–1184).
Prakash A. J., Sathyan, D., Anand, K. B., Aravind, N. R. (2018). Comparison of ANN and RKS approaches to model SCC strength.IOP Conf. Series: Materials Science
and Engineering 310. https://doi.org/10.1088/1757-899X/
310/1/012037
Sathyan, D., Anand, K. B., & Mini, K. M. (2016). Experimental study on portland pozzolana cement-superplasticiser com-patibility in mortar.International Journal of Earth Science
and Engineering, 9(2), 539–544.
Sonebi, M., Cevik, A., Grunewald, S., & Walraven, J. (2016a). Modelling the fresh stage properties of self-compacting concrete using support vector machine approach.
Con-struction and Building Materials, 106,55–64.
Sonebi, M., Grunewald, S., Cevik, A., & Walraven, J. (2016b). Modelling fresh properties of self-compacting concrete using neural network technique.Computers and Concrete, 18(4), 903–920.
Tang, C. (2006). Using radial basis function neural networks to model torsional strength of reinforced concrete beams.
Computers and Concrete, 3(5), 335–355.
Tang, C., Lin, Y., & Kuo, S. F. (2007). Investigation on corre-lation between pulse velocity and compressive strength of concrete using ANNs. Computers and Concrete, 4(6), 477–497.
Tayfur, G., Erdem, T. K., & Kırca, O. (2014). Strength pre-diction of high-strength concrete by fuzzy logic and artifi-cial neural networks. Journal of Materials in Civil
Engineering, 26(11), 04014079.
Topcu, I., & Saridemir, M. (2008). Prediction of compressive strength of concrete containing fly ash using artificial neural networks and fuzzy logic. Computational Material
Science, 41,305–311.
UNI 11040 (2003). Self compacting concrete, specification, characteristics and checking.Italian Standards.
UNI 11041 (2003). Testing fresh self compacting concrete, determination of free flow and time flow.Italian Standards. UNI 11042 (2003). Testing fresh self compacting concrete, determination of flow time in V-funnel.Italian Standards. UNI 11045 (2003). Testing fresh self compacting concrete, determination of confined flowability in J-ring. Italian Standards.
Yan, K., & Shi, C. (2010). Prediction of elastic modulus of normal and high strength concrete by support vector machine. Construction and Building Materials, 24, 1479–1485.
Yeh, I. C. (1998). Modeling of strength of high-performance concrete using artificial neural networks. Cement and
Concrete Research, 28(12), 1797–1808.
Yeh, I. C. (2006). Analysis of strength of concrete using design of experiments and neural networks.Journal of Materials
in Civil Engineering, 18,597–604.
Yeh, I. C. (2007). Modeling slump flow of concrete using second-order regressions and artificial neural networks.
Cement Concrete Composites, 29,474–480.
Yeh, I. C. (2008a). Modeling slump of concrete with fly ash and superplasticizer.Computers and Concrete, 5(6), 559–572. Yeh, I. C. (2008b). Prediction of workability of concrete using
design of experiments for mixtures. Computers and
Con-crete, 5(1), 1–20.
Yuvaraj, P., Ramachandra Murthy, A., Iyer, Nagesh R., Sekar, S. K., & Samuid, Pijush. (2013). Support vector regression based models to predict fracture characteristics of high strength and ultra high strength concrete beams.