DESIGN OF ARTIFICIAL NEURAL NETWORK
BASED DATA AGGREGATION IN CLUSTERED WSNS
Manomi K S
1, Vinutha C B
2, M Z Kurian
31,2,3
Department of ECE, SSIT, Tumkur, Karnataka (India)
ABSTRACT
In wireless sensor communication, energy resource of the battery is very crucial and it has to be used in
efficient manner. The battery for the wireless sensor network (WSN) cannot be recharged are replaced therefore
the network lifetime must be high. Artificial neural network based wireless sensor network increases the number
of live nodes in the network after data communication. Scalability is very important in the communication
networking. The clustering of the sensor nodes increases the scalability of the network. Expectation
maximization technique for cluster formation balances the node coverage and energy among the clusters. The
neural network for WSN detects the faulty sensor nodes and eliminates the faulty sensor nodes. This increases
the network throughput.
Keywords: Artificial Neural network (ANN), Cluster formation, Cluster head (CH), Data
aggregation, Expectation maximization technique, Wireless sensor network (WSNs),
I.
INTRODUCTION
In recent years wireless sensor network is finding its applications in various fields like agriculture, military, healthcare and environmental monitoring and industries. Wireless sensor network is made up of several sensor nodes. The sensor nodes are connected wirelessly using sensors and actuators. These nodes sense the data like temperature, pressure, sound etc and transfer the collected data to the base station. The base station communicates with the users through internet [1].
Clustering is the grouping of sensor nodes to form the clusters. Scalability is the ability of sensor network to handle the growing communication in the base station. Scalability is very important in the WSNs. The clustering of sensor nodes increases the scalability of wireless sensor network [2]. Expectation maximization technique for clustering is an iterative method to find the maximum likelihood among the sensor nodes. Then, form the cluster depending on the maximum similarities among the nodes. Expectation maximization technique is an iterative method hence it overcomes the problem of missing data. Also expectation maximization technique balances the communication among the sensor nodes in the clusters [3].
II.
RELATED
WORK
Vipin Pal, Giridhri Singh and R P Yadav have applied the balanced cluster by considering the threshold for cluster formation. They overcome the problem of uneven clusters. Result shows that the balanced clusters give the better network lifetime with reduction in the node death rate [5].
Ling-Yi SUN, Wei CAI and Xian-Xiang HUANG have applied LEACH method for clustering and three layer back propagation neural network for the data aggregation. In this proposed method the efficiency of data gathering is improved and the total energy consumption is reduced. So the node death rate is reduced [6]. Bhushan Jagyasi and Jabal Raval have proposed the data aggregation in multihop wireless mesh sensor neural network. They compared the results of proposed WSN with mesh sensor neural network topology and tree neural network topology. The results depicts a substantial gain in the detection of accuracy by the proposed neural network based data aggregation in wireless mesh sensor networks as compared to the other existing methods for tree and mesh topologies of the WSNs [7].
III.
PROPOSED
METHOD
3.1
Network initializationThe first step in the design of wireless sensor network is network initialization. Network initialization is the process of deploying the sensor nodes in the sensor field of specified area. The proper node deployment reduces the network cost, increases the degree of coverage and lifetime. Deploy the nodes randomly in the specified area. Some of the parameters to be considered for the node deployment are coverage, delay, degree, energy consumption and cost effectiveness [8]. During network initialization communication is established between the sensor nodes. The nodes first find their neighbors and link quality then, establish a network and choose an optimal path to the sink. After network initialization node localization is very important in random node deployment. Localization is the process of finding the relative or absolute position of the sensor nodes.
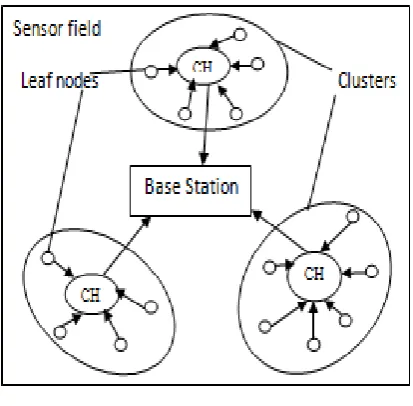
3.2
Cluster formationClustered wireless sensor network as shown in Fig.1. Cluster formation is the grouping of sensor nodes to form the clusters. Clustering increases the network scalability. In clustered wireless sensor network each cluster has cluster head and several leaf nodes. Cluster heads are energy resource rich nodes. Cluster heads consume more energy than leaf nodes. Leaf nodes communicate with the cluster head and then cluster head communicate with the base station [2].
Here Expectation maximization (EM) technique is proposed for cluster formation. Expectation maximization method is an iterative process of determining maximum likelihood distances among the nodes [9].
Fig. 1.
Cluster formation
Choose an initial parameter „θ‟ such as distance between nodes. Let„t‟ be the iterations.
E Step (Expectation Step):- Estimate the initial parameter „θ‟. „θ‟ is the distance between the nodes in the network. In this step it is essentially not appropriate to form the clusters in a definite manner. However it is a preliminary stage to compute only the expected parameters. During E step a function gt( θˆ(t) ) given by equation (1) is chosen such a manner which lower bounds the energy requirement with respective distance of communication.
gt( θˆ(t) )=logP(x;θ ˆ ( t) ) ……….……….(1)
In equation (1) „x‟ denotes the minimal energy associated for specific distance of communication.
M Step (Maximization Step):- In M step maximum likelihood estimation is calculated recursively in successive iterations. This step is repeated to re-estimate the maximum likelihood distance between nodes until the distance calculation remains same in successive iterations and this has its mathematical representation is given as,
logP(x;θ ˆ ( t) )=gt( θˆ (t) ) ≤ gt(θˆ(t+1)) =logP(x;θ ˆ(t+ 1 )) .………..(2)
Select the node which is having high energy and nearer to all leaf nodes as cluster head.
3.3
Data aggregation
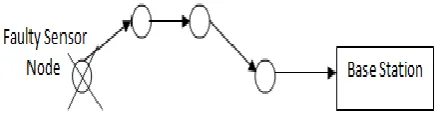
The faulty sensor node data to the CH is the main drawback of the existing system [11]. The existing system is a sensor network without neural network. The data transfer in the existing system is shown in Fig.2. Fault tolerance is the ability of the sensor network to provide the correct results when the sensor nodes fail. The ANN for sensor network eliminates the faulty sensor node that avoids the false information process.
Fig. 2.
WSN without artificial neural network
This paper presents an idea of the neural network for sensor network. The collected data from the sensors are input to the neural network. The neural network trains the sensed data and then output the neural network data. The neural network data are compared with the initial sensed data and the difference is computed as „α‟.
Artificial neural network data - Sensor data= α ………...… (3)
„α‟ is a real number represents the accuracy of data transmission . „α‟ must be greater than „β‟. Where, „β‟ is the threshold value representing the valid state of a node. If α < β, such nodes are considered as faulty node and those nodes are eliminated. Otherwise the sensor is defective and that sensor is removed. The defected sensor node elimination is shown in Fig.3. This prevents the energy consumption for the transfer of false data.
Fig. 3.
WSN with artificial neural network
This eliminates the failure of data transmission and aggregation using faulty nodes.
3.4
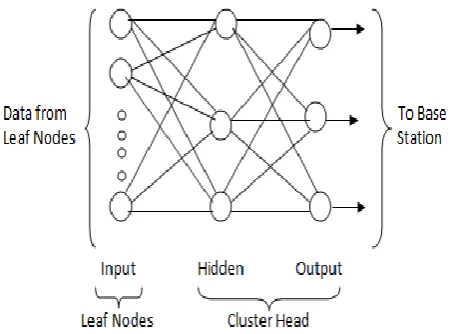
Back propagation neural network for data aggregation in clustered WSNs
In this paper back propagation neural network (BPNN) training is used for the data aggregation. Back propagation neural network for data aggregation is as shown in Fig.4. BPNN is a multi layer feed forward neural network [4]. The input layer is located in the leaf nodes and hidden and output layer is in the cluster head (CH).This neural network involves supervised learning [6]. Back propagation network have:
1. Input layer consists of the back propagation network inputs.
3. Output layer consists of back propagation network outputs and represents the final decision of training operation.
Fig. 4.
Data aggregation using back propagation neural network
.
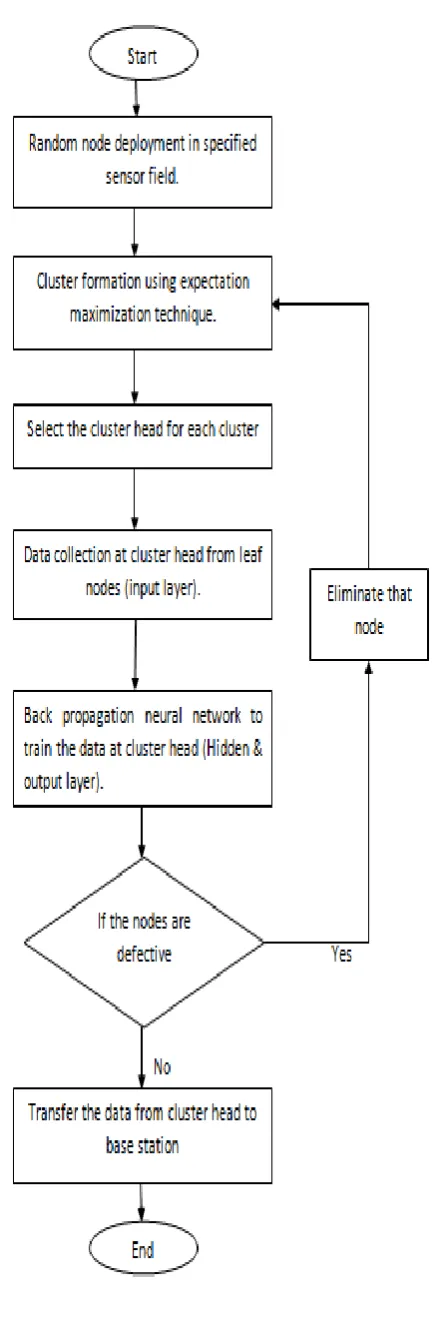
In a feed forward neural network the information flows from leaf nodes to cluster head. Every node processes the data in following manner. The flowchart for data aggregation using BPNN is as shown in Fig.5. First initialize the weights for all nodes. Leaf node data are the input to the neural network. Then transfer the data to the cluster head for training or processing [12].
The aggregated data Xj(n) of node Cj is given by
……….. (4) Where,
Cj = Cluster head
wj(n) =Associated weight of cluster head
yj(n) = Observation made by Cj
K = set of indices of all leaf nodes of node Cj.
wk(n) = Weights of leaf nodes
Yj(n)= output after applying sigmoid function to Xj(n)
The sigmoid function is defined as Y=1/(1+e-X) is used at intermediate nodes to get the binary decision. The decision Yj(n) of node Cj is given by,
The binary decision Yj(n) of each node is propagated to cluster head. The binary decision made by CH estimates the event hypothesis Hest(n)=YCH(n).
The error at the CH is the error between the actual desired output H(n) and estimated output Hest(n) is calculated as,
e(n)=H(n)-Hest(n) ……….……..(6)
The error ej(n) at the node Cj is given by,
ej(n)=e(n)wj(n)Yj(n)(1-Yj(n)) ….……….…. (7)
The gradient gradj is calculated to update the weight.
gradj(n)=αej(n)Xj(n)+µgradj(n-1) …...………..……. (8)
The value of step size α and acceleration factor µ are carefully selected to avoid algorithm divergence.
Finally the weights are updated as,
wj(n+1)=wj(n)+gradj(n) ………...……….(9)
Use the updated weights for the next training sequence to train the algorithm which uses forward and back propagation till the convergence reaches [13].
If the error is more, then the node is defective. Eliminate the faulty or defected node. When the leaf nodes fail or submit the faulty data, then reduce the nodes weight thereby resulting in the no impact of faulty data on aggregation. This reduces the energy consumption for the transfer of faulty data, thereby increases the network lifetime.
IV.
CONCLUSION
Wireless Sensor Network is finding its application in various fields and is becoming very popular. Data
communication in WSN should be supported by the limited resources of the nodes. Clustering of nodes in
wireless sensor networks increases the scalability of the network and energy conservation. Clustering using EM
technique reduces the data missing and it also balances the energy among each clusters. Data aggregation using
ANN technique increases the number of live nodes in the network and throughput by eliminating the defected
node. More efficient energy balancing technique should be devised to conserve nodes battery energy and result
with improved network lifetime.
REFERENCES
[1] I. Akylidiz, W. Su, Sankarasubramaniam, and E.Cayrici, “A survey on sensor networks”, IEEE Communications Magazine, Volume: 40 Issue: 8, August 2002, pp.102-114. Broadband and Wireless Networking Laboratory, School of Electrical and Computer Engineering, Georgia Institute of Technology, Atlanta, GA 30332, USA. Received 12 December 2001; accepted 20 December 2001.
[2] Ameer Ahmed Abbasi, Mohamed Younis “A survey on clustering algorithms for wireless sensor networks” Computer Communications 30 (2007) 2826–2841. 0140-3664/$ - see front matter _ 2007 Published by Elsevier B.V. doi:10.1016/j.comcom.2007.05.024.
[3] Fulufhelo V. Nelwamondo, Shakir Mohamed and Tshilidzi Marwala, “Missing Data: A Comparison of Neural Network and Expectation Maximisation Techniques”.
[4] Neda Enami, Reza Askari Moghadam, Kourosh Dadashtabar & Mojtaba Hoseini proposed “NEURAL NETWORK BASED ENERGY EFFICIENCY IN WIRELESS SENSOR NETWORKS: A SURVEY”. International Journal of Computer Science & Engineering Survey (IJCSES) Vol.1, No.1, August 2010. [5] Vipin Pal, Student Member, IEEE, Girdhari Singh, and R. P. Yadav, "Balanced Cluster Size Solution to
Extend Lifetime of Wireless Sensor Networks, IEEE INTERNET OF THINGS JOURNAL, VOL. 2, NO. 5, OCTOBER 2015
[6] Ling-Yi SuN, Wei CAI, Xian-Xiang HUANG “Data aggregation scheme using neural networks in wireless sensor networks”, 978-1-4244-5824-0/$26.00 _c 2010 IEEE
[7] Bhushan Jagyasi, Jabal Raval, “Data Aggregation in Multihop Wireless Mesh Sensor Neural Networks”, 2015 ninth international conference on sensing technology.
[8] Shruti Prabha Shaktawat ,O.P Sharma, “Node Deployment Models and their Performance Parameters for Wireless Sensor Network: A Perspective” International Journal of Computer Applications (0975 – 8887) Volume 88 – No.9, February 2014.
[9] Chuong B Do & Serafim Batzoglou, “What is the expectation maximization algorithm?”, Nature Publishing Group2008.
[11]Saeid Bahanfa, Helia Kousha 2
and Ladan Darougaran, “Neural networks for error detection and data aggregation in wireless sensor network”, IJCSI International Journal of Computer Science Issues, Vol. 8, Issue 5, No 3, September 2011
[12]Krishanamachari B., D. Krishanamachari B., D. Estrin and S. Estrin and S. Wicker "The Impact of Data Aggregation in Wireless Sensor Networks", Distributed Event Based Systems (DEBS), Vienna, Austria, Jul. 2002
[13]Bin Zhang, Guolong Chen, “A Prediction-Based Fault-Tolerant Aggregation Algorithm in Wireless Sensor Networks” 2013 International Conference on Cloud Computing and Big Data.
[14]Sang-Hyun Lee , Sang-Joon Lee , Kyung-Il Moon,“ Life-Environmental Sensor Data Aggregation Based on Neural Network”, Advanced Science and Technology Letters Vol.47, ISSN: 2287-1233 ASTL Copyright © 2014 SERSC.