Adiposity and Different Types of Screen Time
WHAT’S KNOWN ON THIS SUBJECT: Screen time has risen to unprecedented levels among youth. Greater television time is known to be associated with gains in pediatric adiposity, but few studies have examined the longitudinal relations of other forms of screen-based media with weight gain.
WHAT THIS STUDY ADDS:Among adolescents aged 9 to 19 years, television viewing was the type of screen time most consistently associated with gains in BMI. However, time with digital versatile discs/videos and video/computer games was also associated with gains in BMI among girls.
abstract
OBJECTIVE:Few prospective studies have examined separate forms of screen time in relation to adiposity. Our objective was to assess in-dependent relations of television, electronic games (video/computer), and digital versatile disc (DVD)/videos and total screen time with change in adolescent BMI.
METHODS:Using data from the 2004, 2006, and 2008 waves of the ongoing Growing up Today Study II, we assessed baseline and 2-year change in reported screen time in relation to concurrent change in BMI among 4287
girls and 3505 boys aged 9 to 16 years in 2004. Gender-specific models
adjusted for previous BMI, age, race/ethnicity, growth/development, months between questionnaires, and physical activity.
RESULTS: Among girls and boys, each hour per day increase in reported television viewing was associated with a 0.09 increase in
BMI (Ps,.001), and each hour per day increase in total screen time
was associated with a 0.07 increase among girls and 0.05 increase
among boys (Ps,.001). Among girls only, greater baseline television,
games, and total screen time and change in DVDs/videos were
associated with gains in BMI (Ps, .05). BMI gains associated with
change in television and total screen time were stronger among
overweight girls than lean girls (Ps-heterogeneity ,.001).
CONCLUSIONS:Television, which remains the steadiest source of food advertising, was most consistently associated with BMI gains. Among girls, electronic games and DVDs/videos were also related to increased
BMI, possibly due to influences of product placements and advergames
on diet and/or distracted eating. Adolescents, especially overweight
adolescents, may benefit from reduced time with multiple types of
media.Pediatrics2013;132:e1497–e1505
AUTHORS:Jennifer Falbe, ScD, MPH,a,bBernard Rosner, PhD,cWalter C. Willett, MD, DrPH,a,b,cKendrin R. Sonneville, ScD, RD,dFrank B. Hu, MD, PhD,a,b,cand Alison E. Field, ScDb,c,d
aDepartments of Nutrition andbEpidemiology, Harvard School of
Public Health, Boston, Massachusetts;cChanning Division of
Network Medicine, Department of Medicine, Brigham and Women’s Hospital and Harvard Medical School, Boston, Massachusetts; anddDivision of Adolescent Medicine, Boston
Children’s Hospital, Boston, Massachusetts
KEY WORDS
television, video games, sedentary lifestyle, BMI, body weight, adolescent, adiposity, longitudinal studies
ABBREVIATIONS CI—confidence interval DVD—digital versatile disc GUTSII—Growing Up Today Study II
Dr Falbe conceptualized and carried out the analysis, drafted the initial manuscript, and revised the manuscript; Drs Rosner, Willett, Sonneville, and Hu contributed to the concept, design, analysis, and interpretation, and reviewed and revised the manuscript; Dr Field contributed to the concept, design, analysis, and interpretation, supervised the analysis, and reviewed and revised the manuscript; and all authors approved thefinal manuscript as submitted.
Dr Falbe’s current affiliation is Division of Community Health and Human Development, University of California, Berkeley School of Public Health, Berkeley, California.
www.pediatrics.org/cgi/doi/10.1542/peds.2013-0887
doi:10.1542/peds.2013-0887
Accepted for publication Sep 23, 2013
Address correspondence to Jennifer Falbe, ScD, MPH, Division of Community Health and Human Development, University of California, Berkeley School of Public Health, 50 University Hall #7360, Berkeley, CA 94720. E-mail: jfalbe@berkeley.edu
PEDIATRICS (ISSN Numbers: Print, 0031-4005; Online, 1098-4275).
Screen time occupies a prominent
place in children’s environments. In
2009, youth aged 8 to 18 years were
exposed to an average of.7 hours per
day of television (TV), digital versatile discs (DVDs)/videos, video games, and computers: an increase from 2004 of
almost 1.5 hours per day.1 Excessive
screen time has been linked to poor health outcomes, including childhood
obesity and unhealthy weight gain.2
Longitudinal studies of screen time and weight have focused on TV or a com-posite of screen time including TV, which in most studies was associated
with increased adiposity.3,4 Moreover,
in clinical trials, children randomized to reduced TV experienced healthier
changes in weight.5–7 Although TV
continues to account for most screen time among youth, the proportion of time composed of broadcast TV has declined, while time with other media
has risen.1How these other media
af-fect adiposity is uncertain,4as there is
a dearth of prospective studies
exam-ining how video games,8–13
DVDs/vid-eos,13,14or computers15independently
relate to weight gain among youth. TV is hypothesized to increase adiposity through exposure to marketing for
unhealthy foods/beverages,16–18
lead-ing to overconsumption and positive
energy balance.19–23In contrast,
elec-tronic games and DVDs/videos are usually commercial-free, but compa-nies are spending increasing amounts of money on product placements in
these media.24,25
The aims of this study were to examine
independent associations between
separate forms of screen time (ie, TV, video/computer games, and DVDs/ videos) and changes in adolescent BMI, and to determine if these relations differ by weight status. We assessed these aims by using 3 assessments (2004, 2006, and 2008) among partic-ipants in the Growing Up Today Study (GUTS) II who were aged 9 to 16 years in
2004 and aged 11 to 19 years in 2006. Additionally, we were interested in ex-amining associations for youth aged 12 to
17 independently, as the Children’s Food
and Beverage Advertising Initiative, an agreement among food/beverage com-panies to self-regulate child-directed
ad-vertising, applies only to children ,12
years of age.26
METHODS
The ongoing GUTSII cohort was estab-lished in 2004 to assess relations of diet and activity to height velocity and weight gain. To recruit participants, inves-tigators sent letters explaining the study
to 20 700 mothers from the Nurses’
Health Study II27who had children aged
9 to 15 years. Invitation letters and questionnaires were mailed to 8826 girls and 8454 boys whose mothers had granted consent. A total of 6002 girls and 4917 boys returned completed questionnaires, thereby assenting to participate. Follow-up questionnaires were sent in the fall of 2006 and 2008.
Approximately 80% of the girls (n =
4779) and 79% of the boys (n= 3863)
returned the 2006 questionnaire, and
68% of girls (n= 4098) and 61% of boys
(n= 3014) returned the 2008
question-naire. Participants with complete data
on screen time and BMI on $2
con-secutive questionnaires were eligible for analysis. The study was approved by the Human Subjects Committee at
Brigham and Women’s Hospital, and the
analyses presented in this article were approved by the institutional review
boards at Brigham and Women’s
Hos-pital and Children’s Hospital Boston.
Outcome
The outcome was 2-year change (D) in
adiposity, modeled as DBMI, adjusted
for age and time between question-naires. For longitudinal studies of child
and adolescent adiposity, DBMI is
recommended over DBMI z-score.27,28
BMIz-scores are obtained from Centers
for Disease Control and Prevention standards derived from cross-sectional data, so they contain no information on how adiposity typically changes as
chil-dren grow.28 Further, Dz-score
repre-sents a broad range of adiposity changes for children measured at the same 2 ages, reducing power in
longi-tudinal assessments.28 BMI was
calcu-lated from self-reported height and weight, which has been validated among
preadolescents and adolescents.29–31
Additionally, Field and colleagues32
found only small discrepancies between
Dweight based on self-report and
Dweight based on measurements in Add
Health. Discrepancies were unrelated to attempts to lose weight, physical activity, or screen time, suggesting that
report-ing errors were random.32Each
partici-pant contributed up to 2 outcomes:
DBMI from 2004 to 2006 and/or DBMI
from 2006 to 2008. In stratified analyses,
participants were dichotomized as
overweight (overweight/obese) or lean (not overweight/obese) based on
In-ternational Obesity Task Force cutoffs.33
We excluded participants with BMI,12
(the biological lower limit based on
clinical opinion); 2-year Dheight #2
inches; or outlying values for BMI,
DBMI, orDheight detected through the
generalized extreme Studentized
de-viate many-outlier procedure.34
Exposures
Exposures were self-reported hours per day of TV, electronic games (video/
computer), DVDs/videos, and total
assessing media among youth;
Gort-maker and colleagues5reported a
cor-relation of r = 0.54 for TV and videos
compared with interview-administered 24-hour recall, and Schmitz and
col-leagues35 reported correlations of r =
0.47 andr= 0.39 for TV and computers
compared with 7-day log.
To reduce influence of extreme screen
times, we excluded outliers detected by the extreme Studentized deviate pro-cedure and implausibly high values (ie,
.8 hours per day of TV,.7 hours per
day of games, or.120 hours per week
of total screen time).
Covariates
Hours per week of moderate-to-vigorous
recreational physical activity ($3
met-abolic equivalents) were assessed by asking participants to recall by season the amount of time per week over the past year in 18 activities. A compendium was used to classify activities as
moderate-to-vigorous.36Median changes
were used to impute missing physical activity. Outliers were reassigned to the most extreme nonoutlying values, and
remaining values.40 hours per week
were reassigned to 40 hours per week;
n= 48 girls and 68 boys.
We determined Tanner stage of pubertal development through a validated scale
of pubic hair illustrations.37There are 5
Tanner stages, with stage 1 indicating prepubescence and stage 5 indicating maturity. Menarcheal status was as-sessed by asking if and when periods had begun. We also considered census tract median income and frequency of family dinners as confounders.
Sample
We excluded 4 girls and 1 boy with#12
months between questionnaires; 95 girls and 89 boys with outlying or
im-plausible BMI,DBMI, orDheight; and 37
girls and 42 boys with outlying screen time. After exclusions, the analytic sample included 4387 girls and 3505
boys with complete data on BMI and
reported screen time from$2
consec-utive questionnaires.
Statistical Analysis
Gender-specific multivariate linear
re-gression models were used to examine relationships between reported screen
time and DBMI. We used SAS Proc
Mixed (SAS Institute, Inc, Cary, NC) with an unstructured covariance matrix to account for nonindependence of mul-tiple outcomes per subject.
We examined relations of baseline
screen time and 2-year Dscreen time
with concurrent 2-year DBMI in the
same model (eg, TV time in 2006 and
DTV time from 2006 to 2008 in relation
to DBMI from 2006 to 2008). Models
examining separate forms of media included TV, electronic games, and DVD/videos simultaneously.
All models adjusted for age, age2, race/
ethnicity (Hispanic, black, Asian, and/or other versus non-Hispanic white), time between questionnaires, and baseline BMI in each period. To account for
nor-mal DBMI that occurs during
adoles-cence, we adjusted for Tanner stage,
Dheight, and menarcheal status (for
girls) in all models. Indicators were used for missing race/ethnicity, menarcheal status, and Tanner stage. Final models additionally adjusted for baseline and
Dphysical activity (hours per week).
Census tract median income and fre-quency of family dinners were also considered. However, in multivariate models, there was no evidence to
sug-gest they confounded the screen time–D
BMI relationship and were therefore not
retained. F-tests were used to detect
differences in screen time coefficients.
To confirm that linear terms for screen
time and physical activity were appro-priate, we examined possibly nonlinear relationships using restricted cubic
splines.38 Tests for nonlinearity used
likelihood ratio tests, comparing models
with only the linear term to models with the linear and cubic spline terms. To determine if associations were similar among those aged 12 to 17 years (80% of observations) compared with observations from the entire sample, aged 9 to 19 years, we repeated the analysis, restricting to ages 12 to 17. To examine heterogeneity by weight, we
stratified models by weight status, and
by using the entire sample, we included an indicator for overweight and a cross-product of this term with screen time. To determine if the relationships
be-tween Dtotal screen time and DBMI
were symmetrical for screen time decreases and increases, we examined
symmetry by graphing predicted
means ofDBMI from models including
restricted cubic spline terms for
Dtotal screen time. Analyses were
conducted with SAS (versions 9.1–9.2;
SAS Institute, Inc).
RESULTS
The mean age of observations at the
start of each period (2004–2006 and
2006–2008) was 14.4 years for girls
(range: 9.6–19.8) and 14.1 years for
boys (range: 9.2–19.9). Table 1
sum-marizes subject characteristics in 2006 and change values for 2006 to 2008. Most participants (93%) were
non-Hispanic white, reflecting the
compo-sition of the Nurses’ Health Study II.
Boys spent more time physically active and playing electronic games than girls. In 2006, 17% of girls and 24% of boys were overweight or obese, and
medianDBMI from 2006 to 2008 was
0.89 for girls and 1.37 for boys. Table 2 presents results from
re-gression models relating reported
screen time to DBMI. Tests for
non-linearity (Ps$.05) suggested that
and total screen time were associated
with gains in BMI (Ps , .05). Among
girls, the association with DBMI was
significantly stronger (P , .001) for
baseline electronic games (b = 0.18)
than it was for baseline TV (b= 0.06).
Among boys, baseline screen time was
not significantly associated withDBMI.
Among girls and boys, 2-year changes in TVand total screen time were associated
with greater 2-yearDBMI (Table 2). In
fully adjusted models, among girls, for each hour per day increase in TV, there
was a 0.09 increase in BMI (95% confi
-dence interval [CI] 0.04–0.13), and for
each hour per day increase in DVDs/ videos, there was a 0.09 increase in
BMI (95% CI 0.01–0.16). Change in total
screen time also predicted gains in BMI
among girls (0.07; 95% CI 0.04–0.11).
Overweight girls experienced signifi
-cantly greater gains in BMI than lean girls per hour per day increase in TV and total screen time (Ps-heterogeneity
,.001). Among boys, each hour per day
increase in TV was associated with
a 0.09 increase in BMI (95% CI 0.04–
0.14), and each hour per day increase in total screen time was associated with
a 0.05 increase in BMI (95% CI 0.03–
0.08). These associations were stronger among overweight boys, but differences
by weight status were nonsignificant for
ΔTV (P-heterogeneity = .10) and
bor-derline significant for Δtotal screen
time (P-heterogeneity = .08).
Among boys aged 12 to 17 (79% of male
observations), coefficients for DTV and
Dtotal screen time (not shown) were at
least as strong as those among all boys
(Ps, .01). Among girls aged 12 to 17
(81% of female observations),
coef-ficients for baseline TV and DDVDs/
videos (not shown) were nonsignificant,
but associations withDBMI persisted for
each hour per day of baseline games (0.19), baseline total screen time (0.05),
DTV (0.08), andDtotal screen time (0.07)
(Ps,.01).
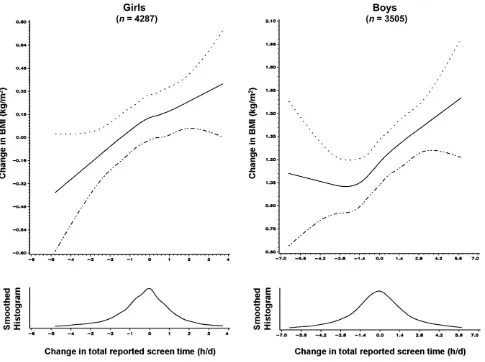
Whether screen time increased or de-creased, BMI changed symmetrically
for girls (Fig 1). For boys, DBMI was
flatter when Dtotal screen time was
negative but increased in response to
positive Dtotal screen time (Fig 1);
however, the test for nonlinearity was
nonsignificant (P$.05).
DISCUSSION
Among 7792 adolescents throughout the United States, we found that higher baseline reported screen time, partic-ularly TV and electronic games, was associated with greater 2-year gains in BMI among girls. Additionally, in-creasing hours per day of DVDs/videos among girls and increasing hours per day of TV and total screen time among girls and boys were associated with 2-year increases in BMI. Overall, the TABLE 1 Self-Reported Characteristics in 2006 and 2-Year Change (D) Values From 2006 to 2008a
for Growing Up Today Study II Participants
Girls (n= 4287) Boys (n= 3505)
Age 11–14 y (n= 1502) Age 15–19 y (n= 2785) Age 11–14 y (n= 1382) Age 15–19 y (n= 2123)
50th (10th, 90th) %tile % 50th (10th, 90th) %tile % 50th (10th, 90th) %tile % 50th (10th, 90th) %tile %
BMI 19.8 (16.5, 24.9) 21.3 (18.5, 25.9) 19.6 (16.7, 25.8) 21.8 (18.7, 27.3) 2-yDBMI 1.21 (–0.89, 3.28) 0.76 (–0.94, 2.62) 1.69 (–0.63, 3.90) 1.14 (–0.73, 3.16)
Obeseb 3.5 3.8 6.2 5.8
Overweight or obeseb 17.8 16.3 23.6 24.2
TV, h/d 0.93 (0.5 0, 3.07) 0.93 (0.07, 2.36) 0.93 (0.50, 3.07) 0.93 (0.50, 3.07) 2-yDTV, h/d 0.00 (–1.43, 0.71) 0.00 (–1.43, 0.86) 0.00 (–1.43, 1.43) 0.00 (–1.43, 0.86) Electronic games, h/d 0.07 (0.07, 0.93) 0.07 (0.07, 0.50) 0.93 (0.07, 2.36) 0.93 (0.07, 2.36) 2-yDelectronic games, h/d 0.00 (–0.43, 0.43) 0.00 (0.00, 0.43) 0.00 (–1.43, 1.43) 0.00 (–1.00, 1.43) DVDs/videos, h/d 0.5 (0.07, 0.93) 0.93 (0.07, 0.93) 0.50 (0.07, 1.21) 0.93 (0.07, 1.64) 2-yDDVDs/videos, h/d 0.00 (–0.43, 0.71) 0.00 (–0.71, 0.86) 0.00 (–0.86, 0.86) 0.00 (–0.71, 0.86) Totalc
screen time, h/d 1.93 (1.07, 4.21) 1.93 (1.07, 4.07) 2.93 (1.50, 6.36) 2.79 (1.07, 5.93) 2-yDtotalc
screen, h/d 0.00 (–1.86, 1.43) 0.00 (–1.57, 1.43) 0.00 (–2.57, 2.71) 0.00 (–2.14, 2.57) Physical activity,d
h/wk 7.8 (2.5, 18.3) 8.6 (1.5, 19.7) 9.4 (3.0, 22.3) 10.9 (2.06, 24.3) 2-yDphysical activity,d
h/wk 0.38 (–7.19, 8.13) 21.00 (–9.19, 5.88) 0.3 (–8.3, 10.3) 20.9 (–11.5, 7.9)
Height, in. 63 (59, 67) 65 (62, 68) 65 (59, 70) 70 (66, 74)
2-yDheight, in. 1 (0, 4) 0 (–1, 1) 5 (2, 8) 1 (0, 3)
Census tract median income, $1000e
67 (43, 102) 65 (43, 101) 68 (45, 104) 66 (43, 104)
Non-Hispanic whitef 93.2 93.9 92.3 93.0
Tanner stage 4 or 5f,g 70.8 96.8 55.7 97.2
aValues measured in 2008 minus values measured in 2006 (3078 girls and 2285 boys). bBased on cutoffs defined by the International Obesity Task Force.
cDoes not include computer/Internet use for homework, work, or other recreational use (except for computer games, which is encompassed by electronic games). dModerate-to-vigorous recreational physical activity ($3 metabolic equivalents).
eDetermined from mother’s home address.
magnitudes of associations were mod-est, but if exposure to screens increases or persists with time, cumulative effects on BMI would be clinically important. Also, it is likely that magnitudes of associations were substantially under-estimated because of random errors in exposure assessment.
Our findings regarding TV and total
screen time are concordant with results from other prospective studies and
interventions.3,4,7,13,39 As observed in
previous longitudinal studies,3we found
that the associations between screen
time and DBMI were independent of
physical activity, suggesting that screen
time affects diet. The influence of TV
food marketing on dietary intake and preference has been documented in
experiments,23,40,41 and is a likely
mechanism behind the TV-adiposity link. Food marketing may also be re-sponsible for the association we
detec-ted between DDVDs/videos and DBMI
among girls, because movies and TV shows on DVD/video may contain prod-uct placements. For instance, 69% of
1996 to 2005 box office movie hits
contained $1 food/beverage product
placement.42Very few studies have
ex-amined DVDs/videos separately from TV.
One found thatDvideos predictedDBMI
among boys,13and another study, which
combined DVDs/videos with other
“noncommercial” screen media, found
no significant association with BMI z
score.14
Ourfinding that use of electronic games
was related to ΔBMI among girls is
consistent with a longitudinal study in which girls who played video games daily had 2.5 times the odds of being in
the highest decile for DBMI.9 Other
longitudinal studies have not found an association between electronic games
and adiposity,10,12,13 except for one in
which frequent gaming was associated with a lower risk of overweight among Asian boys but a higher risk among
Asian girls.11Because the associations
we observed were independent of FIGURE 1
physical activity, electronic games may have induced excess energy intake. This mechanism is consistent with a study in
which each hour per day Dvideo/
computer games was associated with a 92 kcal per day increase in intake
among sixth to seventh graders.20
Sim-ilarly, in a trial among adolescent boys, ad libitum energy intake after video game play was greater compared with sitting at rest and was not compensated
for later in the day.43Exposure to food
marketing through “advergames”
(games developed to advertise a prod-uct) or product placement within games
may partially explain influences on
in-take. In a recent trial, children playing advergames containing food cues con-sumed more energy during a sub-sequent snack than children playing
advergames with nonfood products.44
Gaming has also been associated with
cardiovascular risk factors,45–47possibly
mediated by diet.
We observed particularly strong asso-ciations between some types of media
and DBMI among overweight youth,
who may be especially responsive to food advertising. A recent functional MRI study demonstrated that when exposed to food logos, obese children showed less brain activation in regions associated with cognitive control than
did healthy weight children.48 Some
behavioral studies also support this hypothesis. For instance, overweight children consumed more calories from branded meals than nonbranded meals, but nonoverweight children did
not,49 and when children were
ran-domized to food ads or nonfood ads, obese children exhibited the largest
intake in response to food ads.50Taken
together, results suggest that limiting screen media containing food market-ing should be included in obesity pre-vention and treatment interpre-ventions. Among 12- to 17-year-olds, we observed associations similar to those among all ages, supporting recommendations of
the Federal Interagency Working Group on Food Marketed to Children that
in-dustry make “significant
improve-ments in the nutritional quality of foods
marketed to…ages 2-17 years.”51The
current scope of the Children’s Food
and Beverage Advertising Initiative is
children ,12 years old.26Our results
imply that older youth are not resistant to food marketing.
Among media we assessed, TV was most
consistently associated with DBMI
across subgroups. Similarly, a recent study reported that higher proportions of primary attention to TV, but not other media, were associated with higher
adolescent BMI,52 perhaps reflecting
that the largest proportion of food-marketing expenditures is still
dedi-cated to TV.53Additionally, simultaneous
eating may be easier while watching TV
than while gaming, as one’s hands
would be free of a controller/keyboard/ mouse. However, it is possible to eat while gaming, as not all electronic games require constant interaction, and games can be paused.
In addition to exposing viewers to mar-keting, screens provide a distraction that may promote unconscious overeating. Experiments have shown that watching TV while eating can result in higher
in-take in current54,55 and subsequent
eating occasions56 and may affect
memory of consumption56 and
appe-tite.21Playing computer games during
lunch has also been observed to reduce feelings of fullness and induce greater
intake after lunch.57 Future studies
should determine relative contributions of distraction and marketing on con-current eating, but 1 experiment in which children watching TV with food ads ate more while viewing than those watching nonfood ads suggests an
ad-ditional marketing effect.23
This study has several limitations. GUTSII includes few children of color and low socioeconomic status and a smaller proportion of overweight/
obese youth than the national
aver-age,58 potentially limiting its
generaliz-ability. Second, data were self-reported; however, errors were likely random, as errors in weight change based on self-report have been found to be unrelated
to physical activity or screen time.32
Third, we did not assess active video games, but data were collected before their widespread use. Last, we did not measure media content or
simulta-neous use of multiple media.59Strengths
of this study include its longitudinal de-sign with repeated measurements, large sample, and assessment of multiple screen-based media.
The omnipresence of screens in
child-ren’s lives necessitates identifying ways
to reduce screen exposure and its obe-sogenicity. A recent review of inter-ventions to reduce TV found that the most effective interventions used elec-tronic monitors, contingent feedback
systems, and clinic-based counseling.60
Effective interventions also recruited overweight/obese children, suggesting
that screen time is modifiable in this
population. Future studies should iden-tify strategies for reducing electronic gaming, an effort complicated by access to games via consoles, laptops, phones, and other hand-held devices. Last, to make screens less obesogenic, improve-ments to child-directed advertising are
recommended.51 Regulatory efforts,
ei-ther industry or government-initiated, should be evaluated for adherence and health impact.
CONCLUSIONS
This is among the few longitudinal studies to examine how different types of screen time independently relate to
Δadiposity. TV, which remains the
steadiest medium for delivering food advertising, was most consistently
as-sociated withΔBMI across subgroups.
current American Academy of Pediat-rics recommendations to limit
child-ren’s total noneducational screen
time.61 Limits may be particularly
beneficial for overweight youth and
should be integrated into clinic-based counseling. As the marketing landscape
further evolves, exposing children to increased food marketing through Web sites, advergames, social net-working, and product placements, researchers should continue to
mon-itor how specific media and marketing
techniques affect adiposity and identify
effective strategies for reducing expo-sure to harmful marketing.
ACKNOWLEDGMENTS
The authors thank the thousands of young people across the country partici-pating in GUTSII as well as their mothers.
REFERENCES
1. Rideout VJ, Foehr UG, Roberts DF.Generation
M2: Media in the Lives of 8- to 18-Year-Olds.
Menlo Park, CA: Kaiser Family Foundation; 2010
2. Strasburger VC, Jordan AB, Donnerstein E. Health effects of media on children and adolescents. Pediatrics. 2010;125(4):756– 767
3. Tremblay MS, LeBlanc AG, Kho ME, et al. Systematic review of sedentary behaviour and health indicators in school-aged chil-dren and youth.Int J Behav Nutr Phys Act. 2011;8:98
4. Rey-López JP, Vicente-Rodríguez G, Biosca M, Moreno LA. Sedentary behaviour and obesity development in children and ado-lescents.Nutr Metab Cardiovasc Dis. 2008; 18(3):242–251
5. Gortmaker SL, Peterson K, Wiecha J, et al. Reducing obesity via a school-based in-terdisciplinary intervention among youth: Planet Health. Arch Pediatr Adolesc Med. 1999;153(4):409–418
6. Epstein LH, Roemmich JN, Robinson JL, et al. A randomized trial of the effects of reducing television viewing and computer use on body mass index in young children.
Arch Pediatr Adolesc Med. 2008;162(3):
239–245
7. Robinson TN. Reducing children’s television viewing to prevent obesity: a randomized controlled trial. JAMA. 1999;282(16):1561– 1567
8. Lajunen HR, Keski-Rahkonen A, Pulkkinen L, Rose RJ, Rissanen A, Kaprio J. Leisure ac-tivity patterns and their associations with overweight: a prospective study among adolescents. J Adolesc. 2009;32(5):1089– 1103
9. O’Loughlin J, Gray-Donald K, Paradis G, Meshefedjian G. One- and two-year pre-dictors of excess weight gain among ele-mentary schoolchildren in multiethnic, low-income, inner-city neighborhoods.Am
J Epidemiol. 2000;152(8):739–746
10. Janz KF, Burns TL, Levy SM; Iowa Bone De-velopment Study. Tracking of activity and
sedentary behaviors in childhood: the Iowa Bone Development Study.Am J Prev Med. 2005;29(3):171–178
11. Gordon-Larsen P, Adair LS, Popkin BM. Eth-nic differences in physical activity and in-activity patterns and overweight status.
Obes Res. 2002;10(3):141–149
12. Hesketh K, Carlin J, Wake M, Crawford D. Predictors of body mass index change in Australian primary school children. Int J
Pediatr Obes. 2009;4(1):45–53
13. Berkey CS, Rockett HR, Gillman MW, Colditz GA. One-year changes in activity and in in-activity among 10- to 15-year-old boys and girls: relationship to change in body mass index.Pediatrics. 2003;111(4 pt 1):836–843 14. Zimmerman FJ, Bell JF. Associations of tele-vision content type and obesity in children.
Am J Public Health. 2010;100(2):334–340
15. Berkey CS, Rockett HR, Colditz GA. Weight gain in older adolescent females: the In-ternet, sleep, coffee, and alcohol.J Pediatr. 2008;153(5):635–639, 639.e1
16. Bell RA, Cassady D, Culp J, Alcalay R. Fre-quency and types of foods advertised on Saturday morning and weekday afternoon English- and Spanish-language American television programs. J Nutr Educ Behav. 2009;41(6):406–413
17. Harris JL, Weinberg ME, Schwartz MB, Ross C, Ostroff J, Brownell KD. Trends in televi-sion food advertising progress in reducing unhealthy marketing to young people? 2010. Available at: www.yaleruddcenter.org/ resources/upload/docs/what/reports/Rud-dReport_TVFoodAdvertising_2.10.pdf. Accessed January 24, 2012
18. Batada A, Seitz MD, Wootan MG, Story M. Nine out of 10 food advertisements shown during Saturday morning children’s televi-sion programming are for foods high in fat, sodium, or added sugars, or low in nutrients. J Am Diet Assoc. 2008;108(4): 673–678
19. Swinburn B, Shelly A. Effects of TV time and other sedentary pursuits.Int J Obes (Lond). 2008;32(suppl 7):S132–S136
20. Sonneville KR, Gortmaker SL. Total energy intake, adolescent discretionary behaviors and the energy gap.Int J Obes (Lond). 2008; 32(suppl 6):S19–S27
21. Blass EM, Anderson DR, Kirkorian HL, Pempek TA, Price I, Koleini MF. On the road to obesity: television viewing increases in-take of high-density foods. Physiol Behav. 2006;88(4-5):597–604
22. Miller SA, Taveras EM, Rifas-Shiman SL, Gillman MW. Association between television viewing and poor diet quality in young children.Int J Pediatr Obes. 2008;3(3):168– 176
23. Harris JL, Bargh JA, Brownell KD. Priming effects of television food advertising on eating behavior.Health Psychol. 2009;28(4): 404–413
24. Montgomery KC, Grier S, Chester J, Dorfman L. Food marketing in the digital age: a concep-tual framework and agenda for research. April 1, 2011. Available at: http://digitalads.org/ documents/Digital_Food_Mktg_Conceptual_ Model%20Report.pdf. Accessed January 19, 2013
25. PQMedia. Global product placement spend-ing up 10% to $7.4 billion in 2011, pacspend-ing for 11% growth in 2012, as wireless technology, changing consumer habits & looser regu-lations compel brands to invest in alterna-tive marketing solutions. December 4, 2012. Available at: www.pqmedia.com/about-press-201212.html. Accessed February 8, 2013 26. Kolish ED. The Children’s Food & Beverage
Advertising Initiative white paper on CFBAI’s uniform nutrition criteria. July 2011. Avail-able at: www.bbb.org/us/storage/0/Shared %20Documents/White%20Paper%20on% 20CFBAI%20Uniform%20Nutrition%20Crite-ria%20July%202011.pdf. Accessed January 8, 2012
27. Rich-Edwards JW, Goldman MB, Willett WC, et al. Adolescent body mass index and in-fertility caused by ovulatory disorder.Am J
Obstet Gynecol. 1994;171(1):171–177
than change in BMI z score for longitudinal studies.Ann Epidemiol. 2007;17(1):44–50 29. Strauss RS. Comparison of measured and
self-reported weight and height in a cross-sectional sample of young adolescents.Int J
Obes Relat Metab Disord. 1999;23(8):904–908
30. Shannon B, Smiciklas-Wright H, Wang MQ. Inaccuracies in self-reported weights and heights of a sample of sixth-grade children.
J Am Diet Assoc. 1991;91(6):675–678
31. Goodman E, Hinden BR, Khandelwal S. Ac-curacy of teen and parental reports of obesity and body mass index. Pediatrics. 2000;106(1 pt 1):52–58
32. Field AE, Aneja P, Rosner B. The validity of self-reported weight change among ado-lescents and young adults.Obesity (Silver
Spring). 2007;15(9):2357–2364
33. Cole TJ, Bellizzi MC, Flegal KM, Dietz WH. Establishing a standard definition for child overweight and obesity worldwide: in-ternational survey. BMJ. 2000;320(7244): 1240–1243
34. Rosner B. Percentage points for a general-ized ESD many-outlier procedure.
Techno-metrics. 1983;25(2):165–172
35. Schmitz KH, Harnack L, Fulton JE, et al. Reliability and validity of a brief question-naire to assess television viewing and computer use by middle school children.J
Sch Health. 2004;74(9):370–377
36. Ainsworth BE, Haskell WL, Whitt MC, et al. Compendium of physical activities: an up-date of activity codes and MET intensities.
Med Sci Sports Exerc. 2000;32(suppl 9):
S498–S504
37. Morris NM, Udry JR. Validation of a self-administered instrument to assess stage of adolescent development. J Youth Ado-lesc. 1980;9(3):271–280
38. Durrleman S, Simon R. Flexible regression models with cubic splines.Stat Med. 1989;8 (5):551–561
39. Berkey CS, Rockett HR, Field AE, et al. Ac-tivity, dietary intake, and weight changes in a longitudinal study of preadolescent and adolescent boys and girls.Pediatrics. 2000; 105(4). Available at: www.pediatrics.org/ cgi/content/full/105/4/e56
40. Halford JC, Boyland EJ, Hughes G, Oliveira LP, Dovey TM. Beyond-brand effect of television (TV) food advertisements/commercials on
caloric intake and food choice of 5-7-year-old children.Appetite. 2007;49(1):263–267 41. Borzekowski DL, Robinson TN. The 30-second
effect: an experiment revealing the impact of television commercials on food preferences of preschoolers.J Am Diet Assoc. 2001;101 (1):42–46
42. Sutherland LA, Mackenzie T, Purvis LA, Dalton M. Prevalence of food and beverage brands in movies: 1996-2005. Pediatrics. 2010;125(3):468–474
43. Chaput JP, Visby T, Nyby S, et al. Video game playing increases food intake in adoles-cents: a randomized crossover study.Am J
Clin Nutr. 2011;93(6):1196–1203
44. Folkvord F, Anschütz DJ, Buijzen M, Valkenburg PM. The effect of playing advergames that promote energy-dense snacks or fruit on actual food intake among children.Am J Clin Nutr. 2013;97(2):239–245
45. Martinez-Gómez D, Gomez-Martinez S, Ruiz JR, Ortega FB, Marcos A, Veiga OL. Video game playing time and cardiometabolic risk in adolescents: the AFINOS study.Med
Clin (Barc). 2012;139(7):290–292
46. Gopinath B, Baur LA, Hardy LL, et al. Re-lationship between a range of sedentary behaviours and blood pressure during early adolescence.J Hum Hypertens. 2012; 26(6):350–356
47. Goldfield GS, Kenny GP, Hadjiyannakis S, et al. Video game playing is independently associated with blood pressure and lipids in overweight and obese adolescents.PLoS ONE. 2011;6(11):e26643
48. Bruce AS, Lepping RJ, Bruce JM, et al. Brain responses to food logos in obese and healthy weight children.J Pediatr. 2013;162 (4):759–764.e2
49. Forman J, Halford JC, Summe H, MacDougall M, Keller KL. Food branding influences ad libitum intake differently in children depending on weight status. Results of a pilot study.Appetite. 2009;53(1):76–83 50. Halford JC, Boyland EJ, Hughes GM, Stacey L,
McKean S, Dovey TM. Beyond-brand effect of television food advertisements on food choice in children: the effects of weight
sta-tus.Public Health Nutr. 2008;11(9):897–904
51. Interagency Working Group on Food Marketed to Children. Preliminary proposed nutrition principles to guide industry
self-regulatory efforts: request for comments. April 2011. Available at: www.ftc.gov/os/ 2011/04/110428foodmarketproposedguide. pdf. Accessed November 8, 2012
52. Bickham DS, Blood EA, Walls CE, Shrier LA, Rich M. Characteristics of screen media use associated with higher BMI in young adolescents. Pediatrics. 2013;131(5):935– 941
53. Kovacic WE, Harbour PJ, Leibowitz J, Rosch
TJ. Marketing Food to Children and
Ado-lescents: A Review of Industry Expenditures, Activities, and Self-Regulation. A Report to
Congress. Washington, DC: Federal Trade
Commission; 2008
54. Bellissimo N, Pencharz PB, Thomas SG, Anderson GH. Effect of television viewing at mealtime on food intake after a glucose preload in boys. Pediatr Res. 2007;61(6): 745–749
55. Temple JL, Giacomelli AM, Kent KM, Roemmich JN, Epstein LH. Television watching increases motivated responding for food and energy intake in children.Am J Clin Nutr. 2007;85(2): 355–361
56. Higgs S, Woodward M. Television watching during lunch increases afternoon snack intake of young women. Appetite. 2009;52 (1):39–43
57. Oldham-Cooper RE, Hardman CA, Nicoll CE, Rogers PJ, Brunstrom JM. Playing a com-puter game during lunch affects fullness, memory for lunch, and later snack intake.
Am J Clin Nutr. 2011;93(2):308–313
58. Ogden CL, Carroll MD, Kit BK, Flegal KM. Prevalence of obesity and trends in body mass index among US children and ado-lescents, 1999-2010.JAMA. 2012;307(5):483– 490
59. Foehr UG. Media Multitasking Among American Youth: Prevalence, Predictors
and Pairings. Menlo Park, CA: Kaiser Family
Foundation; 2006
60. Schmidt ME, Haines J, O’Brien A, et al. Systematic review of effective strategies for reducing screen time among young children. Obesity (Silver Spring). 2012;20 (7):1338–1354
DOI: 10.1542/peds.2013-0887 originally published online November 25, 2013;
2013;132;e1497
Pediatrics
Hu and Alison E. Field
Jennifer Falbe, Bernard Rosner, Walter C. Willett, Kendrin R. Sonneville, Frank B.
Adiposity and Different Types of Screen Time
Services
Updated Information &
http://pediatrics.aappublications.org/content/132/6/e1497 including high resolution figures, can be found at:
References
http://pediatrics.aappublications.org/content/132/6/e1497#BIBL This article cites 51 articles, 12 of which you can access for free at:
Subspecialty Collections
http://www.aappublications.org/cgi/collection/obesity_new_sub Obesity
http://www.aappublications.org/cgi/collection/screen_time_sub Screen Time
http://www.aappublications.org/cgi/collection/media_sub Media
following collection(s):
This article, along with others on similar topics, appears in the
Permissions & Licensing
http://www.aappublications.org/site/misc/Permissions.xhtml in its entirety can be found online at:
Information about reproducing this article in parts (figures, tables) or
Reprints
DOI: 10.1542/peds.2013-0887 originally published online November 25, 2013;
2013;132;e1497
Pediatrics
Hu and Alison E. Field
http://pediatrics.aappublications.org/content/132/6/e1497
located on the World Wide Web at:
The online version of this article, along with updated information and services, is
by the American Academy of Pediatrics. All rights reserved. Print ISSN: 1073-0397.