http://www.sciencepublishinggroup.com/j/ijepp doi: 10.11648/j.ijepp.20190703.12
ISSN: 2330-7528 (Print); ISSN: 2330-7536 (Online)
Applications of Cluster Analysis Method in Surface Water
Quality Assessment: A Case Study in Balihe Lake, China
Jiazhu Lan, Meifang Zhong, Yixin Xu, Zhongyu Wang
*, Hai Huang
*Research Center for Engineering Ecology and Nonlinear Science, North China Electric Power University, Beijing, China
Email address:
*Corresponding author
To cite this article:
Jiazhu Lan, Meifang Zhong, Yixin Xu, Zhongyu Wang, Hai Huang. Applications of Cluster Analysis Method in Surface Water Quality Assessment: A Case Study in Balihe Lake, China. International Journal of Environmental Protection and Policy. Vol. 7, No. 3, 2019, pp. 93-98. doi: 10.11648/j.ijepp.20190703.12
Received: July 13, 2019; Accepted: August 6, 2019; Published: August 19, 2019
Abstract:
Analyses on the spatial evolution and distribution of surface water quality are important to the treatment and protection of water environment in a lake. In Balihe Lake, an inland freshwater lake in east China, 7 water environmental factors at 45 sampling sites were monitored and served as the basis of this study. Cluster analysis (CA), a multivariate statistical analysis method, was utilized to study the spatial variation and grouping of these sampling sites based on the monitored water quality data. The results of this study showed that the water quality characteristics at these 45 sampling sites, which was grouped into the clusters of upstream, midstream and downstream, highly depended on the spatial location of the lake. Some nutrients content of the upstream area was much higher, while the water quality of the downstream area was much better although some of water quality indicators at the outlet still didn’t match the standards of local government. The CA results of the study may provide some guidance to the priority areas of water environment protection or treatment for the government.Keywords:
Cluster Analysis, Surface Water Quality, Balihe Lake, Freshwater Lake1. Introduction
Since the beginning of the 21st century, China's agricultural water consumption has been showing a small downward trend [1-3]. According to the China water resources bulletin, China's total agricultural water use decreased from 378.62 billion m3 in 2000 to 374.35 billion m3 in 2011. The proportion of agricultural water use in the total water use decreased from 68.8% in 2000 to 61.3% in 2011, a decrease of 7.5%. However, the decrease of agricultural water usage did not lead to improvement of water environment due to the extensive use of fertilizers and pesticides. Then, large amounts of nitrogen and phosphorus ran into rivers and lakes by runoff, and caused serious eutrophication of water bodies, and further promoted the blooms of algae and the decrease of dissolved oxygen (DO). Normal air-water and mass transfer process was therefore affected, and caused massive death of fish and other organisms in aquatic ecosystems. These dead plants and animals continued to rot in water, thus brought a vicious
impact on water quality [4].
It has been widely recognized that effective, long-term management of rivers requires a fundamental understanding of hydro-morphological, chemical and biological characteristics. Therefore, it is necessary to perform a comprehensive water quality monitoring program and evaluate the water environment scientifically since that the spatial variation of water quality is often difficult to interpret [5-7].
In this study, CA method was utilized to cluster the spatial similarity of the water quality in a natural freshwater lake. Corresponding to the clusters induced by CA, the major pollutants were also analyzed. The application of CA, a multivariate statistical method, was therefore explored in the area of water quality evaluation.
2. Materials and Methods
2.1. Study Area
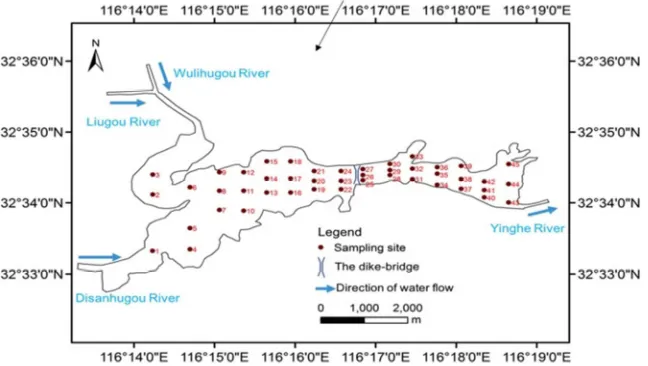
Fuyang city, Anhui province, China. The geographical coordinates of the Balihe Lake are 116.01°-116.38°N and 32.54°-32.57°E. Balihe Lake is Lake is a river-like lake with a narrow East-West structure. Its East-West length is about 15km on average. Totally, the Balihe Lake covers an area of 15.8 km2. In addition, the lake is divided into upstream and downstream by a dike-bridge which was constructed by the local government near the center of the east-west direction (Figure 1). As an agricultural watershed, the Balihe Lake is surrounded by farmland and villages [8].
The water quality safety in Balihe Lake has been seriously threatened by the agricultural non-point source pollution all the year round due to the highly intensive agricultural activities, livestock and poultry breeding industry, as well as the production and processing mode of sweet potato starch.
According to surveys, the contribution of rural sweet potato starch wastewater to COD (chemical oxygen demand) pollution load in Balihe Lake was 65%, while livestock breeding and domestic sewage were 18% and 15%, respectively. Livestock and poultry farming contributed the most to the NH4+-N (ammonia nitrogen) pollution load in the watershed, accounting for 67%, and starch wastewater contributed 20%. Livestock and poultry farming also contributed 45% and 44% to TN (total nitrogen) and phosphorus pollution in the watershed, while 25% and 8% came from farmland cultivation, and 25% and 8% from starch wastewater. In Balihe Lake, the highest content of COD and NH4+-N have ever reached 234.60 mg/L and 1.96 mg/L, respectively [8].
Figure 1. Location of Balihe Lake and the distribution of 45 sample sites.
2.2. Monitored Parameters and Analytical Methods
Water samples were collected at 45 sample sites in October 2017. Among them, sites 1-3 are near the inflow of the Balihe Lake, while sites 43-45 near the outflow. Sites 4-24 are evenly arranged in the upstream and sites 25-42 are distributed in the downstream part of the lake. The dike-bridge was determined as the interface between upstream sites and downstream sites (Figure 1).
Seven water quality indicators including COD, NH4+-N, TN, TP (total phosphorus), pH (potential of hydrogen) WT (water temperature) and Chl-a (chlorophyll a) were selected to monitor and evaluate the surface water quality of Balihe Lake. Among them, pH and WT were directly measured in situ using a multiparameter water quality monitoring instrument (YSI Pro Plus, USA). For the other monitored water quality indicators (COD, NH4+-N, TN, TP and Chl-a), water samples were collected 1m below the water surface and store in plastic bottles then complete the relevant analytical experiments in laboratory within 48 hours. E.g., COD was analyzed ex situ with fast digestion spectrophotometric method and Chl-a with spectrophotometric method. TN, NH4+-N and TP were measured with alkaline potassium persulfate digestion-UV spectrophotometric method, Nessler's reagent colorimetric method and ammonium
molybdate spectrophotometric method, respectively. And all the analytical methods following the Monitoring and Analysis Methods of Water and Wastewater (4th Edition) [9].
2.3. Statistical Analysis
Systematic cluster analysis is a process of distinguishing or classifying objects scientifically according to their similarity. Firstly, according to some groups of data, the statistics that can explain the similarity degree between these data groups can be found out. Then, based on these statistics, some variables with large similarity degree can be synthesized into one cluster, while the variables with small similarity degree will be synthesized together in another cluster. Finally, a complete taxonomic pedigree can be drawn according to the similarity between different types or groups. The similarity mentioned here is defined by the distance between two adjacent clusters. The principle of category merging is that different clusters have very large differences and the differences within one cluster are very small [10-13].
needed. Based on the selected classification statistics, calculations according to the indicated steps can be performed and a complete classification dendrograms can be finally obtained [14-17].
The basis of CA is the difference between data, that is, the calculation of distance. In the process of system clustering, the calculation methods of distance between classes can be divided into single connection method, complete connection method and average connection method. The Square Euclidean distance method is used in this research.
3. Results and Discussion
3.1. Status of Surface Water Quality of Balihe Lake
Through the analysis and parameter monitoring of the
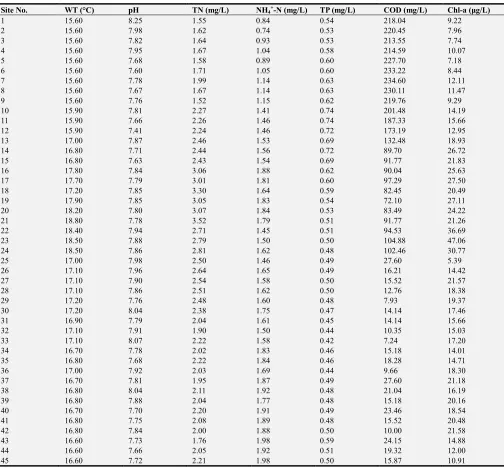
water samples collected from Balihe Lake in October 2017, the values of these seven water quality indicators at these 45 sampling sites can be obtained. These data are shown in Table 1.
According to the environmental quality standards for surface water in China (GB3838-2002) [18], grade V is the lowest level of surface water quality identified in the standard. The corresponding limit values of TN, NH4+-N, TP and COD are better than 2.0 mg/L, 2.0 mg/L, 0.4 mg/L and 40 mg/L, respectively. However, these four water quality parameters in the Balihe Lake are far beyond this standard range during the sampling period, which means that the water quality in Balihe Lake was still facing tremendous challenges.
Table 1. The water quality data of 7 indicators at 45 sample sites in Balihe Lake.
Site No. WT (°C) pH TN (mg/L) NH4+-N (mg/L) TP (mg/L) COD (mg/L) Chl-a (µg/L)
1 15.60 8.25 1.55 0.84 0.54 218.04 9.22
2 15.60 7.98 1.62 0.74 0.53 220.45 7.96
3 15.60 7.82 1.64 0.93 0.53 213.55 7.74
4 15.60 7.95 1.67 1.04 0.58 214.59 10.07
5 15.60 7.68 1.58 0.89 0.60 227.70 7.18
6 15.60 7.60 1.71 1.05 0.60 233.22 8.44
7 15.60 7.78 1.99 1.14 0.63 234.60 12.11
8 15.60 7.67 1.67 1.14 0.63 230.11 11.47
9 15.60 7.76 1.52 1.15 0.62 219.76 9.29
10 15.90 7.81 2.27 1.41 0.74 201.48 14.19
11 15.90 7.66 2.26 1.46 0.74 187.33 15.66
12 15.90 7.41 2.24 1.46 0.72 173.19 12.95
13 17.00 7.87 2.46 1.53 0.69 132.48 18.93
14 16.80 7.71 2.44 1.56 0.72 89.70 26.72
15 16.80 7.63 2.43 1.54 0.69 91.77 21.83
16 17.80 7.84 3.06 1.88 0.62 90.04 25.63
17 17.70 7.79 3.01 1.81 0.60 97.29 27.50
18 17.20 7.85 3.30 1.64 0.59 82.45 20.49
19 17.90 7.85 3.05 1.83 0.54 72.10 27.11
20 18.20 7.80 3.07 1.84 0.53 83.49 24.22
21 18.80 7.78 3.52 1.79 0.51 91.77 21.26
22 18.40 7.94 2.71 1.45 0.51 94.53 36.69
23 18.50 7.88 2.79 1.50 0.50 104.88 47.06
24 18.50 7.86 2.81 1.62 0.48 102.46 30.77
25 17.00 7.98 2.50 1.46 0.49 27.60 5.39
26 17.10 7.96 2.64 1.65 0.49 16.21 14.42
27 17.10 7.90 2.54 1.58 0.50 15.52 21.57
28 17.10 7.86 2.51 1.62 0.50 12.76 18.38
29 17.20 7.76 2.48 1.60 0.48 7.93 19.37
30 17.20 8.04 2.38 1.75 0.47 14.14 17.46
31 16.90 7.79 2.04 1.61 0.45 14.14 15.66
32 17.10 7.91 1.90 1.50 0.44 10.35 15.03
33 17.10 8.07 2.22 1.58 0.42 7.24 17.20
34 16.70 7.78 2.02 1.83 0.46 15.18 14.01
35 16.80 7.68 2.22 1.84 0.46 18.28 14.71
36 17.00 7.92 2.03 1.69 0.44 9.66 18.30
37 16.70 7.81 1.95 1.87 0.49 27.60 21.18
38 16.80 8.04 2.11 1.92 0.48 21.04 16.19
39 16.80 7.88 2.04 1.77 0.48 15.18 20.16
40 16.70 7.70 2.20 1.91 0.49 23.46 18.54
41 16.80 7.75 2.08 1.89 0.48 15.52 20.48
42 16.80 7.84 2.00 1.88 0.50 10.00 21.58
43 16.60 7.73 1.76 1.98 0.59 24.15 14.88
44 16.60 7.66 2.05 1.92 0.51 19.32 12.00
In the sampling period, the highest COD concentration in the lake is up to 234.60 mg/L, which was found at sites 7 within the upstream area. The declining of COD from upstream to downstream demonstrated that Balihe Lake had a certain self-purification function of water quality. The range of TN was from 1.52 mg/L (site 9) to 3.52 mg/L (site 21), while 0.74 mg/L (site 2) to 1.98 mg/L (site 43 and 45) for NH4+-N. The lowest TP value is 0.42 mg/L at site 33 and the maximum is 0.74 mg/L at site 10 and 11. Generally speaking, the highest nutrient content (e.g. TN and TP) appeared at the upstream sites, with the exception of the highest NH4+-N content, which appeared at downstream (site 43 and 45). The concentration of COD and TP decreased gradually with the direction of flow, showing an obvious spatial distribution law. Increased NH4+-N content at the outlet indicated that nitrifying bacteria are still active in the Balihe Lake.
3.2. Spatial Variations in Surface Water Quality
In this research, the method of cluster analysis was used to analyze these monitored parameters of 45 sample sites in the
Balihe Lake. Due to that the dimensions of these parameters are different; these parameters were standardized firstly.
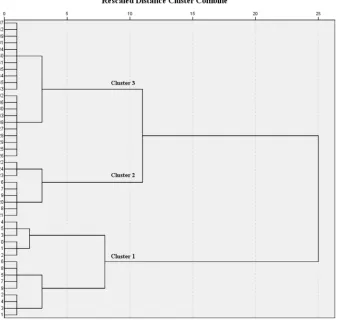
Z-score method was selected as the standardized method in the CA processes. And the distance index used in this study was Squared Euclidean Distance. Finally, as can be seen in Figure 2, the CA results showed that these 45 sampling sites were divided into three main clusters, which were named as cluster 1, cluster 2 and cluster 3, respectively. Sites within each cluster should have similar features and pollution source types. In the research of Sun et al., the sampling sites along the studied river was also categorized into four different clusters based on the CA results of water environmental factors [19]. Although the sits grouping based on CA results in this study were different to other studies like Sun et al.’s, it should be noticed that the sampling sites showed a reasonable consistency in their locations which meant the spatial distribution. In addition, these clusters determined by judging their water quality might be primarily influenced by the land use surrounding the studies area.
Figure 2. Cluster Analysis of Sample Sites Data in Bali Lake.
As can be seen in Figure 2, the clustering of 45 sites is entirely classified according to their spatial distribution in the lake. The sampling sites in cluster 1 are near the entrance area of the Balihe Lake, that is, the upstream area. The dividing line between cluster 1 and cluster 2 is the dike-bridge. The presence of dike-bridge made the water
flow in the lake shrink and the fluidity increase, which may further increase the aeration in water.
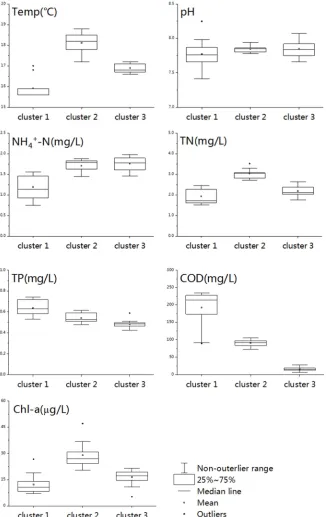
reached 192.53 mg/L. The average content of TP in cluster 1 was also the highest, which is up to 0.64 mg/L. In cluster 2, it can be clearly observed that the mean values of WT, TN and Chl-a reached the maximum values, which were 18.11°C, 3.04 mg/L and 28.97 µg/L. The possible reason for the higher TN for the sites in cluster 2 was the discharge of human domestic wastewater on both sides of the bridge. For cluster 3, the average concentration of TP and COD attained the minimum values, which were 0.48 mg/L and 16.25 mg/L, respectively. In addition, the other parameters were also relatively lower than those of cluster 1 and cluster 2 except for NH4+-N. Consistent with the preceding statement, the
maximum mean value of NH4+-N could be found in cluster 3, reaching 1.75 mg/L. All these supported the point mentioned above, which indicated that the sampling sites in each cluster have similar features and pollution types. Considering the self-purification function of the lake, the pollution source control in the upstream area should be emphasized for the water environmental protection, although the improvement of the structure and function of the lake ecosystem was also needed. However, more attention should be paid on the water pollution source identification, especially based on newer and more reasonable methods to make the water environmental protection work more targeted [20].
4. Conclusions
Based on 7 monitored water quality indicators at 45 sampling sites in Balihe Lake, the surface water quality in the lake was evaluated with CA method. From the CA results, it can be clearly concluded that the water quality of 45 sample sites in Balihe Lake was classified strictly according to their spatial distribution. Because of the agricultural pollution in the upstream, the water quality in the upstream area was the worst. Owing to there is a dike-bridge in the middle of the lake, the aeration of the lake water was increased and the water quality in the downstream was obviously improved. Although further research on the water quality evaluation in Balihe Lake are needed, the results of this study revealed that both pollution source control in upstream area and ecological restoration in the lake are necessary to promote the water quality reaching the fixed goal. The CA results of this study may provide some inspirations to the formulation and implementation water environmental protection and treatment policy for the local government.
Acknowledgements
This research was supported by the Chinese National Major Science and Technology Program for Water Pollution Control and Treatment (No. 2015ZX07204-007, No. 2017ZX07101-002, No.2015ZX07203-011) and the Chinese Fundamental Research Funds for the Central Universities (No. 2017MS055).
References
[1] B. G. Li and F. Huang (2010) Trends in China's Agricultural Water Use During Recent Decade Using the Green and Blue Water Approach. Advances in Water Science 21 (4), 575-583. (In Chinese)
[2] Y. C. Liu, J. M. Yuan and X. X. Jin (2014) Pollution Status and Prevention Measures of Agricultural Water in China [J]. Environmental Engineering 32 (4), 1-3+21. (In Chinese)
[3] J. F. Song, Y. N. Guo, P. T. Wu, et al. (2018) The Agricultural Water Rebound Effect in China. Ecological Economics 146, 497-506.
[4] H. J. Li and Z. W. Mu (2012) Causes and Control Measures of Water Environmental Pollution in Watershed. Environmental Pollution & Control 34 (3), 110-112. (In Chinese)
[5] W. Dixon and B. Chiswell (1996) Review of Aquatic Monitoring Program Design. Water Research 30 (9), 1935-1948.
[6] B. Zhang, X. F. Song, Y. H. Zhang, et al. (2012) Hydrochemical Characteristics and Water Quality Assessment of Surface Water and Groundwater in Songnen Plain, Northeast China. Water Research 46 (8), 2737-2748.
[7] Y. Anteneh, G. Zeleke and E. Gebremariam (2018)
Assessment of Surface Water Quality in Legedadie And Dire Catchments, Central Ethiopia, Using Multivariate Statistical Analysis. Acta Ecologica Sinica 38 (2), 81-95.
[8] M. F. Zhong, H. Y. Zhang, X. W. Sun, et al. (2018) Analyzing the Significant Environmental Factors on The Spatial and Temporal Distribution of Water Quality Utilizing Multivariate Statistical Techniques: A Case Study in The Balihe Lake, China. Environmental Science and Pollution Research 25, 29418–29432.
[9] Environmental Protection Administration of Peoples Republic of China (2009) Monitoring and Analysis Methods of Water and Wastewater (4th Edition). Beijing: China Environmental Science Press. (in Chinese)
[10] H. S. Xu, Z. X. Xu, W. Wu and F. F. Tang (2012) Assessment and Spatiotemporal Variation Analysis of Water Quality in The Zhangweinan River Basin, China. Procedia Environmental Sciences 13, 1641-1652.
[11] S. Alelyani, J. L. Tang and H. Liu (2018) “Feature Selection for Clustering: A Review,” in Data Clustering, C. C. Aggarwal and C. K. Reddy Eds. New York: Chapman and Hall/CRC.
[12] C. P. Yue, X. Li (2019) Study on Water Quality Factors in Wuliangsuhai Lake Based on Clustering Analysis. Yellow River 41 (5), 67-70+76. (In Chinese)
[13] J. Jia (2019) Quality Change and Control Measures of Water in Huangshui River Based on Multivariate Statistical Analysis Method. China Energy and Environmental Protection 41 (2), 107-110. (In Chinese)
[14] X. X. Li, H. Li and H. J. Song (2003) Analysis of Quality and Trend of Surface Water Resources in Xinjiang. Arid Land Geography, 26 (3), 254-259. (In Chinese)
[15] S. Shrestha, and F. Kazama (2007) Assessment of surface Water Quality Using Multivariate Statistical Techniques: A Case Study of The Fuji River Basin, Japan. Environmental Modelling & Software 22 (4), 464-475.
[16] W. Wang, Z. Y. Wang, X. J. Bai, et al. (2019) Spatial Distribution and Correlation Analyses of Water Quality of Different Types of Rivers in A Typical Northern City. Environmental Engineering (Online). (In Chinese)
[17] Z. Zhang, F. L. Tao, J. Du, et al. (2010) Surface Water Quality and Its Control in A River with Intensive Human Impacts-A Case Study of The Xiangjiang River, China. Journal of Environmental Management 91 (12), 2483-2490.
[18] Environmental Protection Administration of Peoples Republic of China. (2002) Surface Water Environmental Quality Standards (GB 3838-2002). (in Chinese)
[19] X. W. Sun, H. Y. Zhang, M. F. Zhong, et al. (2019) Analyses on the Temporal and Spatial Characteristics of Water Quality in a Seagoing River Using Multivariate Statistical Techniques: A Case Study in the Duliujian River, China. International Journal of Environmental Research and Public Health 16, 1020.