The effect of microbial activity on soil water diffusivity
B . U . C h o u d h u r ya,b, S . F e r r a r i sc, R . W . A s h t o na, D . S . P o w l s o na & W . R . W h a l l e ya
aDepartment of Sustainable Agricultural Sciences, Rothamsted Research, Harpenden AL5 2JQ, UK,bDivision of Natural Resource
Management, ICAR (RC) for NEH Region, Umiam, Ri-Bhoi, Meghalaya 793 103, India, andcPolitecnico and University of Torino, Interuniversity Department of Regional and Urban Studies and Planning, Viale Mattioli 39, Torino, Italy
Summary
In this study, we explored the effects of microbial activity on the evaporation of water from cores of a sandy soil under laboratory conditions. We applied treatments to stimulate microbial activity by adding different amounts of synthetic analogue root exudates. For comparison, we used soil samples without synthetic root exudates as control and samples treated with mercuric chloride to suppress microbial activity. Our results suggest that increasing microbial activity reduces the rate of evaporation from soil. Estimated diffusivities in soil with the largest amounts of added root exudates were one third of those estimated in samples where microbial activity was suppressed by adding mercuric chloride. We discuss the effect of our results with respect to water uptake by roots.
Highlights
• We explored effects of microbial activity on the evaporation of water from cores of a sandy soil.
• We found the effect of microbial activity on water release characteristic was small.
• Increasing microbial activity reduced evaporation from soil, while microbial suppression increased it.
• Effect of microbial activity on root water uptake was estimated to be equivalent to a change in soil structure.
Introduction
Microbial activity can greatly affect the structure and hydraulic properties of soil (e.g. Oret al., 2007; Colicaet al., 2014; Helliwell
et al., 2014). One of the explanations for these effects is related to the production of extracellular polymeric substances that alter soil structure at the pore scale (Or et al., 2007). Typically, a smaller hydraulic conductivity is reported and explained by the clogging of pores because of microbial activity. An important stimulus of micro-bial activity in soil is the carbon released from roots in the form of root exudates (Patersonet al., 2007). Root exudates can have immediate effects on the soil water release characteristics because of their surfactant properties (Readet al., 2003). In the longer term, incubation of soil with root exudates, either natural or synthetic, has been shown to reduce hydraulic conductivity in near-saturated soil (Hallettet al., 2003; Whalleyet al., 2004). The study of Colicaet al. (2014) showed that induced biological crusts could reduce the rate of evaporation from dry soil. They also found that the hydraulic conductivity of near-saturated soil depended on the molecular weight of carbohydrates added to soil; the hydraulic conductivity was less when higher-molecular-weight carbohydrates were added.
Correspondence: R. Whalley. E-mail: [email protected] Received 29 August 2017; revised version accepted 22 November 2017
The purpose of this study was to determine the effect of root exudates on soil water release curves and hydraulic conductivity over a wide range of soil water contents. We used a sandy soil, as did Colica et al. (2014), to minimize the effects of complex changes in soil structure that can be induced by microbial activity. The hydraulic properties of relatively dry soil were determined by measuring the rate of evaporation and the data were interpreted with a simple analytical solution to evaporation from bare soil (Blacket al., 1969; Parlangeet al., 1992). The effects of stimulating microbial activity on soil hydraulic properties have been reported previously, whereas the effects of suppressing microbial activity have received less attention. In our study, we included soil treated with added mercuric chloride to suppress microbial activity. We tested the hypothesis that soil with an active microbial population was less conductive to water. We used our data to investigate the likely effect of microbial activity on water uptake by roots.
Materials and methods
Soil sample preparation
Soil samples from the surface layer (0 to 20 cm) were collected during April 2015 from three ploughed fallow plots of a randomized experiment on Butt Close experimental field, Woburn Experimental
Farm (52∘00′42′′N, 0∘32′42′′W), Rothamsted Research, UK.
Each of the plots was in a separate block as described by Shanahan
et al. (2015). Butt Close soil is a loamy sand soil (sand: 87.5%, silt: 5.5% and clay: 7.2%), and taxonomically (FAO) this soil is classified as an Arenosol. It has a small organic carbon content (1%), near neutral soil pH (6.63, 1:2 soil:water ratio) and a particle density of 2.65 g cm−3(Whalleyet al., 2008).
Three soil samples from each plot were air-dried, ground and sieved through a 2-mm sieve separately and treated as replicates in the laboratory studies. The moisture content of air-dried soil samples was 1% (weight by weight). Soil was packed into stainless cores (3.59 cm long and 3.86 cm in diameter). The bases of the cores were covered with a fine nylon cloth. The cores were filled homogenously with air-dried 2-mm-sieved loamy sand soil to a bulk density of 1.5 g cm−3.
We prepared artificial root exudates of low-molecular-weight organic compounds from the mixtures of 15 compounds (Pater-sonet al., 2007) comprising five carbohydrates (glucose, fructose, sucrose, arabinose and ribose), five amino acids (glycine, valine, glutamine, serine and alanine) and five organic acids (malic, citric, malonic, oxalic and fumaric). A stock solution of 4.166% C con-centration (41.66 g l−1) was prepared by dissolving each of these 15
compounds (equal in terms of C content: 1.39 g) in 500 ml of dis-tilled water. From this stock solution, three different working solu-tions of root exudates were prepared with enough distilled water to maintain the soil at 100% of water-holding capacity while ensuring an enrichment of 1.25, 2.5 and 5.0 g C kg−1in dry soil packed at a
density of 1.5 g cm−3. Stainless steel cores were filled with air-dried
sieved soil in triplicate and they were saturated with the three solu-tions for 48 hours at 20∘C together with a control (without root exu-dates). The control was saturated in distilled water. Saturation was achieved by placing the samples on a Haynes apparatus and slowly raising the water table to obtain uniform saturation across each core. To stop microbial activity, we applied two additional treatments: (i) soil amended with mercuric chloride solution in one root exu-dates mixture (2.5 g C kg−1dry soil) and (ii) the soil with distilled
water was also amended with mercuric chloride solution. Among the several commonly used soil sterilizing methods in laboratory experiments, mercuric chloride results in effective sterilization with minimal effect on soil chemical and physical properties (Wolf
et al., 1989; Wang et al., 2011), and more importantly the sterile environment lasts for at least 3 weeks (Tuominen et al., 1994; Stephenset al., 2002). Although formaldehyde is more effective at preventing microbial activity, the effectiveness of mercuric chloride is comparable (Tuominenet al., 1994). Importantly for this study, however, mercuric chloride is not a solvent that will evaporate and confound our soil evaporation data (see below). Two sterilized treatments with mercuric chloride solution of 0.1% were prepared by dissolving 0.78 g HgCl2in 250 cm−3of the previously prepared
working solution of root exudates (2.5 g C kg−1 dry soil) and in
distilled water. Soil, also packed to a bulk density of 1.5 g cm−3,
was saturated in 0.1% mercuric solution for 48 hours at 20∘C by raising the water table slowly on a Haynes’ apparatus containing the packed soil cores.
Once the soil had been saturated, as described above, the cores were placed on a mesh support over a saturated solution of CaCl2 in a desiccator. The desiccators were kept at a constant temperature of 20±1∘C, to give a relative humidity of 30%. The air in the desiccator was circulated with battery-driven fans.
In total, there were six treatments: control (in distilled water, TDW), with root exudates at 1.25 g C kg−1 dry soil (T1.25),
2.5 g C kg−1dry soil (T
2.5) and 5.0 g C kg−1 dry soil (T5.0),
steril-ized in distilled water (TDW+Hg) and finally sterilized root exudates
at 2.5 g C kg−1 dry soil (T
2.5+Hg). The evaporation loss in terms
of volumetric water content in the core was measured regularly (hourly) until the water content was constant with time. The cores were removed from the desiccator briefly to measure their mass.
Soil water release characteristics
The water release characteristics were measured on duplicate samples. Plastic cylindrical cores of 50 mm in diameter and 25 mm long were filled homogenously to two-thirds height with air-dry 2-mm-sieved loamy sand soil to a packing density of 1.5 g cm−3.
The exudate treatments were applied to these cores as described above. The saturated soil in the cores was incubated at saturation for 14 days in the dark at room temperature (20±1∘C). After 14 days of incubation, all the cores were equilibrated at eight matric potentials varying from−1,−3,−10,−30,−100,−300,−500 and−1500 kPa. To equilibrate samples at higher matric potentials (−1 to−30 kPa) we used a ceramic suction plate for 5–9 days, whereas samples at lower matric potentials (−100 to−1500 kPa) were equilibrated in a pressure chamber (plate apparatus) for 14–36 days, or longer for lower matric potentials of−500 and–1500 kPa. Three replicates were measured for each of the six treatments at each matric potential. At equilibration, the wet soil weight was recorded and water contents were calculated following oven drying at 105∘C for 48 hours.
Estimation of hydraulic diffusivity
Hydraulic diffusivity is given by dividing hydraulic conductivity by the derivative of the water release curve; its advantage is that its range, or variation, is smaller than that of hydraulic conductivity (Hillel, 1980). We fitted a linearized solution of the desorption process proposed by Blacket al. (1969) to our data:
Ei=2𝜃i
[
t Dav 𝜋
]1∕2
, (1)
whereEi is the cumulative evaporation (cm) and𝜃i is the water content at time t, Dav is the weighted mean diffusivity (Black
In practice, diffusivity is a function of soil water content,D(𝜃). The weighted mean diffusivity,Dav, is related toD(𝜃) as follows:
Dav= ( 1.85
𝜃i−𝜃s
)1.85∫ i
s
(
𝜃i−𝜃
)0.85
D(𝜃)d𝜃, (2)
where𝜃i is the initial water content and𝜃s is the water content
at the soil surface (Blacket al., 1969; Parlangeet al., 1992). The weighted mean diffusivity can be used to interpret time-series data relating to soil water content (Parlangeet al., 1992). Ritchieet al. (2009) used an averaged description of water transport to describe stage 2 evaporation (this is evaporation from unsaturated soil). They called this a ‘functional’ approach instead of a truly ‘mechanistic’ model where, for example, soil water diffusivity depends on water content. Such functional approaches based on constant soil water diffusivity have been used by Passioura (1991) to explore the effects of differences in macroscopic soil structure on water uptake by roots. For our study, an averaged diffusivity is sufficient to discuss the effects of microbial activity on evaporation. As in the case of Ritchieet al. (2009), we are considering stage 2 evaporation and our data are not affected by the movement of water under the influence of gravity.
Statistical analysis
To compare the effect of the experimental treatments on the soil drying curves, we chose a four-parameter logistic curve and the independent variable is the square root of time in hours; the equation is given by:
𝜃=A+( C
1+eB
(√
t−M)
), (3)
whereA,B,CandM are adjustable fitting parameters. We chose a logistic curve because the initial drying did not provide a linear relationship with√t. The logistic fit enabled us to identify this condition, which was assumed to occur near the point of inflection
M. Parallel curve analysis consisted of a series of steps with the fitting of increasingly complex models, and finally choosing the relation that best explained the data. First, a single curve with one set of estimated parameters was fitted. The parameters can be split into linear (AandC) and non-linear (BandM) sets and the next step fits separate intercepts and separateAparameters, representing a lower asymptote. In the next step, we fitted separateCparameters, which represent the available water being evaporated. In the final step we fitted bothBandM as separate parameters to each treatment set of data, whereBis the slope parameter that determines how fast the drying is andMis a location parameter that positions the curve on the√taxis. The analysis was summarized in the accumulated analysis of variance table and at the end of the fitting process we also checked the residuals for normality and homogeneity of variances. The best model to fit to our data had separate parameters for each of the different treatments. The parameters that were of most interest wereB, representing the slope, andM, which represents the mid-point of the region where𝜃is linear with√t. Diffusivity was
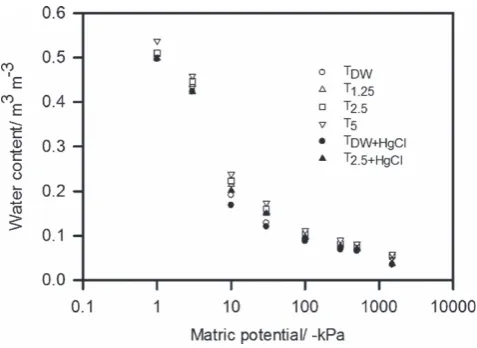
Figure 1 The water release characteristics of soil samples with different treatments. In the interests of clarity, the parameter values are given in Table 1. Analysis of variance of these data (Table 2) showed that the main effects of soil treatment and water potential, as well as their interaction, were all significant atP<0.001.
calculated for each of the separate replicate samples over a range of
√
twhere water loss was linear with√t. Linearity was confirmed by inspection, although the location of the linear region of the curve was indicated byM.
The water release data were fitted by the Van Genuchten Equation:
𝜃𝜓 =𝜃r+[ 𝜃s−𝜃r
1+ (𝛼𝜓)n]m, (4)
where𝜃𝜓is the water content at matric potential𝜓,𝜃ris the residual water content,𝜃s is the water content at saturation and 𝛼, nand
mare fitting parameters. All of these parameters were estimated with curve fitting and we used the constraint of m=1–1/n(van Genuchtenet al., 1980). For each treatment, separate curves were required. These data were also analysed with analysis of variance.
We used Genstat (VSN Int. Ltd, Hemel Hempstead, UK, or Payne, 2015) to fit all the curves described above to our data and for all statistical analysis.
Results
The incubation of soil with artificial root exudates had a small, but significant, effect on the water release characteristics (Figure 1). The water release characteristics in Figure 1 were fitted to the van Genuchten equation (Equation (4)) and the parameter values are listed in Tables 1 and 2. Analysis of variance of these data showed that the main effects of soil treatment and water potential, as well as their interaction, were all significant atP=0.001 (Table 2).
Table 1 Parameters of the van Genuchten equation (Equation (4)) for the water release curves plotted in Figure 1 van Genuchten parameter
Treatment 𝜃s 𝜃r 𝛼 n Percentage of variance accounted for
TDW 0.508 (0.0047) 0.0491 (0.00443) 1.481 (0.032) 3.373 (0.124) 99.8 (P<0.001)
T1.25 0.509 (0.0055) 0.0413 (0.00704) 1.428 (0.039) 3.014 (0.135) 99.7 (P<0.001)
T2.5 0.515 (0.0056) 0.0428 (0.00759) 1.407 (0.04) 2.988 (0.140) 99.7 (P<0.001)
T5.0 0.541 (0.0057) 0.0334 (0.00942) 1.439 (0.042) 2.748 (0.125) 99.7 (P<0.001)
TDW+Hg 0.499 (0.0077) 0.0490 (0.00634) 1.529 (0.005) 3.508 (0.202) 99.4 (P<0.001)
T2.5+Hg 0.502 (0.0074) 0.0271 (0.0111) 1.485 (0.011) 2.808 (0.171) 99.4 (P<0.001)
The standard error of the coefficient is shown in brackets. The treatments are as follows: control (in distilled water, TDW), with root exudates at 1.25 g C kg−1dry
soil (T1.25), 2.5 g C kg−1dry soil (T2.5) and 5.0 g C kg−1dry soil (T5.0), sterilized in distilled water (TDW+Hg) and finally sterilized root exudates at 2.5 g C kg−1
dry soil (T2.5+Hg).
Table 2 Results from the analysis of variance of the water release data shown in Figure 1
Source of variation d.f. Sum of squares Mean square F Fprobability
Block stratum 2 2.38E-06 1.19E-06 0.41
Block•Sample stratum
Treatment 5 1.91E-02 3.81E-03 1302.7 <0.001
Matric potential 7 3.94E+00 5.63E-01 1.92E+05 <0.001
Treatment•Matric potential 35 6.45E-03 1.84E-04 62.94 0.001
Residual 94 2.75E-04 2.93E-06
Total 143 3.97E+00
Both the main effect and the interaction were significant atP<0.001. d.f., degrees of freedom.
required because early in the evaporation experiment water loss was not a linear function of√t. This was probably because the satu-rated calcium chloride solution in the desiccators did not absorb the excess humidity at a sufficient rate, which would have led to variable boundary conditions with, initially, RH>30%. After long periods of time, the relation between water loss and√twas no longer linear. This is likely to be because of soil drying at the base of the core and the failure in the semi-infinite-column condition. The value ofMis the approximate mid-point of the linear relation between𝜃and√t. The parameterMhas values between approximately 5 and 7, and our assumption, that during those times when the relation between
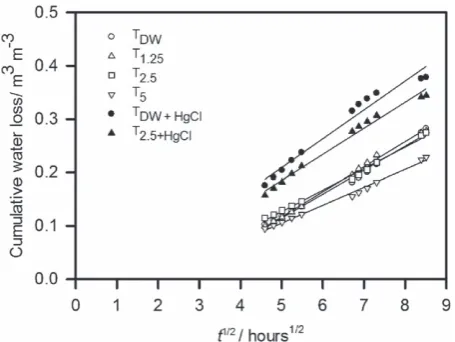
𝜃and√twas linear, was confirmed by inspection (i.e. within the first 2 days for all treatments and within the first day for some treat-ments, TDW+Hg and T2.5+Hg). In Figure 3, we plotted the earliest
cumulative drying data where there was a linear relation with√t, and show the calculated average diffusivity with Equation (1) in Table 4. Table 4 also gives the mean and range in water contents associated with each estimate of average diffusivity. The largest dif-fusivities are associated with the smaller water contents. Diffusivity was smaller in treatments with larger amounts of added synthetic exudates and largest in treatments with added mercuric chloride.
Discussion
Soil porosity
The effects of microbial activity on soil porosity in this research were small. Helliwellet al. (2014), who studied soil that was kept
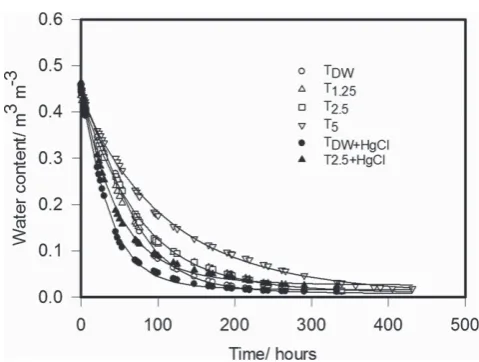
Figure 2 Water content plotted against time for the different experimental treatments. These data were fitted by Equation (3) and the fitted curves are shown. The fitted parameters are given in Table 3.
Table 3Parameter values for Equation (3) when fitted to the drying curves for the different treatments, which are plotted in Figure 1 Parameter values of Equation (3) (SE in brackets)
Treatment A* C B M
TDW 0.00804 (0.00214) 0.4418 (0.00804) −0.5003 (0.014) 7.19 (0.0588)
T1.25 0.01593 (0.00288) 0.4596 (0.00949) −0.3776 (0.0135) 6.58 (0.103)
T2.5 0.00823 (0.0033) 0.4840 (0.0106) −0.3516 (0.0128) 6.74 (0.108)
T5.0 0.00126 (0.0046) 0.5382 (0.0156) −0.2481 (0.0101) 7.34 (0.175)
TDW+Hg 0.01592 (0.00175) 0.4731 (0.00811) −0.5447 (0.0171) 4.94 (0.0798)
T2.5+Hg 0.02585 (0.00219) 0.5089 (0.01188) −0.4119 (0.0140) 5.01 (0.123)
Parallel curve fitting accounted for 99.8% of the variance and confirmed that the best fit to the data was obtained with different coefficients for each treatment. Accumulated analysis of variance, following grouped regression, showed that each treatment required separate parameters (P<0.001). A*, lower asymptote;C, intercept represents available water being evaporated;B, slope parameter that determines how fast the drying is;M, location parameter represents the mid-point. Treatment abbreviations are explained in the text and Table 1.
Figure 3 The relation between the cumulative water loss and√t. These data correspond to the region where the water loss is expected to be a linear function of√t. We used the value ofM, in Equation (3), as an approximate guide to this region (i.e. between 5 and 7).
we observed in our experiment was small and suggests that the effect of microbial activity on soil structure in this study was also small. The small range in porosity in this research compared with that of Helliwellet al. (2014) is probably because our soil samples were unsaturated, whereas Helliwell et al. (2014) investigated saturated soils. The expansion of trapped gaseous emissions in bubbles in saturated soils, such as those described by Helliwellet al. (2014), is likely to alter both porosity and structure. Bubbles are not likely to form in unsaturated soil.
Hydraulic properties
In common with previous studies, we found that microbial activity impeded the transport of water through soil, as shown by the diffusivity data in Table 4. Treatments with the greatest addition of exudate have the lowest diffusivity and those treated to stop microbial activity have the highest diffusivity. Soil drying curves in Figure 2 also show that the rate of soil drying is much slower in
the treatments designed to stimulate microbial activity and faster in those treatments designed to suppress microbial activity. The effects of the treatments on the water release characteristics are statistically significant (Figure 1 and Table 2), although they are small in comparison with those reported by Readet al. (2003) and Ahmedet al. (2014) for the effect of exudates, and by Oret al. (2007) for the effects of extracellular polymeric substances.
Implications for roots
Gao et al. (2017) showed that additions of the same synthetic exudates used in this work to the same soil altered the microbial community in both structure and quantity. Our data show that the flow of water through soil is also impeded; Figure 2 and Table 4 show that diffusivity was halved by increased microbial stimulation, which has been widely reported (Oret al., 2007). We also show that the flow of water can be increased by suppressing microbial activity with the addition of mercuric chloride. Our estimated mean diffusivity of the control soil more than doubled from 4.1 to 9.1 cm2day−1 with the addition of mercuric chloride. The key
implication is that much of the reported hydraulic data in the literature is affected by the background microbial activity that is present during the measurement process.
Passioura (1991), assuming a mean diffusivity of 2 cm2day−1,
concluded that it was macroscopic soil structure (e.g. aggregated or blocky) or the distribution of roots within soil that was most likely to limit water uptake by roots, and not the movement of water through bulk soil. In our study, the least conductive soil obtained by adding the largest amount of exudates (5.0 g C kg−1
dry soil, T5.0) had a diffusivity of 2.08 cm2day−1, which was
close to half of that estimated for the soil without any added exudates (4.07 cm2day−1). It seems likely that any possible effect
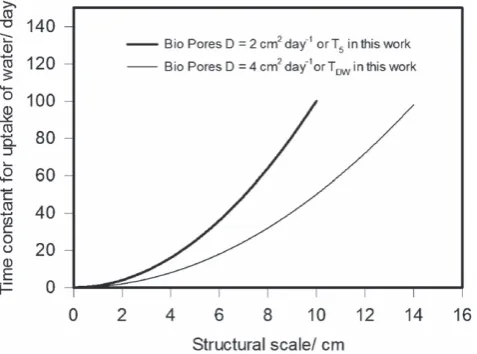
of exudates (with respect to water uptake by roots) on the soil we studied must be related to reducing the rate of water sorption from soil. In Figure 4 we have replotted the relation between the time constant for water uptake (i.e. the time taken for the roots to take up half of the available water) and the structural scale derived by Passioura (1991) forD=2 cm2day−1(i.e. T
5) alongside
the same curve forD=4 cm2day−1 (i.e. T
Table 4 Average diffusivities estimated with Equation (1) and the data in Figure 3. These are the mean values for the diffusivities calculated for each individual replicate
Water content /cm3100 cm−3
Treatment Log10(D/cm2day−1) Porosity
Back-transformed
diffusivity (cm2day−1) Min Max Mean
TDW 0.61 0.51 4.07 1.3 8.7 3.6
T1.25 0.67 0.51 4.68 2.1 11.9 6.0
T2.5 0.55 0.51 3.55 2.1 12.4 6.0
T5.0 0.32 0.54 2.08 5.7 18.0 10.7
TDW+HgCl 0.96 0.50 9.12 1.3 5.4 2.5
T2.5+HgCl 0.79 0.50 6.17 2.7 9.2 5.0
The least significant difference in log10D(LSD forP=0.05) is 0.072. The final soil porosity data are also listed (LSD=0.002 forP=0.05). The minimum
(Min), maximum (Max) and mean water contents corresponding to the range of water contents associated with estimated diffusivity are also given. Treatment abbreviations are explained in the text.
Figure 4 The time constant for water uptake (i.e. the time taken for roots to extract half of the available water) plotted against structural scale. These data represent the case for bio-pores (Passioura, 1991). The difference between the two curves represents the range of values of the time constant for water uptake possibly related to the effects of exudates at 5 g kg−1soil
(2 cm2day−1) compared with the control (4 cm2day−1).
exudates was to double the time constant for water uptake by roots growing in bio-pores. Furthermore, because the time constant for water uptake approximates tow2/4nDwheren=1, 2 or 3 for
slabs, prisms and cubes andwis the structural scale (see Passioura, 1991), the effect of root exudates in halvingD is equivalent to making prisms behave like slabs. This assumes that the effects of exudates are uniformly distributed in soil; however, the proportion of soil influenced by roots is restricted. Nevertheless, the effect of exudates in restricting water uptake might be an important and beneficial trait. Wheat-breeding programmes have reduced xylem conductance as a strategy for improving water use efficiency in arid regions (Richardset al., 2010), allowing water use to be distributed more uniformly in the growing season. It is reasonable to expect that a doubling of the time constant for water uptake could play an important role in this endeavour.
In contrast to the more immediate effects of recently applied mucilage in increasing conductance (Ahmedet al., 2014), we found that microbial activity had the effect of reducing conductance. Our data are consistent with those of Colicaet al. (2014), who showed that the hydraulic conductivity decreased with increasing additions of high-molecular-weight compounds. At high water potentials, such as those studied by Ahmed et al. (2014), root mucilage can increase the soil water content, and this effect can increase the hydraulic conductance of soil, thereby increasing root water uptake. Simulations show that root mucilage can help plants to sustain transpiration for up to 42 hours as the soil dries (Carminati
et al., 2015). In our study, we measured soil drying over a similar period, although our treatments included the growth of microbial communities (Gaoet al., 2017) or their suppression (Wolfet al., 2013). It seems that the effects of root-exuded mucilage can be split into short-term effects from the physical effects of surface tension and viscosity (Kroeneret al., 2014), and the longer-term effects that arise because exudates stimulate microbial activity. Our data are most relevant to the long-term effects that arise because microbial activity blocks soil pores (e.g. Wolf et al., 2013) or modifies wettability (e.g. Hallett & Young, 1999). The longer-term effects of microbial activity are more commonly associated with the mineralization of nutrients, particularly in the production of nitrate. However, as we have discussed above, the reduction in diffusivity may well play an important role in moderating the use of soil water reserves in arid conditions, or in climates with well-defined wet and dry seasons. Tardieu (2012) has observed that almost any trait may conserve water in the right circumstances.
Conclusions
The addition of synthetic root exudates to a sandy soil reduced the hydraulic diffusivity. Compared with a control soil with no added exudates, the addition of 5 g C kg−1 of soil halved the diffusivity
from 4 to 2 cm2day−1. Suppression of microbial activity with the
addition of mercuric chloride to soil increased diffusivity more than twofold in comparison with the control, from 4 to 9 cm2day−1.
in diffusivity is comparable to a shift in the soil structural unit, for example moving from a prismatic soil to slab structure.
Acknowledgements
Dr Burhan U. Choudhury was appointed as a Rothamsted Inter-national Fellow and in India he is supported by the Indian Coun-cil of Agricultural Research. SF was supported by the H2020 project ‘ECOPOTENTIAL: Improving Future Ecosystem Benefits Through Earth Observations’, coordinated by CNR-IGG (http:// www.ecopotential-project.eu). The project has received funding from the European Union’s Horizon 2020 research and innova-tion programme under grant agreement No 641762. At Rothamsted Research, WRW and RWA are supported by the BBSRC Designing Future Wheat project and the BBSRC/NERC ASSIST project. DSP is a Lawes Trust Senior Fellow. We thank Rodger White for advice and guidance with respect to the statistical analysis.
References
Ahmed, M.A., Kroener, E., Holz, M., Zarebanadkouki, M. & Carminati, A. 2014. Mucilage exudation facilitates root water uptake in dry soils. Functional Plant Biology,41, 1129–1137.
Black, T.A., Gardner, W.R. & Thurtell, G.W. 1969. The prediction of evaporation, drainage, and soil water storage for a bare soil.Soil Science Society of America Proceedings,33, 655–660.
Carminati, A., Kroener, E., Ahmed, M.A., Zarebanadkouki, M., Holz, M. & Ghezzehei, T. 2015. Water for carbon.Vadose Zone Journal. 1–10. https://doi.org/10.2136/vzj2015.04.0060.
Colica, G., Li, H., Rossi, F., Li, D., Liu, Y. & De Philippis, R. 2014. Microbial secreted exopolysaccharides affect the hydrological behaviour of induced biological soil crusts in desert sandy soils.Soil Biology & Biochemistry,68, 62–70.
Gao, W., Muñoz-Romero, V., Ren, T., Ashton, R.W., Morin, M., Clark, I.M. et al.2017. Effect of microbial activity on penetrometer resistance and elastic modulus of soil at different temperatures.European Journal of Soil Science,68, 412–419.
van Genuchten, M.T. 1980. A closed-form equation for predicting the hydraulic conductivity of unsaturated soils. Soil Science Society of America Journal,44, 892–898.
Hallett, P.D. & Young, I.M. 1999. Changes to water repellence of soil aggregates caused by substrate-induced microbial activity. European Journal of Soil Science,50, 35–40.
Hallett, P.D., Gordon, D.C. & Bengough, A.G. 2003. Plant influence on rhi-zosphere hydraulic properties:direct measurements using a miniaturized infiltrometer.New Phytologist,157, 597–603.
Helliwell, J.R., Miller, A.J., Whalley, W.R., Mooney, S.J. & Sturrock, C.J. 2014. Quantifying the impact of microbes on soil structural development and behaviour in wet soils.Soil Biology & Biochemistry,74, 138–147. Hillel, D. 1980.Fundamentals of Soil Physics. Academic Press, New York. Kroener, E., Zarebanadkouki, M., Kaestner, A. & Carminati, A. 2014. Nonequilibrium water dynamics in the rhizosphere: how mucilage affects water flows in soil.Water Resources Research,60, 6479–6495.
Parlange, M.B., Katul, G.G., Cuenca, R.H., Kavvas, M.L., Nielsen, D.R. & Mata, M. 1992. Physical basis for a time series model of soil water content.Water Resources Research,28, 2437–2446.
Passioura, J.B. 1991. Soil structure and plant growth.Australian Journal of Soil Research,29, 717–728.
Paterson, E., Gebbing, T., Abel, C., Sim, A. & Telfer, G. 2007. Rhizodepo-sition shapes rhizosphere microbial community structure in organic soil. New Phytologist,173, 600–610.
Payne, R.W. 2015.The Guide to GenStat Release 17–Part 2: Statistics. VSN International, Hemel Hempstead.
Or, D., Phutane, S. & Dechesne, A. 2007. Extracellular polymeric sub-stances affecting pore-scale hydrologic conditions for bacterial activity in unsaturated soils.Vadose Zone Journal,6, 298–305.
Read, D.B., Bengough, A.G., Gregory, P.J., Crawford, J.W., Robinson, D., Scrimgeour, C.M.et al.2003. Plant roots release phospholipid surfactants that modify the physical and chemical properties of soil.New Phytologist,
157, 315–326.
Richards, R.A., Rebetzke, G.J., Watt, M., Condon, A.G., Speilmeyer, W. & Dolferus, R. 2010. Breeding for improved water productivity in temperate cereals: phenotyping, quantitative trait loci, mark-ers and the selection environment. Functional Plant Biology, 37, 85–97.
Ritchie, J.T., Porter, C.H., Judge, J.J., Jones, J.W. & Suleiman, A.A. 2009. Extension of an existing model for soil water evaporation and redistribution under high water content conditions.Soil Science Society of America Journal,73, 792–801.
Shanahan, P., Binley, A., Whalley, W.R. & Watts, C.W. 2015. The use of electromagnetic induction (EMI) to monitor changes in soil moisture profiles beneath different wheat cultivars.Soil Science Society of America Journal,79, 459–466.
Stephens, K.D., Farenhorst, A. & Fuller, L.G. 2002. Effect of soil steril-ization by mercuric chloride on herbicide sorption by soil.Journal of Environmental Science and Health B,37, 561–571.
Tardieu, F. 2012. Any trait or trait-related allele can confer drought tolerance: just design the right drought scenario.Journal of Experimental Botany,63, 25–31.
Tuominen, L., Kairesalo, T. & Hartikainen, H. 1994. Comparison of meth-ods for inhibiting bacterial activity in sediment.Applied Environmental Microbiology,60, 3454–3457.
Wang, C.Y., Wang, F., Wang, T., Yang, X.L., Bian, Y.R., Kengara, F.O.et al. 2011. Effects of autoclaving and mercuric chloride sterilization on PAHs dissipation in a two-liquid-phase soil slurry.Pedosphere,21, 56–64. Whalley, W.R., Leeds-Harrison, P.B., Leech, P.K., Riseley, B.A. & Bird,
N.R.A. 2004. The hydraulic properties of the soil at root-soil interface. Soil Science,169, 90–99.
Whalley, W.R., Watts, C.W., Gregory, A.S., Mooney, S.J., Clark, L.J. & Whitmore, A.P. 2008. The effect of soil strength on the yield of wheat. Plant and Soil,306, 237–247.
Wolf, A.B., Vos, M., de Boer, W. & Kowalchuk, G.A. 2013. Impact of matric potential and pore size distribution on growth dynamics of filamentous and non-filamentous soil bacteria.PLoS One,8, https://doi.org/10.1371/ journal.pone.0083661.