Multiple Daily Base Station Switch-Offs in Cellular
Networks
Marco Ajmone Marsan
1,2, Luca Chiaraviglio
1, Delia Ciullo
1, Michela Meo
11) Electronics and Telecommunications Department, Politecnico di Torino, Italy
2) IMDEA Networks, Madrid, Spain
Abstract—In this paper we study base station sleep modes, which are today considered a viable approach to improve the energy efficiency of cellular access networks, by reducing power consumption in periods of low traffic.
When some base stations are switched off, radio coverage and service provisioning are taken care of by the base stations that remain active, so as to guarantee that service is available over the whole area at all times. This is a realistic assumption in the case of the dense base station layouts of urban areas, which consume most of the network energy.
We develop simple analytical models that allow optimal base station switch-off times to be identified as a function of the daily traffic pattern, in the cases in which either just one switch-off per day is possible (bringing the network from a high-power, fully-operational configuration, to a low-power reduced configuration), or several switch-offs per day are permitted (progressively reducing the number of active base stations and the network power).
We first assume that any fraction of base stations can be switched off, then we consider a realistic case.
We quantify the percentage of energy which can be saved with base station sleep modes, proving that it can be close to 50% of the total network energy consumption.
I. INTRODUCTION
In the early days of networking, the termpower was used to identify the ratio of throughput over delay [1], [2], because energy issues did not belong in the networking landscape. Then, cellular networks and battery-operated terminals (most notably mobile phones) came along, and power control (now real power, measured in J/s) became an issue, in order to extend both the distance from the base station at which a terminal could be used, and the battery charge duration (in the early ’90s, heavy users carried a spare charged battery in their pocket, to avoid being cut off around noon). Next, sensor networks brought with them the question of power minimization to increase the network lifetime. Still, before the turn of the century, power consumption was not an element of the wired network design space. The first paper that addressed energy issues in fixed networks was [3], where Gupta and Singh investigated the energy consumption of Internet devices, and discussed the impact of sleep modes on network protocols. Since then, the interest in energy-efficient networking has been steadily rising, and the energy issue is now addressed in many papers and research projects, among which we wish to mention TREND (Towards Real Energy-efficient Network Design) [4], the Network of Excellence funded by the European Commis-sion within its 7th Framework Programme, and the Italian
PRIN project EFFICIENT, which supported the work reported in this paper.
The directions that are presently pursued to achieve energy efficiency in networking can be grouped in two classes: 1) development of new technologies that reduce energy consump-tion, and 2) identification of approaches that make the network energy consumption proportional to traffic. The rationale for the second direction derives from the observation that today network equipment exhibits power consumption which is practically independent on load. For example, a base station of a cellular network consumes at zero load about 80-90% of the energy consumption at full load [5].
Approaches that aim at improving the proportionality be-tween the network energy consumption and the network load can be further divided in 2 sub-classes: 2a) development of equipment exhibiting better proportionality of energy con-sumption to load, and 2b) identification of algorithms that allow the reduction of the functionality of network equipment in periods of low traffic, so as to decrease energy consumption in such periods. The algorithms that received most attention in class 2b are often called speed scaling, and sleep modes. By speed scaling we normally mean that the equipment can operate at different clock rates, with lower rates corresponding to lower power (and lower performance). By sleep modes we mean that in periods of low traffic the network operates with a subset of its equipment, the rest being switched off to save energy.
in rural areas, but is on the contrary a realistic hypothesis for the dense layouts of urban areas, which consume most of the network energy.
The fact that BSs are the most energy-greedy components of cellular networks, and are often under-utilized, was realized only few years ago [6], [7], [8], [9]. Since then, several approaches have been pursued to reduce the carbon footprint of BSs, ranging from the use of renewable energy sources [10], to the improvement of hardware components [11], to cell zooming techniques [12], to the adoption of sleep modes. As regards sleep modes, starting from our early works [13], [14], [15], it has been shown that sleep modes adoption for BSs is an efficient solution that allows a significant amount of energy to be saved during low traffic periods. Later, also the authors of [16] showed, using real data traces, that promising potential savings are achievable by turning off BSs during low traffic periods. Recently, in [17] the authors have investigated energy savings in dynamic BS operation and the related problem of user association, showing that their algorithms can significantly reduce the energy consumption. A distributed solution to switch off underutilized BSs when traffic is low, and switch them on when traffic is high, was proposed in [18]; large savings, that depend on temporal-spatial traffic dynamics, are shown to be possible.
Differently from most previous works, but expanding our analysis in [14], here we analytically characterize the max-imum energy savings that can be achieved under a given traffic profile. In particular, we analytically show that the optimal trade-off between energy savings and complexity in network management is obtained when only few switch-off configurations per day are allowed, and BSs are switched-off in increasing order of load. These results are also corroborated by a case-study analysis.
The main differences between this work and [14] are the following. First, in [14] we focused on just one switch-off, while in this work we consider the possibility of multiple switch-offs. Second, in [14] we focused on homogeneous networks (i.e., networks where all cells have identical size and traffic pattern), while here we consider also heterogeneous networks (i.e., different cell sizes and traffic patterns). Third, we consider a realistic cell deployment of an operator network, rather than assuming only idealized cell layouts, like in [14].
II. OPTIMALSLEEPMODES INHOMOGENEOUS NETWORKS
We first propose a simple analytical framework to compute the optimal energy savings assuming that one switch-off only is allowed per day (summarizing the results of [14]). Then, we extend our analysis in [14] to the case in which multiple switch-offs are allowed, and we discuss the savings achievable with these schemes under an idealized traffic profile.
A. One switch-off
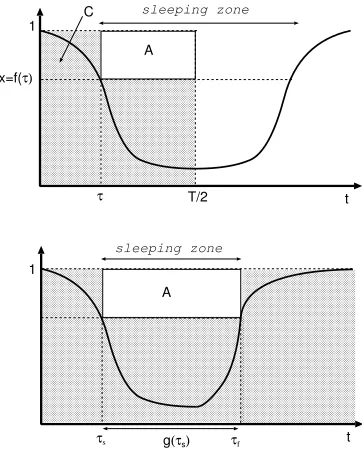
Letf(t)be the daily traffic pattern in a cell, i.e., the traffic intensity as a function of timet, with t ∈[0, T], T = 24 h, andt= 0the peak hour;f(t)is normalized to the peak hour traffic, so thatf(0) = 1. As an example, in Fig. 1 we report
T/2 t
1
x=f(τ)
τ
t 1
τs
A C
A
τf
g(τs) sleeping zone
sleeping zone
Fig. 1. Traffic intensity during a day: symmetric case (top), and asymmetric case (bottom).
two typical daily traffic patterns, a symmetrical one (top), and an asymmetrical one (bottom). The cellular access network is dimensioned so that at peak traffic a given QoS constraint is met. Clearly, if the QoS constraint is met under peak traffic
f(0), it is also met for lower values of traffic intensity, and thus during the whole day. We assume that in the considered area all cells have identical traffic patterns, and we thus say that the network ishomogeneous.
Consider a sleep schemeΦsuch that, during the low traffic period (called sleeping zone), a fraction x < 1 of the cells is active, while the remaining fraction, 1−x, of the cells (actually, of the respective BSs) is in sleep mode. As was shown in [14], during the sleeping zone, the x on BSs have to sustain, in addition to their own traffic, the traffic that in normal conditions is taken care of by the 1−xoff BSs; so that their traffic becomes:
f(Φ)(t) =f(t) +1−x x f(t) =
1
xf(t) (1)
i.e., they receive 1/xtimes their own traffic. Thus, to always satisfy the QoS constraint, schemeΦcan be applied whenever the traffic is so low that f(Φ)(t) is still below 1, that is the
peak hour traffic. Starting from the peak hour, with decreasing
f(t), the earliest time instant τ in which Φcan be applied is defined byf(Φ)(τ) = 1, so that,
τ =f−1(x)
(2)
As shown in Fig. 1, the sleeping zone starts in τ and lasts for the whole period in which the traffic intensity is below
f(τ) =x.
For simplicity, let us now focus on a daily traffic pattern that is symmetric aroundT /2, i.e., such thatf(τ) =f(T−τ)with
t 1
f(t)
T/2 T
a
Fig. 2. Trapezoidal traffic pattern.
schemeΦis equal to,
C(τ) = 2W
τ+f(τ)
T
2 −τ
(3)
since for a period2τ the consumption isW, and for a period
2(T /2−τ) the consumption is a fraction x of the previous one:xW =f(τ)W. The total network saving with respect to an always-on scheme is,
S = 1−C(τ)
W T (4)
When one sleep scheme only is allowed per day, the optimal scheme is the one that can be applied in τ∗ ∈[0, T /2], with τ∗ such that the energy consumption C(τ)is minimum, and
saving is maximum. By assuming that f(t)is monotonically decreasing in the interval [0, T /2], the value of τ∗ can be
obtained from the derivative ofC(τ), letting
2W
1 +f′(τ∗)
T
2 −τ ∗
−f(τ∗)
= 0 (5)
A graphical representation of this result is shown in the top part of Fig. 1. The energy consumption is proportional to the shaded area: it isW for a periodτ, andW f(τ)for a period
T
2 −τ
. To minimize energy consumption, the rectangular white area in the figure should be as large as possible.C(τ). For non-symmetric traffic patterns f(t), as in the bottom part of Fig. 1, the optimum scheme can be derived in a similar way by defining the areaAand looking for the value ofτ that guarantees thatA is the maximum possible one.
Trapezoidal traffic pattern: As a special simple example of daily traffic pattern we consider the family of symmetric trapezoidal curves plotted in Fig. 2, with maximum equal to 1 at the peak hour, and different slopes, defined by the angular coefficienta,1
f(t) =
1−at 0≤t <1/a
0 1/a≤t≤T /2 (6)
with 1/a < T /2 (a similar derivation is possible for values
1/a > T /2).
Applying (5), the minimum energy consumption can be achieved for
aτ∗=a
T
2 −τ ∗
(7)
1Rather than working on a single profile, we consider a family of profiles. In this way, we extend our findings to a generic scenario which is representative of different traffic profiles.
0 20 40 60 80 100
0 10 20 30 40 50
τ/(T/2) [%]
Saving [%]
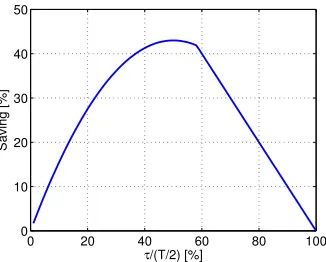
Fig. 3. Trapezoidal traffic pattern: saving with one switch-off scheme.
T/2 t
1
f(τ1)
τ1 f(τ3)
τ3
A3
f(τ2)
τ2
Fig. 4. Example of multiple sleep schemes withN=3.
so that:
τ∗=
T /4 ifT /4<1/a
1/a otherwise (8)
It is interesting to observe that, whenever 1/a > T /4, the optimal scheme consists of a 50-50 rule, that uses all BSs in the high-traffic half-day, and turns off a fraction aT /4 of the BSs in the low-traffic half-day.
The resulting maximum network saving with respect to an always-on scheme is,
S∗=
aT
8 if T /4<1/a
1−aT2 otherwise (9)
which is at least equal to 25%, since1/a < T /2.
Fig. 3 reports the savingSfor different values ofτunder the trapezoidal profile with a = 0.14 [1/h]. The saving strongly depends on the values ofτ and it is larger than 40% forτ = τ∗.
B. Multiple sleep schemes
Now we study the maximum saving achievable when mul-tiple sleep schemesΦi (withi= 1, ..., N) are allowed during
a day. In particular, given a decreasing traffic profile f(t), symmetric around T /2, we assume that the schemes Φi are
ordered in such a way that the fraction of BSs that is switched off increases withi. In other words, we assume to switch-off a fraction(1−x1)of BSs at a certain time instantτ1, a fraction
(1−x2) atτ2, ..., (1−xi) at τi, with x1 > x2 > ... > xi.
As shown in Fig. 4, the area AN is now the composition of
some rectangular shapes, and can be computed as,
AN(τ1, τ2,· · ·, τN) = N
X
i=1
20 40 60 80 100 20
40 60 80 100
τ
1/(T/2) [%]
τ2
/(T/2) [%]
0 10 20 30 40 50
Fig. 5. Trapezoidal traffic pattern: percentage saving, according to the color scale on the right, with double switch-off scheme.
whereτN+1=T /2. As for the single switch-off scheme case,
the network saving,SN, can be maximized by maximizing the
area AN, i.e., by finding the set of values (τ1∗, τ2∗,· · ·, τN∗)
such that dAN
dτi = 0, for i = 1,· · ·, N. Thus, the following
system of equations must be solved:
−f′(τ
i)(τi+1−τi) +f(τi)−f(τi−1) = 0withi= 1, ..., N
(11) withτ0= 0(so thatf(τ0) = 1) andτN+1=T2.
An upper bound of the achievable network saving can be obtained by considering that the fraction of BSs that is switched off increases in a continuous way, through infinites-imal increments. In other terms, the upper bound of the area
A, namely area AU, can be computed as the complement of
the integral off(t),
AU =
Z T /2
0
(1−f(τ))dτ (12)
that corresponds to the upper bound of the saving,
SU = 2 T
Z T /2
0
(1−f(τ))dτ (13)
In the following, we start by analyzing the case of two switch-off schemes, i.e., N = 2, for the trapezoidal traffic profile. Then, the results obtained for N > 2 are presented. We will refer to optimal saving forN switch-off schemes by
S∗
N.
Trapezoidal traffic pattern: We solve (11) for the trape-zoidal traffic pattern and two switch-off configurations (N = 2), obtaining the following optimal switch-off time instants
(τ∗ 1, τ2∗):
τ∗ 1 =
T /6 ifT /3<1/a
1/(2a) otherwise (14)
τ∗
2 =
T /3 ifT /3<1/a
1/a otherwise (15)
The maximum savingS∗ 2 is,
S∗ 2 =
aT
6 ifT /3<1/a
1−2aT3 otherwise (16)
which is at least equal to 33%, since1/a < T /2.
Fig. 5 reports S2 versus τ1 and τ2 for a = 0.14 [1/h]. The first switch-off configuration is applied at τ1, while the
0 0.1 0.2 0.3 0.4
0 20 40 60 80 100
Angular Coefficient [1/h]
Saving [%] Upper Bound N=4 N=3 N=2 N=1
Fig. 6. Trapezoidal traffic pattern: maximum achievable saving for various number of schemes versus the angular coefficienta.
second one is applied at τ2. Observe that, by definition of the τi, the white area for whichτ1 ≥τ2 corresponds to non
admissible points. Moreover, the maximum saving corresponds to the configurations applied at the optimal time instants τ∗ 1
andτ∗
2. As expected, the maximum saving with two schemes,
that is around 50%, is larger than the one of single switch-off case (Fig. 3).
Fig. 6 shows the maximum network savingS∗
N versus the
angular coefficienta for some values of N; the upper bound
SU is also reported. Clearly, the saving increases with N, reaching the upper bound for N → ∞. However, while the two switch-off scheme achieves significant additional saving with respect to the single switch-off case, the further increase of N to 3, 4, leads to marginal further improvements. This means thatN = 2,3is enough to achieve saving that is close to the upper bound. Higher values ofN bring small additional improvements only, while introducing higher complexity in network management.
III. HETEROGENEOUSNETWORKS
We now consider the case ofheterogeneous networks, i.e., networks in which cells of different size and load coexist (possibly covered by BSs with different technologies). In par-ticular, we consider a scenario in which an umbrella (macro) cell provides coverage over an area, and K micro-cells are deployed to provide additional capacity. To save energy, micro-cells can be put to sleep when their traffic is low and can be carried by the macro-cell.
We assume that the traffic profilef(t)of the umbrella cell is decreasing with t and is symmetric around T /2. The micro-cells have the same traffic profile shape as the macro-cell,
f(t), since this is given by the typical human behavior that is assumed to be uniform in a given area; however, based on size and user density, the shape can be scaled down of a given factor, i.e., micro-celli supports a traffic that isαif(t), with
αi<1. Without loss of generality, letα1< α2< ... < αK.
own traffic. That is, when the following condition holds,
f(τ1) +αo(1)f(τ1) = 1 (17)
τ1=f−1 1 1 +αo(1)
Similarly, thei−th switch-off instant corresponds to the instant in which the macro-cell can carry its own traffic and the traffic of the micro-cellso(1),o(2),· · ·, o(i), that is,
τi=f−1
1 1 +Pi
j=1αo(j) !
(18)
Assuming that the micro-cells consume W watts each, and that the macro-cell consumes WM, the network daily
consumption is given by,
C = WMT+ 2W K
X
i=1 τi
= WMT+ 2W K
X
i=1
f−1 1
1 +Pi
j=1αo(j) !
(19)
since the macro-cell is always on and consumes 2WMT /2
per day, while micro-cell o(i), that switches off at time τi
consumes an amount of power equal to2W τi. It can be shown
that the optimal ordering that guarantees the maximum saving consists in switching off micro-cells according to their load from the least-loaded to the most loaded.
IV. CASESTUDY
We now consider traffic profiles measured from an anonymized cellular operator, whose data are available online (see [19]). In particular, we focus on two profiles: the first one, namely theweekday profile, is chosen as the most-loaded day of the most-loaded BS among the available profiles; the second one, theweekendprofile, is measured on Sunday for the same BS. Both profiles are reported in Fig. 7. Traffic is normalized to the weekday peak hour, that occurs around 7pm. Traffic is lower in the weekend profile, with a peak around 5pm, about 40% lower than the weekday peak. For both profiles, traffic is very low from late night to early morning, i.e., from 1am to 9am. Similar to the synthetic profile considered in Sec. II, the profiles have wide off-peak periods, short peak periods, and steep transitions. This confirms that the results presented in Sec. II, while being derived with synthetic traffic, can be considered representative of real profiles.
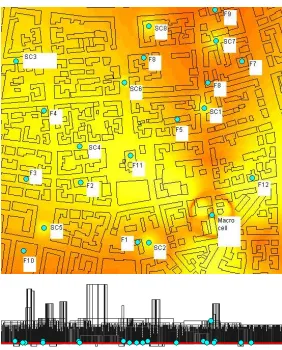
We focus on a case study given by a realistic cell deploy-ment. We consider a portion of the central area of the city of Munich, Germany, which corresponds to a square of 800 x 800 m comprising 1 macro-cell, 8 micro-cells, and 10 femto-cells. Femto-cells are deployed to provide additional capacity during peak hours in indoor environments. However, we do not consider them in the sleep schemes, since they consume a negligible amount of power (around 0.02 watts). The micro-cells are served by isotropic antennas, each with transmission power of 1 W, while the macro-cell has a tri-sectorial antenna with emitted power of 40 W. We assume that the total power consumption of the macro-cell is seven times higher than the
0 0.2 0.4 0.6 0.8 1
17:00 21:00 01:00 05:00 09:00 13:00 17:00
Traffic, f(t)
Time, t [h] Weekend Weekday
Fig. 7. Traffic intensity: weekday and weekend profiles.
Fig. 8. Case study: Map with cell identifiers (SC = micro cell). Aerial view (top) and side view (bottom).
one of a micro-cell [20]. For example, the macro-cell can be assumed to consume 1400 W and a micro-cell 200 W. Moreover, we assume that power consumption is negligible when the BS is powered off. Fig. 8 presents a map of the considered area (top), together with a side view (bottom).
The coverage is computed from the signal strength received on the users’ pilot channel. To estimate the channel conditions, i.e., the path losses, we use the results of a tool developed by Alcatel-Lucent, called Wireless System Engineering (WiSE) [21], that is based on ray-tracing techniques. We refer the reader to [22] for further details on coverage computation.
The network is planned assuming that i) users are uniformly distributed in the area, ii) the generated traffic follows the weekday profile of Fig. 7, and iii) at the peak, the most loaded cell carries traffic equal to 1. During low traffic periods, micro-cells are switched off and the macro-cell acts as an umbrella cell. We assume that the macro-cell guarantees full coverage, even when all the other cells are put in sleep mode.
We now compute the energy saving achievable with several switch-off schemes. Table I summarizes the network saving
TABLE I
CASESTUDY: SAVINGS WITH DIFFERENT SWITCH-OFF SCHEMES
(WEEKDAY PROFILE)
Switch-off scheme S[%]
Single (8/9) 40.8 Double (5/9)-(8/9) 45.7 Triple (3/9)-(5/9)-(8/9) 46.9
Maximum 48.7
19:000 23:00 03:00 07:00 11:00 15:00 19:00
1 2 3 4 5 6 7 8
Time
Number of Micro Base Stations On
Maximum Single Switch Off Double Switch Off Triple Switch Off
Fig. 9. Number of active micro BSs versus time for different switch-off schemes.
(labeled with ’Maximum’): this represents a lower bound on the minimum number of active BSs that allows the network to achieve the maximum saving by switching off all the cells except the macro in the best order, i.e., from the least loaded to the most loaded.
V. CONCLUSIONS
In this paper we investigated the energy saving that can be achieved in cellular access networks by optimizing the use of sleep modes according to the daily traffic variations.
Our study adopts several simplifying assumptions about network traffic and technology, the most important of which are: i) users are uniformly distributed over the area served by the cellular access network (this makes traffic uniform across cells, if cells have the same area), and ii) when a cell is switched off, coverage can be filled by its neighbors, which also absorb the traffic.
In this setting, we derived expressions for the energy saving as a function of the daily traffic pattern, assuming first that only one switch-off is allowed per day, and then considering multiple switch-offs per day.
The achievable savings were computed for a realistic cell layout, obtaining several interesting insights. First of all, we computed potential energy savings up to almost 50%. This is an important signal that sleep modes can indeed be a useful tool for energy-efficient networking. Second, we have shown that significant savings can be achieved with only one switch-off per day, while the benefit of multiple switch-switch-offs is minor. This is also an important indication, because it shows that most of the gains can be obtained with limited effort on the side of network management.
Our results provide a tangible incentive for cellular network operators to implement sleep modes in their networks.
ACKNOWLEDGEMENT
The authors wish to thank Alberto Conte and Afef Feki of Alcatel-Lucent Bells Labs for providing data about the
realistic BS deployment and coverage in downtown Munich. We also wish to thank the authors of [19] for making available the cellular network traffic traces. The research leading to these results has received funding from the European Union Seventh Framework Programme (FP7/2007-2013) under grant agreement n. 257740 (Network of Excellence TREND) and from the Italian PRIN project EFFICIENT.
REFERENCES
[1] A. Giessler, J. Haenle, A. Koenig, E. Pade,Free buffer allocation: An
investigation by simulation, Computer Networks, Vol.2, n.3, July 1978,
pp. 191-208.
[2] L. Kleinrock,Power and Deterministic Rules of Thumb for Probabilistic
Problems in Computer Communications, ICC 79, Boston, MA, USA, June
1979.
[3] M. Gupta, S. Singh,Greening of the Internet, ACM SIGCOMM 2003, Karlsruhe, Germany, August 2003.
[4] TREND Project, http://www.fp7-trend.eu.
[5] K. Son, B. Krishnamachari,SpeedBalance: Speed-Scaling-Aware Optimal
Load Balancing for Green Cellular Networks, IEEE INFOCOM
Mini-conference 2012, Orlando, FL, USA, March, 2012.
[6] J.T. Louhi,Energy efficiency of modern cellular base stations, INTELEC 2007, Rome, Italy, September-October 2007.
[7] H. O. Scheck, J. Louhi, Energy Efficiency of Cellular Networks, W-GREEN 2008, Lapland, Finland, September 2008.
[8] Global Action Plan, An inefficient truth, http://www.globalactionplan.org.uk/, Global Action Plan Rep., 2007. [9] M. Hodes,Energy and power conversion: A telecommunication hardware
vendor’s perspective, http://www.peig.ie/pdfs/ALCATE˜1.PPT, Power
Electronics Industry Group, 2007.
[10] Bi-annual Report November 2010, Green Power for Mobile, GSMA.
[11] H. Claussen, L. T. W Ho, and F. Pivit,Effects of joint macrocell and
residential picocell deployment on the network energy efficiency, IEEE
19th International Symposium on Personal, Indoor and Mobile Radio Communications (PIMRC), 2008, Cannes, France, September 2008. [12] Z. Niu, Y. Wu, J. Gong, Z. Yang,Cell zooming for cost-efficient green
cellular networks, IEEE Communication Magazine, Vol. 48, n. 11, pp.
74-79, November 2010.
[13] L. Chiaraviglio, D. Ciullo, M. Meo, M. Ajmone Marsan,Energy-Aware
UMTS Access Networks, W-GREEN 2008, Lapland, Finland, September
2008.
[14] M. Ajmone Marsan, L. Chiaraviglio, D. Ciullo, M. Meo,Optimal Energy
Savings in Cellular Access Networks, GreenComm’09 - 1st International
Workshop on Green Communications, Dresden, Germany, June 2009. [15] M. Ajmone Marsan, L. Chiaraviglio, D. Ciullo, M. Meo,
Energy-Efficient Management of UMTS Access Networks, ITC 21 - 21st
Interna-tional Teletraffic Congress, Paris, France, September 2009.
[16] E. Oh, B. Krishnamachari, X. Liu, Z. Niu,Toward dynamic energy
effi-cient operation of cellular network infrastructure, IEEE Communication
magazine, Vol. 49, n. 6, pp. 56-61, June 2011.
[17] K. Son, H. Kim, Y. Yi and B. Krishnamachari,Base Station Operation and User Association Mechanisms for Energy-Delay Tradeoffs in Green
Cellular Networks, IEEE Journal on Selected Area in Communications:
Special Issue on Energy-Efficient Wireless Communications, 2011 (to appear).
[18] C. Peng, S. B. Lee, S. Lu, H. Luo, H. Li,Traffic-Driven Power Saving
in Operational 3G Cellular Networks, ACM MobiCom 2011, Las Vegas,
Nevada, USA, September 2011.
[19] Normalized cellular traffic trace during one week, data available at:
http://anrg.usc.edu/www/index.php/Downloads.
[20] G. Auer, V. Giannini, I. Godor, P. Skillermark, M. Olsson, M. A. Imran, D. Sabella, M. J. Gonzalez., C. Desset,O. Blume, Cellular Energy
Efficiency Evaluation Framework, GreeNet workshop, in proc. of VTC
Spring 2011.
[21] S. Fortune et al.,WiSE Design of Indoor Wireless Systems: Practical
Computation and Optimization, IEEE Computational Science &
Engi-neering, vol. 2, no. 1, pp. 58-68, spring 1995.
[22] M. Ajmone Marsan, L. Chiaraviglio, D. Ciullo, M. Meo, Switch-Off
Transients in Cellular Access Networks with Sleep Modes, GreenComm