FINAL REPORT
Horticultural Research and Development Corporation
and
Queensland Fruit and Vegetable Growers Association
PROJECT TITLE:
I I
1.
2.
3.
4.
HORTICULTURAL RESEARCH AND DEVELOPMENT CORPORATION
AND
QUEENSLAND FRUIT AND VEGETABLE GROWERS ASSOCIATION
Project Title:
Reference No.:
Organisation: Postal Address:
Project Chief Investigator:
Commencement Date: Completion Date:
The development of technology to adapt and maximise the drip irrigation system
VG015
Queensland Department of Primary Industries GPO Box 46, Brisbane Q 4001
J.A. Barnes
1 July 1990 30 June 1993
5. Summary.
TECHNICAL REPORT
The development of technology to adapt and maximise the drip irrigation system
Introduction
Trickle irrigation has found rapid acceptance in fresh market tomato production. Tomatoes have shown a marked sensitivity to water stress, with irrigation increasing yields substantially. Trickle irrigation increased tomato yield when compared to sprinkler and/or furrow irrigation. It has also been effective in reducing total water requirements for tomatoes.
Although increased amount of water increase tomato yield, the important quality factors of total soluble solids and acidity, particularly for processing tomatoes, were found to be inversely related to yield increases from irrigation. While there are a number of components affecting tomato flavour, total soluble solids and acidity are two important aspects to consider. Fruit with high total soluble solids are reported to have better flavour.
There has been considerable adverse publicity regarding tomato fruit quality, including flavour, in recent years. Breeding tomatoes with improved flavour is one approach which is being p'ursued. However, trickle irrigation offers the opportunity for careful management of water application with the potential for maximising the production of good quality fruit. There is also the possibility of improving tomato flavour with manipulation of water application, particularly late in the crop. Some earlier research in Australia with processing tomatoes suggested that reducing irrigation rates to 75% of evapotranspiration from fruit-fill may achieve higher solubl~ solids with minimal yield loss while further reductions to 500); of evapotranspiration may result in significant losses in productivity.
Our studies were designed to investigate the effects of different irrigation regimes under the trickle irrigation, plastic mulch production system on fresh market tomato yield and fruit quality. Of particular interest was the effect of water restrictions late in the crop on the levels of total soluble solids.
Materials and methods
Site
Experiments were conducted at Bundaberg Research Station, Queensland during 1990 to 1992 on a prepared euchrozen soil.
Experimental designs
Four experiments were conducted as follows: Experiment 1 Spring-Summer season 1990 Experiment 2 Spring-Summer season 1991 Experiment 3 Autumn-Winter season 1992 Experiment 4 Spring-Summer season 1992
In each experiment there were 12 treatments consisting of early and late irrigation treatments.
Treatment schedule
Early treatments. From flowering until 2 weeks prior to first harvest, 3 treatments were applied over the 12 plots as follows:
Experiment 1: T1 = 0.50 Epan x Crop factor (0.50 ET) T2 = 0.75 Epan x Crop factor (0.75 ET) T3 = 1.00 Epan x Crop factor (1.00 ET)
Experiments 2, 3, and 4:
T1 = 0.25 Epan x Crop factor (0.25 ET) T2 = 0.50 Epan x Crop factor (0.50 ET) T3 = 1.00 Epan x Crop factor (1.00 ET)
Late treatments. From 2 weeks prior to first harvest until fmal harvest, 4 further treatments were applied to each of the 3 early treatments as follows:
Treatment No. 1 2 3 4 5 6
T4 = 0.25 Epan (0.25 ET) T5 = 0.50 Epan (0.50 ET) T6 = 0.75 Epan (0.75 ET) T7 = 1.00 Epan (1.00 ET)
Treatment Treatment No.
T1 T4 7
T1 T5 8
T1 T6 9
T1 T7 10
T2 T4 11
T2 T5 12
Treatment
T2 T6
T2 T7 T3 T4 T3 T5 T3 T6 T3 T7
Treatments T1, T2 and T3 were modified by a crop factor to allow for plant size. The crop factor at flowering (4 weeks old) was 0.5. The crop factor was.·increased by 0.1 each week as the crop developed until a maximum of 1.0 was reached (9 weeks old).
The 12 treatments were randomised within a complete block and each block was replicated 4 times. Plots consisted of 3 rows, each 10 m long. The middle row was the datum row with the row either side being a buffer row. Each datum · row had a 3 m buffer area at each end to avoid competition effects due to the different irrigation treatment of the next plot. Plants were spaced 0.5 m apart. The harvested (datum) area of each plot was 4 m (8 plants). All plots had individual feeder lines closed by taps so that each plot could be isolated from each of the other plots for ease of application
of
the differing irrigation treatments.Cultural practices
spaced 300 mm apart was located under the mulch 75 mm to the side of each plant row.
During the bed-shaping operation, a complete NPK (4.2 : 5.7 : 6.7) fertiliser (1280 kg/ha) was incorporated in the bed with a rotavator attachment on the bed shaper. At the same time, a granular formulation of fenamiphos (Nemacur 100g, 100 g a.i/kg) for root-knot nematode
(Meloidogyne spp.) control was incorporated over a 600 mm-wide strip of the bed at 13.3 g/m2. Petiole samples of the most recent fully expanded leaf were taken weekly and the sap analysed for nitrate-N and potassium concentrations using Merkoquant test strips. Soluble nitrogen and potassium fertiliser was injected into the irrigation water as required according to the sap tests. Normal management for disease and pest control was carried out.
The crop received normal irrigation following field planting and during the establishment phase. Treatments commenced at flowering ( 4 weeks after field planting). Treatments were applied on Monday, Wednesday and Friday of each week and were based on evaporation since the previous irrigation. A C_lass A pan provided the evaporation data. In a number of instances rain interfered with proposed treatments. Where possible, adjustments of applied irrigation were made to counteract rainfall. However, this was not always possible and some treatment effects were lost.
Measurements
The crops were harvested twice weekly. Plot yield and fruit number were measured. All fruit were assessed for size and blemish. Around mid-harvest a sample of 15 fruit per plot was selected for quality assessment. Fruit were harvested at breaker stage (USDA 2) and held at 20° for 6
2
days (USDA 6). The sample was then snap frozen and held for chemical determination of quality parameters (total soluble solids, pH, titratable acidity and conductivity) at a later date.
Statistical analysis
Data were subjected to an analysis of variance. The protected l.s.d. procedure was used for the comparison of means at P = 0.05.
Results
Water application
Tables 1 to 4 show for each of the main treatments the amount of irrigation water applied, rainfall received, total amount of water received as well as the planned water application for each of the 4 experiments. Experiment 1 (Table 1) was the only experiment that did not receive any rain during the life of the experiment and treatments could be applied as planned and without adjustments for rain. In experiment 2 (Table 2) heavy rainfall during the late stage treatments and in experiment 3 (Table 3) heavy rainfall during the early stage treatments negated any planned treatment effects. Allowances for rainfall during the other stage in these 2 experiments could be made by adjusting the rate of irrigation such that, in most cases, the amount of water received approached the planned water application. This could also be done for the early stage treatments in experiment 4 (Table 4). However, rainfall during the late treatment stage of this experiment. could not be adjusted for fully and treatments received more water than was planned.
Table 1. Experiment 1: Evaporation- early treatment stage 221.6 mm -late treatment stage 290.7 mm
Treatment Treatment Water applied Rainfall Water Planned water
stage (rom) (rom) received (mm) application (mm)
Early 0.50 ET 74.4 0 74.4 74.4
treatments 0.75ET 111.6 0 111.6 111.6
1.00 ET 148.8 0 148.8 148.8
0.25 ET 71.4 0 71.4 71.4
Late 0.50 ET 142.9 0 142.9 142.9
treatments 0.75 ET 214.3 0 214.3 214.3
3
Table 2. Experiment 2: Evaporation - early treatment stage 218.4 mm - late treatment stage 268.0 mm
Treatment Treatment Water applied Rainfall Water Planned water
stage (mm) (mm) received (mm) application (mm)
Early 0.25 ET 32.3 45.8 78.1 38.0
treatments 0.50 ET 64.5 45.8 110.3 76.0
1.00 ET 135.6 45.8 181.4 152.0
0.25 ET 22.6 251.8 274.4 66.5
Late 0.50 ET 45.3 251.8 297.1 132.9
treatments 0.75 ET 72.0 251.8 323.8 199.4
1.00 ET 98.7 251.8 350.5 265.9
Table 3. Experiment 3: Evaporation- early treatment stage 205.7 mm - late treatment stage 125.5 mm
Treatment Treatment Water applied Rainfall Water Planned water stage (mm) (nun) received (mm) application (mm)
Early 0.25 ET 10.5 218.4 228.9 43.2
treatments . 0.50 ET 23.3 218.4 241.7 86.5
1.00 ET 91.0 218.4 309.4 173.0
0.25 ET 10.4 48.6 59.0 31.4
Late 0.50 ET 30.5 48.6 79.1 62.8
treatments 0.75 ET 58.1 48.6 106.7 94.1
1.00 ET 77.4 48.6 126.0 125.5
Table 4. Experiment 4: Evaporation - early treatment stage 223.3 mm - late treatment stage 260.1 mm
Treatment Treatment Water applied
stage (nun)
Early 0.25 ET 36.9
treatments 0.50 ET 73.9 1.00 ET 147.7 0.25 ET 28.8
Late 0.50 ET 57.7
treatments 0.75 ET 99.7 1.00 ET 146.6
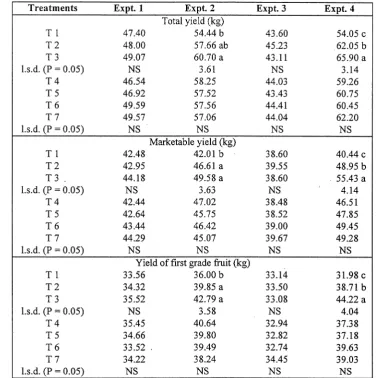
Total yield, marketable yield, yield of first grade fruit
The late stage treatments did not cause significant (P>0.05) differences for either total yield, marketable yield or yield of first grade fruit in any of the 4 experiments (Table 5). In experiment 2, treatment T3 was significantly (P<0.05) greater than Tl for total yield, marketable yield and yield of first grade fruit. Treatment T3 was significantly (P<0.05) greater than both Tl and T2 for the same parameters, in experiment 4 (Table 5). Again for the same parameters for experiment 4, treatment T2 was significantly (P<0.05) greater than Tl.
Percentage first grade fruit, percentage marketable yield
Experiment 4 was the only instance where early irrigation treatments affected percentage first grade fruit.
Rainfall Water Planned water (mm) received (mm) application (mm)
21.4 58.3 41.0
21.4 95.3 82.0
21.4 169.1 164.0
154.2 183.0 65.0
154.2 211.9 130.0
154.2 253.9 195.0
154.2 300.8 260.0
4
Table 5. Total yield, marketable yield and yield of first grade fruit of ,main treatment effects of experiments 1, 2, 3 and 4.
Means within columns followed by a common letter are not significantly different at P = 0.05. NS = F test not significant.
Treatments Expt. 1 Expt. 2 Expt. 3 Expt. 4
Total yield (kg)
T 1 47.40 54.44 b 43.60 54.05 c
T2 48.00 57.66 ab 45.23 62.05 b
T3 49.07 60.70 a 43.11 65.90 a
l.s.d. (P
=
0.05) NS 3.61 NS 3.14T4 46.54 58.25 44.03 59.26
T5 46.92 57.52 43.43 60.75
T6 49.59 57.56 44.41 60.45
T7 49.57 57.06 44.04 62.20
l.s.d. (P
=
0.05) NS NS NS NSMarketable yield (kg)
T 1 42.48 42.01 b 38.60 40.44 c
T2 42.95 46.61 a 39.55 48.95 b
T 3 . 44.18 49.58 a 38.60 . 55.43 a
l.s.d. (P
=
0.05) NS 3.63 NS 4.14T4 42.44 47.02 38.48 46.51
T5 42.64 45.75 38.52 47.85
T6 43.44 46.42 39.00 49.45
T7 44.29 45.07 39.67 49.28
l.s.d. (P
=
0.05) NS NS NS NSYield of first grade fruit (kg)
T1 33.56
T2 34.32
T3 35.52
l.s.d. (P
=
0.05) NST4 35.45
T5 34.66
T6 33.52
T7 34.22
l.s.d. (P
=
0.05) NSNumber of fruit, average fruit weight
In experiment 4,. number of fruit in treatment T3 was significantly (P<0.05) greater than T1 or T2. T2 was significantly (P<0.05) greater than T1 (Table 7). This was the only case over the 4 experiments where there were any significant differences in fruit number as a result of the differing treatments. Average fruit weight did not show big differences due to irrigation treatments (Table 7).
Percentage small, percentage medium, percentage large, percentage extra-large fruit
There were some differences in percentage of the various fruit sizes, particularly in the medium and large sizes, as a result of irrigation treatments (Table 8). In experiment 4 for the early irrigation treatments, T1 had a
36.00 b 33.14 31.98 c
39.85 a 33.50 38.71 b
42.79 a 33.08 44.22 a
3.58 NS 4.04
40.64 32.94 37.38
39.80 32.82 37.18
39.49 32.74 39.63
38.24 34.45 39.03
NS NS NS
5
Table 6. Percentage first grade fruit and percentage marketable yield of main treatment effects of experiments 1, 2, 3 and 4.
Means within columns followed by a common letter are not significantly different at P = 0.05.
NS
=
F test not significant.Treatments Expt. 1 Expt. 2 Expt. 3 Expt. 4
Percentage first grade fruit
T1 70.83 66.10 76.04 58.59 b
T2 71.58 69.17 74.17 62.24 b
T3 72.29 70.43 76.85 67.24 a
l.s.d. (P = 0.05) NS NS NS 4.97
T4 76.05 a 69.51 74.87 b 61.99
T5 73.92 ab 69.00 75.81 ab 60.95
T6 67.63 c 68.64 73.73 b 65.29
T7 68.66 be 67.13 78.35 a 62.54
l.s.d. (P = 0.05) 5.36 NS 2.70 NS
Percentage marketable yield
T1 89.63 77.07 b 88.56 ab 74.11 c
T2 89.45 80.87 a 87.49 b 78.72 b
T3 89.91 81.66 a 89.57 a 84.17 a
l.s.d. (P = 0.05) NS 3.46 1.54 3.88
T4 91.07 80.56 87.45 b 77.39
T5 90.88 79.13 88.81 ab 78.25
T6 87.62 80.68 87.82 b 81.48
T7 89.10 79.10 90.08 a 78.88
l.s.d. (P = 0.05) NS NS 1.78 NS
Table 7. Number of fruit and average fruit weight of main treatment effects of experiments 1, 2, 3 and 4.
Means within columns followed by a common letter are not significantly different at P
=
0.05. NS=
F test not significant.Treatments Expt.l Expt. 2 Expt. 3 Expt. 4
Number of fruit
T1 249 376 369 400 c
T2 249 388 386 447 b
T3 254 407 372 477 a
l.s.d. (P = 0.05) NS NS NS 26
T4 254 403 377 447
T5 242 390 372 441
T6 253 383 378 438
T7 255 386 376 438
l.s.d. (P = 0.05) NS NS NS NS
Average fruit weight (gm)
T1 191 145 b 118 135
T2 193 149 a " 117 139
T3 193 149 a 116 138
l.s.d. (P = 0.05) NS 3.6 NS NS
T4 184 b 145 117 132b
T5 195 a 147 117 138 a
T6 196 a 150 117 138 a
T7 195 a 148 117 142 a
6
Table 8. Percentage small A, percentage medium A, percentage large A and percentage extra large A
fruit of main treatment effects of experiments 1, 2, 3 and 4.
Means within columns followed by a common letter are not significantly different at P = 0.05.
Treatments
T1 T2 T3 l.s.d. (P = 0.05)
T4 T5 T6 T7 l.s.d. (P = 0.05)
T1 T2 T3 l.s.d. (P = 0.05)
T4 T5 T6 T7 l.s.d. (P = 0.05)
T1 T2 T3 l.s.d. (P = 0.05)
T4 T5 T6 T7 l.s.d. (P = 0.05)
T1 T2 T3 l.s.d. (P = 0.05)
T4 T5 T6 T7 l.s.d. (P = 0.05)
NS = F test not significant.
A small= 50 to 60 mm diameter; medium= 60 to 75 mm diameter.
large= 75 to 80 mm diameter; extra large=> 80 mm diameter.
Expt.l Expt. 2 Expt. 3
Percentage small fruit (50 to 60 mm)
2.34 11.19 25.24
2.50 9.43 25.28
2.26 10.24 25.91
NS NS NS
3.42 a 10.66 25.66
1.89 b 10.57 25.24
2.13 b 9.72 25.73
2.01 b 10.21 25.29
0.73 NS NS
Percentage medium fruit (60 to 75 mm)
34.24 49.20 50.73
31.59 47.26 50.66
31.40 46.07 51.21
NS NS NS
38.80 a 50.86 a 50.53
31.28 b 46.46 b 51.29
28.77b 45.95 b 50.56
30.79 b . 46.76b 51.09
4.72 3.00 NS
Percentage large fruit (75 to 80 mm)
40.97 30.53 14.99
41.31 32.55 16.23
41.95 32.62 14.75
NS NS NS
38.27 b 28.92 b 14.72
42.84 a 32.79 a 15.14
43.16 a 33.71 a 15.16
41.37 a 32.18 a 16.28
2.99 2.90 NS
Percentage extra large fruit (> 80 mm)
22.46 8.01 3.79
24.56 9.80 2.93
24.38 10.19 2.72
NS NS NS
19.48 b 8.52 3.65
23.99 ab 9.29 3.13
25.92 a 9.72 3.24
25.81 a 9.89 2.55
4.64 NS
"
NSExpt. 4 15.92 14.53 15.08 NS 17.60 a 14.96 ab 15.25 ab 12.89 b 2.98
56.81 a 53.62 b 51.90 b 2.50 56.98 a 53.66 b 53.31 b 52.49 b 2.89 21.49 b 24.58 ab 25.91 a
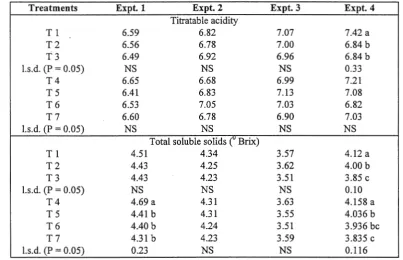
Titratable acidity
The only significant differences for titratable acidity occurred in the early treatments in experiment 4 where T1 was significantly (P<O.OS) greater than T2 or T3 which were not significantly different from each other (Table 9). The late irrigation treatments did not cause differences in any of the 4 experiments.
Total soluble solids
For total soluble solids the only significant differences in the early irrigation treatments also occurred in experiment 4.
7
Treatment T1 was significantly (P<O.OS) greater than T2 which in tum was significantly (P<O.OS) greater than T3 (Table 9). The late irrigation treatments- c-aused significant differences in experiments 1 and 4. In these experiments, T4 was significantly (P<O.OS) greater than the other 3 treatments (Table 9).
Table 9. Titratable acidity and total soluble solids (0 Brix) of main treatment effects of experiments
1, 2, 3 and 4.
Means within columns followed by a common letter are not significantly different at P = 0.05. NS = F test not significant.
Treatments Expt.l Expt. 2 Expt. 3 Expt. 4
Titratable acidity
T1 6.59 6.82 7.07 7.42 a
T2 6.56 6.78 7.00 6.84 b
T3 6.49 6.92 6.96 6.84 b
l.s.d. (P = 0.05) NS NS NS 0.33
T4 6.65 6.68 6.99 7.21
TS 6.41 6.83 7.13 7.08
T6 6.53 7.05 7.03 6.82
T7 6.60 6.78 6.90 7.03
l.s.d. (P = 0.05) NS NS NS NS
Total soluble solids
C
Brix)T1 4.51
T2 4.43
T3 4.43
l.s.d. (P = 0.05) NS
T4 4.69 a
T5 4.41b
T6 4.40b
T7 4.31 b
l.s.d. (P = 0.05) 0.23
Interactions
For the 4 experiments, there were very few significant differences in the interactions between the early and late irrigation treatments for any of the parameters measured and, therefore, no results have been presented.
Discussion
This study highlighted the problems associated with irrigation experiments, particularly when there is no control over natural irrigation i.e. rain. Of the 4 experiments, only experiment 1 did not receive any rainfall during the life of the crop.
Total yield, marketable yield, yield of first grade fruit.
For the early irrigation treatments, yield of the above 3 parameters was reduced below 1.0 ET (100% ET) in
4.34 3.57 4.12 a
4.25 3.62 4.00b
4.23 3.51 3.85 c
NS NS 0.10
4.31 3.63 4.158 a
4.31 3.55 4.036b
4.24 3.51 3.936 be
4.23 NS
3.59 3.835 c
NS 0.116
experiment 4 and below 0.50 ET (50% ET} in experiment 2. There was no response to early irrigation in experiment 1 -but in this case the lowest early treatment was 50% ET. Heavy rainfall negated the early treatments in experiment 3 and this would explain the lack of response to these treatments in this experiment.
effect on yield parameters could be expected to be minimal as was shown in experiments 1 and 3.
Percentage first grade fruit, percentage marketable yield
In experiment 4, 100% ET in the early treatments resulted in the highest percentage first grade fruit and the highest percentage marketable yield. This same treatment tended to give the highest percentage marketable yield for experiments 2 and 3. The result for late irrigation treatments with these 2 parameters was inconclusive.
Number of fruit, average fruit weight
The increased yield as a result of the early 100% ET treatment in experiment 4 was due to an increased number of fruit and not average fruit weight which was unaffected by the early irrigation treatments. Reduced average fruit weight occurred in the early 25% ET treatment in experiment 2 and in the late 25% ET treatment in experiments 1 and 4
Percentage small, percentage _medium, percentage large, percentage extra large fruit.
Only in experiment 4 did the reduced early stage irrigation applications affect percentage of the different fruit sizes with the 25% ET treatment resulting in a greater percentage of medium and a smaller percentage of large fruit. The late 25% ET irrigation treatment had a more pronounced effect on the above parameters over most of the experiments. A greater percentage of small · and medium sizes and a corresponding lower percentage of the large and extra large sizes occurred in this treatment in experiments 1, 2 and 4. No differences occurred in experiment 3 which had received heavy rainfall during the early stages of the experiment. The 50% ET, 75% ET and 100% ET late stage treatments did not affect fruit size distribution.
Titratable acidity, total soluble solids
The effect of reduced water application on these 2 parameters was minimal. Total soluble solids (0 Brix) of
fruit increased slightly in experiments 1 and 4 as less irrigation water was applied. Titratable acidity was increased under the 25% ET early stage irrigation regime in experiment 4. In all other cases there were no differences as irrigation was varied.
Conclusion
The results of this study varied with the different experiments. Trends were not consistent between experiments even though the same treatments were applied each time. Rainfall which was quite heavy at different times throughout the study obviously had a big impact on the results. The conclusions from this study have been drawn from a combination of the four experiments. Some results have been ignored in an attempt to come to a conclusive result.
Considering the early treatment stage from flowering until 2 weeks prior to harvest, restrictions to irrigation below 100% ET caused losses in total yield, marketable yield and
8
yield of first grade fruit. The I 00% ET treatment resulted in the highest percentage first grade fruit and highest percentage marketable fruit.
The late irrigation treatments from 2 weeks prior to harvest and through the harvest period had little effect. The 25% ET treatment reduced average fruit weight and this was reflected in the percentages of the different fruit sizes. A greater percentage of small and medium sized fruit and a corresponding lower percentage of large and extra large fruit occurred in this treatment. For the late stage irrigation treatments, there was no advantage to increasing irrigation above 50% ET.