Procedia Engineering 119 ( 2015 ) 761 – 770
1877-7058 © 2015 Published by Elsevier Ltd. This is an open access article under the CC BY-NC-ND license (http://creativecommons.org/licenses/by-nc-nd/4.0/).
Peer-review under responsibility of the Scientific Committee of CCWI 2015
doi: 10.1016/j.proeng.2015.08.930
ScienceDirect
13th Computer Control for Water Industry Conference, CCWI 2015
Simulation and conservation of the end use water based on
behaviour intervention modelling
Yang Fu
a, Wenyan Wu
a* ,Jinliang Gao
b aStaffordshire University, College Road, Stoke-on-Trent ST4 2DE, United KingdombHarbin Institute of Technology, Huanghe Road, Harbin 150090, P.R.China
Abstract
There is now substantial literature describing the importance of end use water saving. From the management perspective, it is reasonable to investigate how consumers use water and their water use behaviours. The TPB behaviour intervention theory with extended parameters for water end use was computerized by applying the water flowing concept and SEM (Structural Equation Model). This TPB mathematical expression model (dynamic behaviour change model) integrated with ANNs (Artificial Neutral Networks) is also been proposed to investigate the behaviour intervention. The significance of findings about behaviour intervention modelling in water end use areas and its applications are discussed.
© 2015 The Authors. Published by Elsevier Ltd.
Peer-review under responsibility of the Scientific Committee of CCWI 2015.
Keywords: Water end use; Behaviour change; Behaviour intervention modelling; TPB; ANN
1.Introduction
By concerned climate change and the increase of human population, the resource of drinking water is considered as a precious part of the nature which needs to be conserved and effective used. For the household water consumption, it takes a considerable amount (representing over 65%) of the total water consumption in the most cities of China (including industrial consumption etc.) [1]. These situations decide that water conservation and
* Corresponding author. Tel.: +44-784-537-6216.
E-mail address: [email protected]
© 2015 Published by Elsevier Ltd. This is an open access article under the CC BY-NC-ND license (http://creativecommons.org/licenses/by-nc-nd/4.0/).
management at the household level should be regard as an increasingly important issue for urban utilities and governments [2].
This paper proposed the solution for better understanding household water use behaviour intervention based on the behaviour intervention modelling in the water end use areas. And this solution can be applied to supervise the behaviour change project for water, even energy or the other purposes. In this study, for the main model of end use water to understand behaviour intervention, ANNs (Artificial Neutral Networks) has been chosen as the simulation mathematical foundation of the model. Also, ETPB (Extended Theory of Planned Behaviour) expressed by SEM (Structural Equation Model) is integrated as a part of the water end use ANN model to study the process of behaviour change by using water flowing analogy. The water flow analogy was introduced to simulate for understanding the interaction and reaction between different parameters of behaviour change in the TPB model.
This water end use study incorporated two questionnaires which were administered by a long time observation. The “behaviour” questionnaire includes both behaviour intervention modelling data and social-psychological data. These data were administered by the respondents monthly from January 2013. At the beginning of the summer in 2013, the respondents were asked to complete a “household” questionnaire about the social-demographic parameters and the clearance for the water use data which was used to employ the twelve months water use data from the water utility. All these parameters along with data were trained in the ANNs integrated water end use model including latent variables in the SEM to predict the water consumption. In broad terms it was hypothesized that the more positive behaviour change strategies towards the household water use, the greater conservation of water and reduction of water consumption.
2.Background
Tradition solutions for the end use water saving problems are the engineering control and management strategies. Specifically, engineering methods conserve water by upgrading the network, adjusting and optimization the water use pattern [3, 4]. It cannot be denied that water conservation in community or city level from engineering perspective could make a different. However, the engineering solutions paid fewer attentions to the household water saving projects and cannot effectively change or improve the users’ water saving behaviour. Water management strategies gain success for end use water saving in the past few years especially those projects designed on the foundation of behaviour change mechanic or investigation [4]. A lot of countries (likes Australian, New Zealand etc.) have encouraged consumers to take a role in water or the other natural resource saving [5], and it has been proved that the application of behaviour change methods could help to reduce significant amounts of water in the house [6].
The behaviour change science is a goal for target people or community changed with a design and implement programs (‘interventionists’) that produce a desired behavioral [7]. Current behaviour change methods, including the modelling of behaviour and theories of change, could be sorted into four types of evidences to help to understand human behaviour effectively: models of behaviour at individual level; models of behaviour at higher scale level; theories of change; developed models or frameworks. For the end use water nature, researches have been done to change users’ behaviour or specific water relevant behaviors [8]. Specifically, the behaviour science can be used to understand users’ attitude and reactions towards different intervention of water business like billing change. Technically, in the water use field, researches on behaviour change are mainly developed on the development of BCM (behaviour change model) level and application of BCM level [4]. The definition for the development of BCM is investigated to specify BCM framework for water use Applications of the BCM researches mainly are focused on the mature theory of BCM for water use likes “water is money” concept by Australia States and Territories in 1996 [9].
without considering the significance and understanding of behaviour intervention process. The model proposed in this paper is provides a better modelling solution for understand the process of behaviour change and the linkage to water end use consumption.
3.Methodology
3.1.Sampling
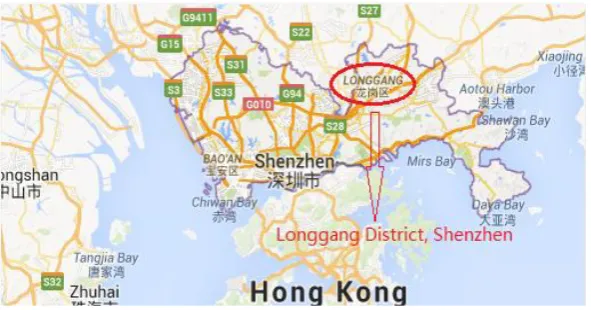
The targeted community, which named as Crape Myrtle Garden, sampled in this study is located in the town center of Longgang District, Shenzhen, China. It is a typical Chinese urban mature community with 1480 households and all the buildings are designed as seven floors apartment. Figure 1 displays the Location of sampled area.
Fig. 1. Location of research area
Out of 200 apartment households sampled in this study in Shenzhen, China in 2013, only 128 apartments which had the monthly water consumption and sent back the fulfilled questionnaire to us. The questionnaire recycle rate for this research is 64%. Nine samples have been eliminated after been known collected from short time or unstable living condition residents in the sampling year. The basic information for sampling is shown in figure 2.
3.2.Questionnaire content
The questionnaire in this research contains three parts: the first part is the ethic content form for using data, the second part for the TPB questions and the third part is designed to collect residential information. In the TPB question part, it is proposed by using seven points Likert scale form and answer setting from “1” (means strongly disagree/dislike) to “7” (means strongly agree/like). As for the water monthly data, it was provided by Shenzhen
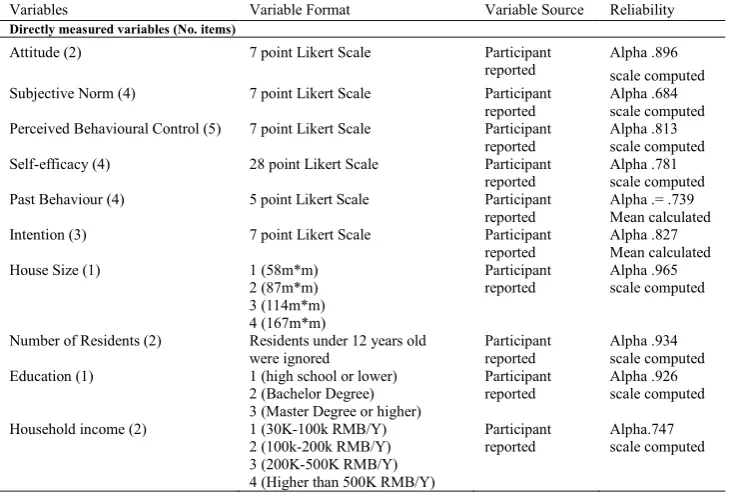
Longgang Water Group Co., Ltd. (Water Utilities). The design of questionnaire was based on the standard TPB questionnaire and contains questions covering attitudes, intentions, former behaviour, moral norms, descriptive norms, self-efficacy variables and outside influences. All the questions in the questionnaire have been filtered according to the results of Cara Beal’s discussion [10] about general characteristics. Table 1 shows the questionnaire contents and reliability test results of this study.
3.3.Data Analysis
scale in the questionnaire was tested by Cronbach’s alpha [6]. The Cronbach’s alpha is applied as a lower bound
estimate for psychometric coefficient of reliability test.
Fig. 2. Basic information of sampling
Table 1. Questionnaire contents and reliability test result
Variables Variable Format Variable Source Reliability
Directly measured variables (No. items)
Attitude (2) 7 point Likert Scale Participant
reported Alpha .896 scale computed Subjective Norm (4) 7 point Likert Scale Participant
reported Alpha .684 scale computed Perceived Behavioural Control (5) 7 point Likert Scale Participant
reported
Alpha .813 scale computed Self-efficacy (4) 28 point Likert Scale Participant
reported Alpha .781 scale computed Past Behaviour (4) 5 point Likert Scale Participant
reported
Alpha .= .739 Mean calculated Intention (3) 7 point Likert Scale Participant
reported Alpha .827 Mean calculated House Size (1) 1 (58m*m)
2 (87m*m) 3 (114m*m) 4 (167m*m)
Participant reported
Alpha .965 scale computed
Number of Residents (2) Residents under 12 years old were ignored
Participant reported
Alpha .934 scale computed Education (1) 1 (high school or lower)
2 (Bachelor Degree) 3 (Master Degree or higher)
Participant
reported Alpha .926 scale computed
Household income (2) 1 (30K-100k RMB/Y) 2 (100k-200k RMB/Y) 3 (200K-500K RMB/Y) 4 (Higher than 500K RMB/Y)
Participant
reported Alpha.747 scale computed
22%
29% 30%
16% 3%
Age
<25
25-35
36-45
46-55
>55
51% 49%
Gender
Male
Female
8%
55% 27%
10%
Number of Resident
<3
3
4
>=5
10%
27% 52%
11%
Education
Primary School
High School
Undergraduate
For the validity and factor analysis, the KMO (Kaiser-Meyer-Olkin) and Bartlett’s Test of Sphericity [11], a measure of sampling adequacy to check the case to variable ratio for the analysis, is being conducted. This method could test whether the correlation matrix is an identity matrix and show the validity and suitability of the responses collected to the water saving issue in this research. The entire validity test is done by SPSS software. The result displays that the mean KOM value is bigger than 0.7, therefore, all the parameters in the questionnaire are suitable for factor analysis.
4.ETPB-ANN Model
4.1.Architecture
This dynamic ETPB-ANN model contains the behavioural intervention simulation model and the end use ANN model. It considered the importance of system variables respond to interactions between input parameters overtime. In the behavioural intervention model, intervention acts toward end use were measured and inputted to TPB mathematic expression (SEM). At the same time, with the objective parameters and water use data, ANNs based end use model can output the results of the water consumption. Figure 3 shows the general conceptual diagram for the intelligent integrated philosophy of household water use model.
Behavioral Change
Model (ETPB)
Attitude
ˈ
Subjective norm
Perceived behavioral control
...
Social-economic Variables Social-demographic
Variables (eg. Education; Family Members;
House size; Income Level etc. )
. . .
ANNs based Water End-use Model
˄
Trained with water use data
˅
Intervention acts upon
Subjective Variables
Objective Variables
Household Water End-use Consumption Results
Fig. 3. General diagram of the integrated model for household water end-use consumption change
4.2.Expanded Theory of Planned Behaviour (ETPB)
predictors of household water use [13]. In addition to the input parameters of TPB, the measures of past behaviour and self-efficacy also play roles in the processing of behaviour interventions [14, 15].
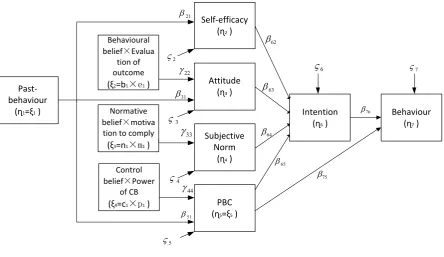
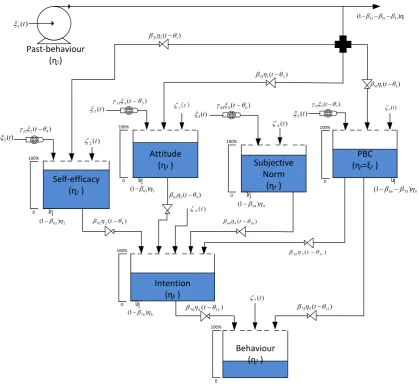
The relationship between parameters and behaviour change mechanic was investigated using a Structural Equation Model with latent variables. SEM is widely used in psychology and other social sciences, although its properties are not clear when the model structure is complicated [16, 17, 18, 19]. The ETPB path analysis model is shown in Figure 4. In order to explain the dynamic change details of human behaviour, we propose the use of a fluid analogy to express the process of behaviour intervention which was shown in Figure 5.
Past-behaviour
(ɳ1=ξ1 )
Self-efficacy (ɳ2 )
Attitude (ɳ3 )
Subjective Norm
(ɳ4 )
PBC (ɳ5=ξ5 )
Intention (ɳ6 )
Behaviour (ɳ7 )
Behavioural beliefhEvalua
tion of outcome
(ξ2=b1hH1 )
Normative beliefhmotiva
tion to comply
(ξ3=n1hP1 )
Control beliefhPower
of CB
(ξ4=c1hS1 )
22 J 21 E 31 E 33
J
44 J 51 E 2 9 3 9 4 9 5 9 69 97
62 E 63 E 64 E 65 E 75 E 76 E
Fig. 4. ETPB path diagram with five exogenous variables[i, seven endogenous variablesKi, regression weights Eij,Jij and disturbance]i
Where,KW [W ,[W EW uHW ,[W QW uPW , [W FW uSW ,KW [W ,TL is time delay and WL
is constants to capture the capacity of each tack. And in this study, we assumed that there is no reverse response in tanks and the fluid flowing process.
The structure of ANN model in this study is the multiple-layer networks. This multi-layer networks consist of an input layer of value consisting of house size (HS), number of resident (NOR), month (M), education level (EL), income level (IL) and behaviour value (BV), two hidden layers of perceptron and an output lay for outputting the Water Consumption Data (WCD with a unit of Ton/month). The ETPB-ANN model is trained with the initial behavior change data through questionnaires at January 2013, the whole year water consumption data and four subjective parameters to exam the model.
4.3.Evaluation
In this study, prediction error is evaluated in two aspects: gap (error) assessment for both original data (training data) and prediction data (testing data). The gap assessments for this model can exanimate the ability for reorganization and reproduction of the original data set. Root-mean-square and 5
Self-efficacy (ɳ2 )
Attitude
(ɳ3 ) Subjective
Norm (ɳ4 )
Intention (ɳ6 )
Behaviour (ɳ7 ) 100% 0 100% 0 100% 0 100% 0 100% 0 Past-behaviour (ɳ1)
100%
0
PBC (ɳ5=ξ5 )
2 62)
1 (E K
3 63)
1 (E K
4 64)
1 ( E K
5 75 65 ) 1
( E E K
) ( 1 1 21K T
E t 1 51 31 21 ) 1
(E E E K
) ( 2 1 31K T
E t
) ( 3 1 51K T
E t
) ( 4 2 22[ T
J t
) ( 5 3 33[ T
J t ( )
6 4 44[ T
J t J55[5(tT7)
) ( 2t ] ) ( 6t ] W ] ) ( 4t ] ) ( 5t ] ) ( 7t ] ) ( 2t [ ) ( 3t [ ) ( 4t
[ [5(t)
) ( 1t [ ) ( 10 4 64K T
E t
) ( 13
5 75K T
E t
) ( 12 6 76K T
E t
) ( 8 2 62K T
E t
) ( 9 3 63K T
E t
) ( 11 5 65K T
E t
6 76)
1 (E K
Fig. 5. Flow Analogy of Behaviour Intervention Process
By tested with behavioural data generated by ETPB model, with initial input as M=6, NOR=3, EL=3, IL=2, E
=3, H=3, Q=3, P=3, F=3, S=3, time delayT-T=0, two days delay to intention and behaviour was
assumed for the inflows as T-T=2, inflow resistances J -J=1, transfer resistances E=0.3, E=0.2, E
=0.4. T=2, time constants (in months) are W=W=W=1, W=2 and W=4, 50 prediction data were collected in
parallel with original data. The accuracy test result of this model is shown in Figure 6. Figure 7 demonstrated the relationships for variable behaviour input: behaviour value change from 20 to 50 (step=1) and behaviour data generated by ETPB model (from month 1 to month 12) towards water end use consumption. The evaluation of ETPB-ANN limits the prediction error (%) between the original data and predication data less than 0.8% and displays with high accuracy. Overall, the ETPB-ANN is accurate enough to be employed to understand and predict water end use demand.
middle-end of the year. This was due to the increase of water use by high temperature weather or other influences (such as Chinese New Year holiday at the end of January or beginning of February). In those months, it is hard to behave a good saving attitude because the weather is hot and customers use more water in some special days, even they have positive intention to save water. But in the other time of the year, with bigger behaviour change value, the end use water consumption value could be lower (from the behaviour value zone [23-43]). Moreover, from the model accuracy perspective, due to the insufficient training data from low behaviour and high behaviour value zones, the ANN model is incapable to effectively generate current result. And for the common behaviour (zone [23-43]), the ANN works with high accuracy.
a b
Fig. 6. (a) Prediction error test of ETPB-ANN model: the error for prediction and (b) the prediction error in percentage.
a b
Fig. 7. (a) WCD Prediction with different kinds of behaviour data by ETPB-ANN: behaviour value change from 20 to 50 with step=1, (b) behaviour value generated by ETPB model from month 1 to 12.
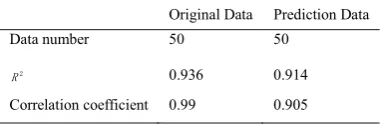
Table 2. Statistical evaluation result of ETPB-ANN.
Original Data Prediction Data
Data number 50 50
5 0.936 0.914
5.Conclusion
The results of the ETPB-ANN model shown that the high calculated behaviour value cannot lead to low end use water consumption fully. That is because the end use water consumption condition for consumers are not just be inflected by behaviour, but also can be impacted by weather change or other factors. When the behaviour value is increased by changed from ETPB, the end use water consumption has a rapid jump in the beginning then followed by a fall in the middle term of the year. According to the ANN model, in order to generate a smaller end use water consumption results, water utilities need promote strategies which could lead consumers to have a high attitude, PBC, Subjective Norm, self-efficacy values and smaller time delays in the strategies of promotion process. It can be achieved by giving consumers’ right concept for saving water (advertisement or leaflet), increasing the social pressure to form the saving water (education or increase the water bill), guidance for how to achieve the saving goals step by step, and encouragement of achievement. In order to minimalize the period for achieving targeted behaviour, efficient positive stimulation strategies are developed in the stages of understanding and forming the right water saving habits through education or marking strategies.
Apparently, the ETPB-ANN model can be used to simulate any communities or consumers for saving water with enough data training the ANN. In addition, the modelling methods for understanding the behaviour intervention process have potentials, which can be applied in fields about targeted behaviour like energy saving, GHG control, water footprint research, body weight control or quit smoking.
Acknowledgements
This research was supported by a Marie Curie International Research Staff Exchange Scheme within the 7th European Community Framework Programme-SmartWater (GA 318985) and FP7 -WatERP project (GA 318603).
References
[1] Tingyi Lu (2007) Research of domestic water consumption: a field study in Harbin, China. Master of Science thesis, Loughborough University, September, 2007.
[2] Geoffrey J. Syme, Quanxi Shao (2004) Predicting and understanding home garden water use. Presence: Landscape and Urban Planning, 68(2004): 121-128.
[3] Christopher Bennett, Rodney A. Stewart, Cara D. Beal (2013). ANN-based residential water end-use demand forecasting model. Expert Systems with Applications 40(2013) 1014-1023.
[4] Yang Fu, Wenyan Wu (2014). Behaviour interventions for water end use: An integrated model. Automation and Computing (ICAC), 2014 20th international conference, 266-271.
[5] Tracey Hassell and John Cary. (2007). the report: Promoting Behavioural Change in Household Water Consumption: Literature Review for Smart Water Project, Australia, 2007.
[6] Beal, C.D. and Stewart, R.A. (2011). South East Queensland Residential End Use Study: Final Report. Urban Water Security Research Alliance Technical Report No. 47.
[7] Glanz, K., Lewis, F. M., & Primers, B. K. (eds.). (1990). Health Behavior and Health Education: Theory, Research, and Practice. San Francisco, CA: Jossey-Bass, P17.
[8] Ezra M. Markowitz and Bob Doppelt (2009). Reducing Greenhouse Gas Emissions through Behavioural Change: An Assessment of Past Research On Energy Use, Transportation and Water Consumption, January 2009.
[9] Kenney, D., Goemans, C., Klein, R., Lowery, J., Reidy, K., 2008. Residential water demand management: lessons from Aurora, Colorado. Journal of American Water Resources Association 44, 192-207.
[10] Beal. C, Stewart, RA., Fielding, K. (2011) A novel mixed method smart metering approach to reconciling differences between perceived and actual residential end use water consumption. Journal of Cleaner Production, 2011, doi:10.1016/j/jclepro.2011.09.007.
[11] Snedecor, George W. and Cochran, William G. (1989), Statistical Methods, Eighth Edition, Iowa State University Press.
[12] Ezra M. Markowitz and Bob Doppelt (2009). Report: Reducing Greenhouse Gas Emissions through Behavioural Change: An Assessment of Past Research On Energy Use, Transportation and Water Consumption, January 2009.
[13] Russell, S. and Fielding, K. (2010). Water demand management research: A psychological perspective. Water Resources Research, 46, W0253502, doi:10.1029/2009WR 008408.
[14] Martin S.Hagger, Nikos Chatzisarantis, Stuart JH 2001, The influence of self-efficacy and past behaviour on the physical activity intentions of young people, Journal of sports sciences, volume 19, Issue 9, 711-725.
[16] Syme GJ, 2003, 'Essay 1: Planning, social justice research, and socially acceptable decision making, in stakeholder involvement in options assessment: promoting dialogue in meeting water and energy needs', A Sourcebook, The World Bank, Washington, DC, Report 264/03, pp.18-25.
[17] Bollen, K. A. (1989), Structural Equations with Latent Variables, New York: John Wiley & Sons.
[18] Lohmöller, J.B. (1989) Latent Variables Path Modeling with Partial Least Squares. Physica-Verlag: Heidelberg. [19] T. Raykov and G.A. Marcoulides, A First Course in Structural Equation Modeling, 2nd ed. Erlbaum, Mahwah, NJ, 2006.