1 Reliability and Degradation of Solar PV Modules—Case Study of 19-Year Old
Polycrystalline Modules in Ghana
David A. Quansah 1,2,3,*, Muyiwa S. Adaramola 1,*, Gabriel Takyi 2,3 and Isaac A. Edwin 2,3
1Renewable Energy Group, Faculty of Environmental Sciences and Natural Resource Management, Norwegian
University of Life Sciences (NMBU), Ås, Norway 2The Brew-Hammond Energy Centre, College of Engineering
Kwame Nkrumah University of Science and Technology (KNUST), Kumasi, Ghana; [email protected] (G.T.); [email protected] (I.A.E.)
3Department of Mechanical Engineering, College of Engineering
Kwame Nkrumah University of Science and Technology (KNUST), Kumasi, Ghana
* Correspondence: [email protected] (D.A.Q.); [email protected] (M.S.A.)
ABSTRACT
Fourteen (14) rack-mounted polycrystalline modules installed on the concrete roof of the solar energy applications laboratory at the Kwame Nkrumah University of Science and Technology (KNUST) in Ghana, a hot humid environment were assessed after 19 years of continuous outdoor expodure. The physical state of the modules was documented using a visual inspection checklist. They were further assessed by current-voltage (I-V) characterization and thermal imaging. The modules were found to be in good physical state, except some bubbles on front side and minor discolouration/corrosion at edge of the cells. Compared with reference values, the performance decline of the modules observed over the exposure period was: nominal power (Pnom), 21% to
35%; short circuit current (Isc), 5.8% to 11.7%; open circuit voltage (Voc) 3.6% to 5.6% and 11.9%
to 25.7% for fill factor (FF). It is hoped that this study will provide some helpful information to project developers, manufacturers and the research community on the long-term performance of PV modules in Ghana.
Keywords: solar PV; module; degradation; characterization; I-V curve
2 1. INTRODUCTION
The phenomenal and sustained growth of solar photovoltaics (PV) in recent years is well-documented [1] [2] [3] [4] [5] [6] [7] [8] [9]. Indeed, this growth extends to other renewable energy technologies such as wind, bioenergy, hydropower and geothermal. The drivers for this growth are widely acknowledged to include, climate policy, technology improvements and energy security considerations. Research and development (R&D) efforts have paid off in the form of increased efficiencies at both cell and module levels. For example, cell efficiencies reported in major laboratories for crystalline silicon have increased from 13% in the 1970s to 25.6% in 2016 [10], almost doubling in the period, and thus approaching the theoretical thermodynamic limit of 34% (Shockley-Queisser limit) [11] [12] for single crystal silicon cells at standard test conditions. Advances in thin-film and multi-junction cell technologies have been even more rapid. The cell-to-module efficiencies for these cell technologies have also improved to 99% in 2015 and is projected to exceed 103% by 2026 because of improvement in light management techniques [13]. As research laboratories and industry players focus on improving solar-to-electric conversion efficiencies, there is increasing acknowledgement of the need for data on the performance of systems that have already been deployed across the various climates and geographical regions of the world. A characteristic feature of solar PV (and other renewables) is the high upfront cost per installed power. Once installed, reliable performance and durability of the system enables it to generate electricity (kWh) which represents benefit to the investor/system owner. Reliability is understood as the probability that an item, in this case the solar PV module, will continue to perform its intended function without failure for a specified period of time under stated conditions[14][15]. Durability, on the other hand, has to do with how long the product will last under normal operating conditions [16].
3 up to year 25 [18]. REC Solar [19], for example, provides a 97% performance guarantee on its modules within the first year of exposure and 80.2% of peak power by the end of the 25th year.
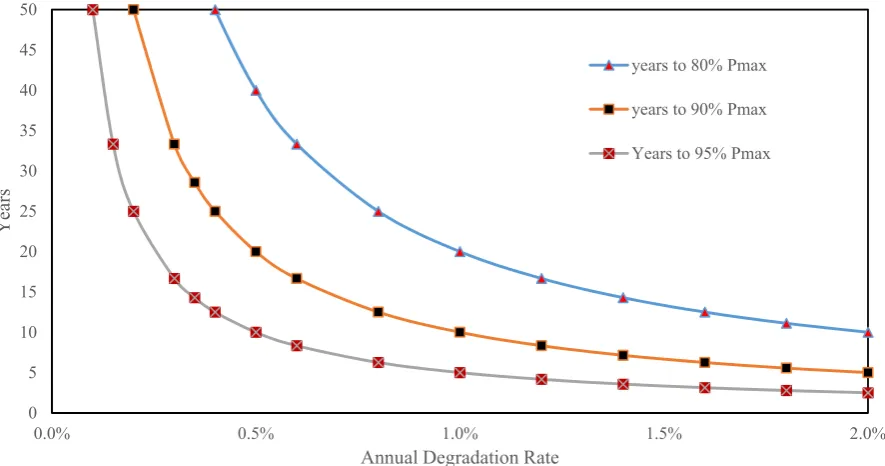
For current standard 25 year warranty (80% of peak power) to hold, modules must, on the average, degrade at not more than 0.8%/year (Figure 1). However, industry players are seeking to extend warranty periods to 30 years [20], which would imply a maximum average annual performance decline of no more than 0.65% (Figure 1).
Figure 2: Module warranty periods and degradation rates.
Solar PV warranties typically encounter two major hurdles. First, is the enforceability of the warranties [21]. This is largely attributable to the rapidly evolving landscape that has led to the extinction of many manufacturers, with others filing for bankruptcy. This extinction was most noticeable in the period 2010 – 2013, when, in the US alone, over 50 companies either collapsed or filed for bankruptcy protection [22]. Warranties provided by defunct companies on PV modules sold therefore become difficult to enforce, particularly if the need for warranty claims arise after official liquidation. To address this first problem with the warranties, some manufacturers are now
0 5 10 15 20 25 30 35 40 45 50
0.0% 0.5% 1.0% 1.5% 2.0%
Years
Annual Degradation Rate
years to 80% Pmax
years to 90% Pmax
4 providing insurance-backed warranties [23] [24][25] [26]. These insurance products are, however, certain to add to the cost of modules to the buyer.
The second difficulty with the warranties, is the more fundamental question of physical basis. Current testing and qualification regimes such as the IEC 61215 [27] for crystalline Silicon modules and IEC 61646 [28] for thin film modules employ techniques such as accelerated ageing and stress tests with the view to detecting the presence of known failure or degradation modes in the intended environments [29]. These qualifications tests can however not predict or guarantee product life under field conditions. They are indeed not designed for such a purpose [29] [30]. Qualification tests rather seeks, among others, to find design and process flaws and have been credited with significantly reducing infant mortality among PV modules [31]. It has been suggested [17], that, recent studies based on field exposure is providing some basis for and validation of 25-year warranties; however, many an overwhelming majority of modules have hardly lasted 25 years on the field to prove the validity of the warranties. Figure 2 shows that, over 80% of modules installed today have been installed in the last 5 to 6 years.
Figure 2: Global module installations over the years. Data REN21 [8]
To compound this problem further, the technologies themselves are undergoing significant material level changes. For example, [32] [33] [34] reported that crystalline Silicon (c-Si) wafer thickness has reduced from 400 µm in 1990 to 180 µm in 2015, while silicon usage has declined from 16g/Wp in 2004 to less than 6g/Wp in 2015. The metallization is also moving away from silver to less expensive options such as copper, nickel and zinc [33].
5.1 6.7 9 16 23
40 70
100 138
177 227
0 50 100 150 200 250
2005 2006 2007 2008 2009 2010 2011 2012 2013 2014 2015
Cu
m
ul
ativ
e in
stal
led
capacity
(G
5 Therefore, monitoring and assessment of fielded modules provide useful insight and feedback for module manufacturers and R&D institutions and reduces uncertainties for solar PV investors. A number of researchers have undertaken, over the years, to study the long-term outdoor performance, degradation and failure of solar PV modules around the world. Notable authors in this area include Lorenzo et al [35], Bandou et al [36], Ndiaye et al [37], Jordan and Kurtz [17], Quintana et al [38], Skoczek [39], Skoczek et al [40], Kahoul et al [41] and Ferrara and Daniel [42]. The literature identifies major causes and modes of module degradation and failure to include [38] [17]: degradation of packaging materials, loss of adhesion, degradation of cell/module interconnects as a result of thermomechanical fatigue, degradation due to moisture intrusion and degradation of semiconductor device [38]. These defects tend to result in reduced module output, safety issues and sometimes complete failure. Nevertheless, as noted by Jordan et al, it may be surmised, that, degradation in performance characteristics of modules have some dependence on local conditions and climate zone. Yet, there are no reports on degradation rates and failure modes of PV modules in many climate zones [43] [44]. Indeed, as demonstrated by authors such as Jordan et al [43] and Phinekarides et al [44], who compiled globally reported degradation rates and overlaid them on global maps (using the Koppen climate classification), there is very little reported from Africa, with nothing at all in the vast majority of climate classifications.
According to Peel et al [45] on climate classifications, Africa’s climate comprises mainly of three (3) of the Koppen-Geiger climate types – A, B and C. Ghana’s climate is classified as tropical climate (A) of the monsoon (Am) and savanna with dry winter (Aw) types. This implies that the average temperature of the coolest month of the year is above 18 oC. In terms of
precipitation, the tropical monsoon climate's driest month records less than 60 mm of precipitation but the precipitation is greater than or equal to h.
Where
ℎ = 100 −Total annual precipitation (in mm)
25
………. (1)
6 Deciduous Forest, Forest-Savannah Transition, Coastal Savannah and Northern (Interior) Savannah which comprises Guinea and Sudan Savannahs [46].
It should be noted, however, that, whereas the Koppen-Geiger classification scheme is based on temperature and precipitation, for solar PV performance and durability issues additional parameters such as humidity, temperature variation (thermal cycling), altitude and air salinity are important as well [42]. For consistency and comparability of analysis, consolidation of climate categories sometimes becomes necessary. In the work of Jordan et al [43], tropical climates such as Aw and Af are broadly classified together with Cfa (Temperate hot summer without dry season) and consolidated as hot and humid. This present work adopts this climate categorization. Another climate categorization of interest is that which was used for the All-India Survey of Photovoltaic Module Degradation: 2013 [47].
This paper seeks to contribute to filling this gap (long-term performance of PV modules and degradation in Africa) and presents results of assessment conducted on an 19-year old polycrystalline solar PV installation at the Kwame Nkrumah University of Science and Technology (KNUST) in Ghana.
2 MATERIALS AND METHODS 2.1 Site description and climate
As shown in Figure 3, Kumasi is a hot and humid climate with average daily temperature ranging from 24.4 oC in July to 27.8 oC in March and relative humidity of 65% in January to 83.5%
7 Figure 3: Monthly Average Temperature and Humidity in Kumasi [48]
Daily solar irradiation on horizontal surface in Kumasi ranges from 3.35 kWh/m2 in August to
5.09 kWh/m2 in April and monthly precipitation in the year varies from a low of 25 mm in
December to a high of 218 mm in June (Figure 4). Wind speeds are generally low and ranges from average 1.5 m/s to 2.6 m/s at this location [48].
Figure 4: Daily solar irradiation and precipitation for Kumasi [48] [49]
2.2 Description of installation
The system under study was installed in 1998 and comprises of fourteen (14) ASE-50-PWX-D modules, manufactured by PHOTOWATT. They were initially installed as part of joint project on
0 10 20 30 40 50 60 70 80 90 22 23 24 25 26 27 28 29
J A N F E B M A R C H A P R I L M A Y J U N E J U L Y A U G U S T S E P T O C T N O V D E C
REL. HUMIDITY, %
TEMP
ERA
TURE, OC
Ambient Temp oC Relative Humidity %
0 50 100 150 200 250 0.00 1.00 2.00 3.00 4.00 5.00 6.00
Jan Feb March April May June July August Sept Oct Nov Dec
Monthly rainf all, mm Solar ir radi ation, kWh/ m2/ d ay
8 solar-driven centrifugal pumps between the Institute of Machine Design, Hydraulic Turbomachinery and Hydrodynamics at the Technical University of Berlin (Germany) and the Department of Mechanical Engineering, Kwame Nkrumah University of Science and Technology (Ghana). The modules have for some time now been used in off-grid mode and charges a 400 Ah which provides power to selected loads at the Solar lab at the College of Engineering.
The system is mounted on a metallic frame on top of a concrete roof with about 1 m clearance above the roof and hence, ensures good ventilation of the modules. Each module comprises 36 cells and has nominal power of 49 W (a total of 686 Wp). Performance parameters of the modules are shown in Table 1.
Table 1: Reference module parameters
Parameter Value
Nominal Power (Pnom), W 49.50
Short-circuit current (Isc), A 3.10
Open-circuit voltage (Voc), V 21.60
Current at maximum power point (Impp), A 2.85
Voltage at maximum power point (Vmpp), V 17.40
The modules were qualified under the CEC ESTI1 503 Standard. The cell design comprises two
bus bars and 40 grid lines, organized in a rectangular pattern around four (4) centres on the two bus bars (Figure 5). In addition to the rectangular grid patterns, four (4) grid lines are also observed to run across the cells in both horizontal and vertical directions (Figure 5).
9 Figure 5: A photograph of the solar cell (left) showing its metallization and the module (right)
showing number of cells.
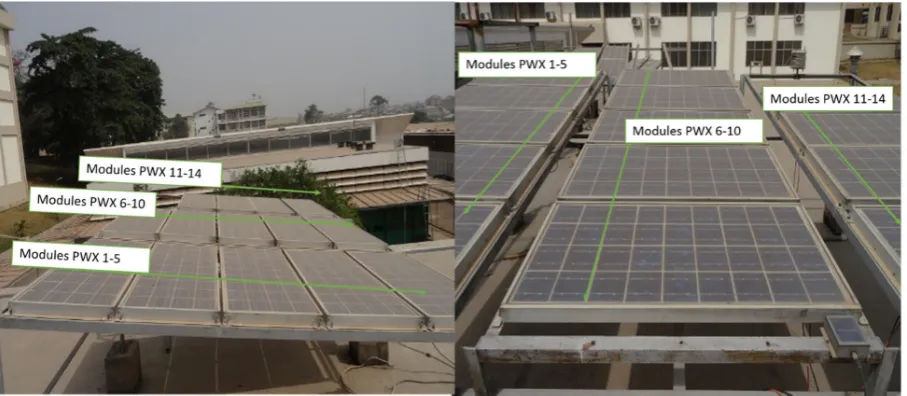
The modules are oriented toward south with a fixed inclination of approximately 15° to the horizontal. For the purpose of the assessment and measurements, the modules were labelled from PWX1 to PWX 14 as shown in Figure 6.
10 During the measurements, the modules were electrically isolated to permit access to the terminals of the modules. Even though there was no cleaning schedule in place for the modules, the rains had done some cleaning of the module surface during the period of measurement. Nonetheless, to further eliminate impact of dust on the measurement, the module surfaces were cleaned with clean water and allowed to dry before measurements were made.
2.3 Inspection and measurements
Field assessment of solar PV modules usually employ techniques such as visual and physical inspection, I-V (current-voltage) characterization, bypass diode test, insulation testing and thermal imaging to help detect defects in the modules [40]. Some defects, such as micro-cracks in cell structure may not be visible to the eye and require more advanced techniques such as electroluminescence imaging to detect. However, the I-V curve tracing is the most widely used technique in outdoor electrical characterization of solar PV modules [50].
In this study, three methods, which are visual inspection, I-V characterisation and thermal imaging were used. The visual inspection of the modules was undertaken using the widely-applied field visual inspection template by NREL/IEA [31]. This sought to systematically document any visually observable defects on the various components of the modules (such as front glass, back sheets, junction boxes, metallization, encapsulation and frames) and interconnections following 18 years of outdoor exposure.
Many known PV module defects (encapsulant browning, solder bond degradation, hot spot formation, etc.) also lead to changes such as increased series resistance, lowered shunt resistance, low transmittance of front glass and encapsulant (and optical decoupling) which tend also have characteristic signatures on I-V curves. The I-V characterization of the modules under study was undertaken using a KA I-V curve tracer. The KA IV tracer works together with TRI-SEN which measures irradiance, module temperature and module inclination angle. In-plane irradiance and module temperature are necessary for the translation of the current-voltage measurements to other reference conditions, such as STC (Standard Test Conditions – i.e. 25oC,
1000 W/m2 and AM 1.5). Module current is known to be a strong function of irradiance, while
11 The TRI-KA I-V tracer has a voltage and current measurement range of 1 – 1000 V, and 0.1 – 15 A, respectively, with uncertainty of ±1 % (for both current and voltage). The TRI-SEN measures temperature in the range 0 – 100 °C (± 3 % uncertainty) and irradiance in the range 100 – 1200 W/m2 (± 5 % uncertainty).
The key parameters used for assessment include the nominal power (Pnom), short-circuit current
(Isc), open circuit voltage (Voc) and fill factor (FF).
Figure 7 shows a typical current voltage diagram, and highlights key module characteristics:Pnom,
Impp, Vmpp, Isc, and Voc. It must be noted, that Pmax, which is the product of Isc and Voc is never
generated, as the I-V curve is never rectangular. The peak power may therefore be viewed as a fraction of the maximum power. This fraction is the fill factor.
A FlukeR TI400 thermal camera was used to obtain thermal images of the modules in forward bias
mode at Isc. The emissivity of the camera was set to 0.85 since the module surface is glass. This
was to help assess temperature inhomogeneity and possible hotspots in the modules.
2.4 Calculations and data analysis
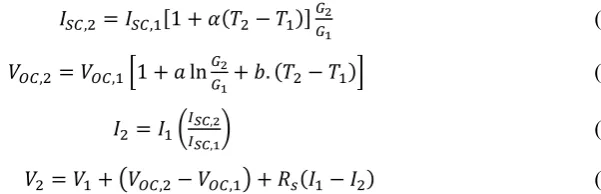
A modified version of IEC 608912 I-V data translation method, developed by the Joint Research
Centre (JRC) of the European Commission and applied in the German 1,000 Roofs Solar Programme [51] [52] was used. The equations are presented below (Equations 2 to 5):
, = , 1 + ( − ) (2)
, = , 1 + ln + . ( − ) (3)
= ,
, (4)
= + , − , + ( − ) (5)
Where: I is current (A); Isc is short-circuit current (A); G is irradiance (W/m2); T is module
temperature (oC), V is voltage (V) and Voc is open- circuit voltage (V). In these equations,
subscripts 1 and 2 refer respectively to measured values and values at reference conditions. The constant parameters and their default values, which are valid for crystalline silicon, are defined and given as:
is a dimensionless temperature coefficient of Isc (default value is 0)
12 is dimensionless temperature coefficient of Voc (default value is - 0.004)
a isdimensionless irradiance correction factor(default value is 0.06) and
Rs isseries resistance (Ω) (default value is 0)
Although a number numeric and algebraic approaches exist (e.g. IEC [53], Smith et al [54], Tsuno et al [55] and Marion [56]) for translating I-V data from measured to desired reference conditions (such as STC), many of these require the determination of coefficients, which in turn require controlled conditions such as constant irradiance and constant temperature; conditions which are difficult to obtain under field conditions, making the equations difficult to implement. The approach proposed by JRC therefore presents a balance between accuracy and practicability and has uncertainty of about 4%.
Standard manufacturer reference electrical parameters are normally reported at STC conditions. However, outdoor conditions differ, and sometimes the irradiance is well below this reference. Work by Anderson [57], has shown that translating to STC from low irradiance values and high temperature comes with lower levels of accuracy. In this present study, effort was, therefore, made to obtain I-V measurements at irradiance levels that were as close as possible to 1000 W/m2. The standardization could in principle also be undertaken to other reference
13 Figure 7: I-V curve of ASE-50-PWX-D module at different irradiance levels. PV Syst SA [58]
3 RESULTS AND DISCUSSION
3.1 Visual and physical inspection.
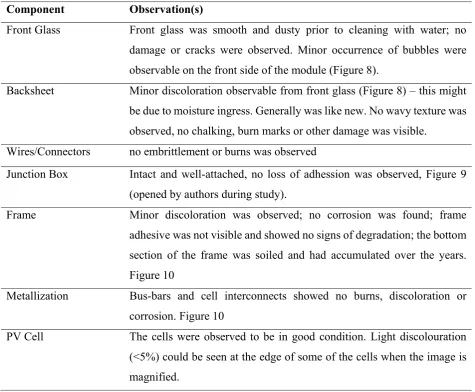
14 Table 3: Visual inspection observations.
Component Observation(s)
Front Glass Front glass was smooth and dusty prior to cleaning with water; no damage or cracks were observed. Minor occurrence of bubbles were observable on the front side of the module (Figure 8).
Backsheet Minor discoloration observable from front glass (Figure 8) – this might be due to moisture ingress. Generally was like new. No wavy texture was observed, no chalking, burn marks or other damage was visible.
Wires/Connectors no embrittlement or burns was observed
Junction Box Intact and well-attached, no loss of adhession was observed, Figure 9 (opened by authors during study).
Frame Minor discoloration was observed; no corrosion was found; frame adhesive was not visible and showed no signs of degradation; the bottom section of the frame was soiled and had accumulated over the years. Figure 10
Metallization Bus-bars and cell interconnects showed no burns, discoloration or corrosion. Figure 10
15 Figure 8: Minor discolouration of backsheet (Observable from front glass). Busbars and fingers
in good condition.
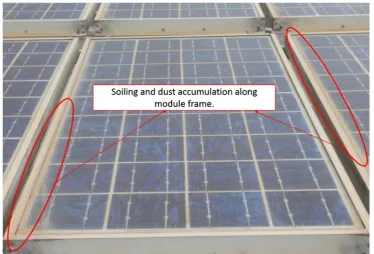
16 Figure 10: Soiling and dust accumulation along module frame.
3.2 Performance Measurements (I-V curve)
Module temperatures during the measurements period ranged from 47.80 oC to 58.90 oC, while
the irradiance conditions varied from 883 W/m2 to 1,020 W/m2. The raw data, showing the
different irradiance and temperature values are shown in Appendix 1. For each module, the measurements were repeated 5 times. The values were standardized (to STC) using equations 2 to 5. The key parameters, with their associated random errors are shown in Figures 11 to 14.
3.2.1 Peak Power
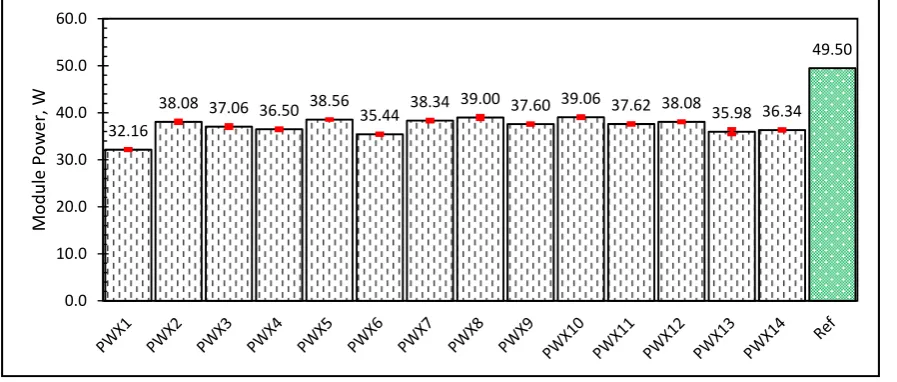
Overall on module-by-module, the power output had declined from 49.5 W to 32.2 W – 39 W (with a median of 37.6 W) over the 19-year period of exposure (Figure 12). This represents a decline of 21.1% - 35.0%, with a median of 24%. On an annual basis, the median degradation rate is 1.3%. The advantage of using the median instead of the mean, is that, it minimizes the impact of outliers. Modules of this era (the 1990s) came with 10-year warranties; within which period 80% of the peak power was guaranteed [17]. This implied a maximum average annual degradation of 2% (see Figure 1).
17 of +/-10% [17]; which implied that the peak power less 10%, (in this case 44.5 W) would still be within the purchase agreement. If this lower limit of the tolerance were used, 80% of peak power will translate to 35.6 W, in which case over 85% of the modules will still be operating above the minimum guaranteed output after 19 years of exposure. While some authors have defined module failure to mean an effect that degrades the module power, which is not reversed by normal operation or creates a safety issue [31], module life on the other hand, as noted by [29], does not lend itself to easy definition, as they could mean different things depending on the perspective. From a manufacturer’s perspective, module life may be viewed in terms of financial liability period, whereas the user is not necessarily bound by this and may keep the module in service as long as it is safe, and meets or contributes to meeting their needs.
Figure 12: Peak power of modules at STC.
The coefficient of variation of the peak power of the 14 modules (computed as ratio of the population standard deviation to the mean) is 5%; indicating uniformity of ageing. Such uniformity of ageing has been viewed by authors such as Skoczek et al [40] as an indicator of good quality control in the module manufacturing process. The power loss in module PWX1 is notably much higher than the remaining modules. Its power output had dropped to 32.2 W, much below the median value of 37.6 W; registering a decline of 35% compared with the median decline of 24% for the entire system. The nature of the I-V curve (discussed later in Section 3.2.4) may help in explaining the cause of the performance decline. Since module
32.16 38.08 37.06 36.50 38.56 35.44 38.34
39.00 37.60 39.06 37.62 38.08 35.98 36.34 49.50
0.0 10.0 20.0 30.0 40.0 50.0 60.0
Module Power,
18 peak power is a function of short-circuit current, open-circuit voltage and fill factor; changes in power output must be explainable in terms of these parameters.
3.2.2 Short-circuit current
As shown in Figure 13, the short-circuit current of the modules declined from 3.1 A to between 2.74 A and 2.92 A, with a median value of 2.86 A. These represent, respectively declines of 5.8% to 11.7% and median of 7.9% over the 19-year period. On an annual basis, the median decline in the short-circuit current is 0.4%. Of particular note is module PWX6 (Figure 13), which showed a much sharper decline in short circuit current (0.6%/year). Bubble formation and delamination is suspected to be the cause of this observation. Overall however, coefficient of variation was 2%. The short circuit current has a strong dependence on irradiance and hence a decline in short-circuit current could be due to optical transmission problems caused by factors such as module soiling, browning/yellowing of encapsulant and delamination which causes optical decoupling (mismatch of refractive indices).
Figure 13: short-circuit current of modules at STC
3.2.3 Open-circuit voltage
The open-circuit voltage (Voc) of the modules (Figure 14) ranged from a low of 20.4 V (PWX 14) to 20.8 V (PWX 5) and a median of 20.7 V. The decline from the nameplate rating of 21.6 V is 3.6% to 5.6% over the period with a median of 4.1%. The annual decline translates to 0.2% to 0.3% with median of 0.2%. The open-circuit voltage coefficient of variation is estimated as 1%. The annual degradation rate of the open circuit voltage is significantly less than the short-circuit current. Loss of Voc usually attributed to degradation of the cells and shunting problems [42].
19 Figure 14: Open-circuit voltage of modules at STC
3.2.4 Fill FactorThe fill factor of the modules (Figure 15) was in the range of 55% (PWX 1) to 65.2%
(PWX 5). This represents a decline of 11.9% to 25.7% with a median of 14.3% over the period of exposure; compared with the original value of 74%. On an annual basis, this translates to 0.6% - 1.4% and median of 0.8%. Even though the coefficient of variation of the fill factor of the modules is 4%, module PWX 1, exhibits markedly higher loss of fill factor compared with the rest of the modules. Figure 16, shows the I-V curves of the modules studied. The power loss of module PWX1 (Section 3.2.1), in particular, is traceable to fill factor loss. Loss of fill factor is generally attributed to increase in series resistance of the modules ( [37] [39]), arising from factors such as corrosion and thermo-mechanical fatigue of the solder bonds and interconnection. Indeed, the shape of the I-V curve arising from fill factor loss, as is the case with module PWX 1 (Figure 16), is reproducible from the 1-diode PV cell model by increasing the series resistance [60].
20.72
20.64 20.60 20.51 20.81
20.71 20.72 20.75 20.73 20.77 20.81 20.78 20.49
20.38 21.60
19.6 19.8 20.0 20.2 20.4 20.6 20.8 21.0 21.2 21.4 21.6 21.8
Open circuit
20 Figure 15: Fill factor of modules at STC
Figure 16: I-V curves of modules 55.0%
64.0% 63.8% 62.0% 65.2% 62.8% 64.2% 64.8% 63.2% 65.0% 63.2% 63.0% 62.2% 63.6% 74.0%
0% 10% 20% 30% 40% 50% 60% 70% 80%
PWX1 PWX2 PWX3 PWX4 PWX5 PWX6 PWX7 PWX8 PWX9 PWX10PWX11PWX12PWX13PWX14 Ref
Fill fact
or
0.0 0.5 1.0 1.5 2.0 2.5 3.0
0 5 10 15 20
C
u
rrent, A
Voltage, V
21 3.3 Thermal Imaging
Thermal imaging of the modules, forward-biased at Isc, generally did not reveal much inhomogeneity in module surface temperature. Temperature distribution on the module surface showed difference of less than 5 oC for most modules, the exception being module PWX 1 which had cell temperature difference of about 10 oC at some sections of the module (Figure 17).
Figure 17: surface temperature distribution – module PWX 1
The general uniformity of temperature distribution and non-occurrence of hot-spots agrees with the point made earlier on the uniform ageing of the modules based on the co-efficient of variation of peak power and other key performance parameters.
3.4 Accounting for power loss
22 Figure 18: Annual power loss versus losses in Isc, Voc and FF.
A regression analysis indicates that Isc and FF, together explain 97.5% of the variability in peak power (adjusted R-squared), Table 3. The loss of power is therefore attributable to losses in short-circuit current and fill factor, and to a lesser extent, on the open short-circuit voltage.
Table 3: regression parameters (Pnom modelled by Isc and Voc)
Coefficients Standard Error t Stat P-value
Intercept 0.002495398 0.000502317 4.96778 0.000424
Isc 0.907725217 0.106155361 8.550913 3.45E-06
FF 0.869416269 0.050343898 17.26955 2.56E-09
Adjusted R Square - 0.975; F statistic - 256.2; standard error - 0.000308; 1.0%
1.1% 1.2% 1.3% 1.4% 1.5% 1.6% 1.7% 1.8% 1.9%
0.0% 0.2% 0.4% 0.6% 0.8% 1.0% 1.2% 1.4% 1.6%
Annual P
eak
P
o
wer
Loss
Annual Loss in Isc, Voc and FF
Isc
FF
23 3.5 General Discussion
To put the current results into perspective, it is helpful to compare with similar studies. Jordan and Kurtz [17], conducting an analytical review of alomost 2000 reported degradation rates found in the literature, determined a median value of 0.61% degradation for multicrystalline Silicon modules installed prior to the year 2000, a total of 409 installations. In a more recent and updated work by an expanded team, Jordan et al [59] based on literature review, found that a median degradation rate of 0.6% (based on 683 observations) was reported for crystalline silicon modules installed in hot humid climates. Even though the median degradation (peak power) of the modules in this present study is higher (1.3%/year) than the median of reported in these reviews, it is consistent with rates reported of installations in the period 1990 – 2000, which were about 1%/year [59]. It should be noted also, that, the data used in the reviews do not have balanced geographical representation as acknowledged by the authors of the review. This geographical imbalance underscores the need for continuing effort to study systems that are installed in regions for which data is under-reported or not reported at all.
The dominance of short-circuit current and fill factor in driving the power loss of the modules is consistent with previous studies which have reported on this, including: Ndiaye et al [37] , Bandou et al [36] and Jordan and Kurtz [17]. Bandou et al [36] studied a 28-year old systen installed in the desert of Algeria and reported annual degradation of 1.22% in peak power, arising mainly from 0.78% in short circuit current and 0.56% in fill factor. Even though the study by Ndiaye et al [37] had a rather short observation period (1.3 – 4 years), the results also confirm the dominance of short-circuit current and fill factor in power degradation.
4. CONCLUDING REMARKS
This study has examined the performance of fourteen (14) polysilicon modules, installed at KNUST in Kumasi Ghana, a hot and humid climate, after 19 years of outdoor exposure and under load. Systematic visual inspection, electrical characterization using current-voltage (I-V) tracing and thermal imaging were used to assess the modules. This paper concludes as follows:
24 Some bubble on front side and minor discolouration at the edge of some cells were, however, observed upon magnification of images acquired.
• During the period of exposure (19 years), the median decline recorded in the performance parameters of the modules, compared with reference values were, respectively: Peak Power (Pnom) 24%, Short Circuit Current (Isc) - 7.9%, Open Circuit Voltage (Voc)- 4.1% and Fill Factor (FF) - 14.3%.
• On an annual basis, the median of the decline in performance parameters were: Pnom - 1.3%, Isc - 0.4%, Voc - 0.2% and FF- 0.8%.
• The module had a warranty of 10 years, with a tolerance of +/-10%. At the median annual power degradation rate of 1.3%, the module has met and exceeded warranty expectations, even if the lower end of the tolerance was ignored.
• The reduction in nominal power is dominated by reduction in fill factor and short circuit current.
To contribute to filling the data gap on long-term PV module performance degradation in Ghana, future work will study modules installed in various micro-climatic zones of Ghana.
Acknowledgement
David A Quansah is grateful to the Quota Scholarship Programme of the Norwegian Government for sponsoring his Doctoral studies at NMBU Norway. He is also grateful to his employer, the Kwame Nkrumah University of Science and Technology (KNUST) for granting him study leave and equipment support. The authors are grateful to the Provost of the College of Engineering at KNUST for providing financial assistance towards data collection, and also to Research Assistants at The Brew-Hammond Energy Centre (Jacob and Henry) for their support during the measurements period.
References
[1] IEA, “Projected Costs of Generating Electricity - 2015 Edition,” IEA, Paris, 2015.
25 [3] IEA, “World Energy Outlook,” IEA/OECD, 2013.
[4] IRENA, “Africa 2030: Roadmap for a Renewable Energy Future,” Abu Dhabi, 2015. [5] IRENA, “SOLAR PV IN AFRICA: COSTS AND MARKETS,” IRENA, Abu Dhabi, 2016. [6] REN21, “ECOWAS Renewable Energy and Energy Efficiency - Status Report,”
ECREEE/UNIDO/REN21, Paris, 2014b.
[7] REN21, “Renewables 2015 - Global Status Report,” REN21 Secretariat, Paris, 2015. [8] REN21, “Renewables 2016 Global Status Report,” REN21 Secretariat, Paris, 2016. [9] Fraunhofer ISE, “Photovoltaics Report,” 2015.
[10 ]
NREL, “Best Research Cell Efficiencies,” 2016.
[11 ]
pveducation.org, “Solar Cell Efficiency - Detailed Balance,” 2016. [Online]. Available:
http://www.pveducation.org/pvcdrom/solar-cell-operation/detailed-balance. [Accessed 4 October 2016].
[12 ]
W. Shockley and H. J. Queisser, “Detailed Balance Limit of Efficiency of p-n Junction Solar Cells,”
Journal of Applied Physics, 1961. [13
]
VDMA/ITRPV, “International Technology Roadmap for Photovoltaic - 2015 Results.,” 2016.
[14 ]
G. Yang, Life Cycle Reliability Engineering, New Jersey: John Wiley & Sons, 2007.
[15 ]
ReliaSoft Corporation, “About Reliability Engineering,” 2016. [Online]. Available: http://www.weibull.com/basics/reliability.htm. [Accessed 3 October 2016]. [16
]
A. K. Verma, S. Ajit and D. R. Karanki, Reliability and Safety Engineering, New York: Springer, 2016.
[17 ]
D. C. Jordan and S. R. Kurtz, “Photovoltaic Degradation Rates—an Analytical Review,” PROGRESS IN PHOTOVOLTAICS, p. 12–29, 2013.
[18 ]
EnergySage, Inc, “What to Know About a Solar Panel Warranty,” EnergySage, Inc, 2015.
[19 ]
26 [20
]
D. L. King, M. A. Quintana, J. A. Kratochvil, D. E. Ellibee and B. R. Hansen, “Photovoltaic Module Performance and Durability Following Long-Term Field Exposure,” Progress in Photovoltaics: Research and Applications., vol. 8 , pp. 241-256, 2000.
[21 ]
S. Srinivasan, “Solar photovoltaics: oligopsony, non-market decision-making and the paradoxical persistence of unprofitability,” International Journal of Green Economics, vol. 7, no. 2, 2013. [22
]
GTM Research, “Rest in Peace: The List of Deceased Solar Companies,” GTM Research, 2013.
[23 ]
CivicSolar, Inc, “Canadian Solar Warranty Insurance,” CivicSolar, Inc, 2014.
[24 ]
CSUN, “25-Year Insurance Backed Warranty,” 2014.
[25 ]
Trina Solar, “25 Year Insurance Backed Warranty,” 2014.
[26 ]
Canadian Solar (USA) Inc., “PV Module Warranty and Warranty Insurance Comparisons: A Cornerstone Of Bankability,” Solar Southwest Florida, 2011.
[27 ]
IEC, “Crystalline silicon terrestrial photovoltaic (PV) modules - Design qualification and type approval,” IEC, 2005.
[28 ]
IEC, “Thin-film terrestrial photovoltaic (PV) modules - Design qualification and type approval,” IEC, 2008.
[29 ]
C. R. Osterwald and T. J. McMahon, “History of Accelerated and Qualification Testing of Terrestrial Photovoltaic Modules: A Literature Review,” Progress in Photovoltaics: Research and Applications,
vol. 17, p. 11–33, 2009. [30
]
A. F. Zielnik and D. P. Dumbleton, “Photovoltaic Module Weather Durability & Reliability - Will my module last outdoors?,” Solar Energy Competence Center - Atlas Material Testing Technology LLC, 2010.
[31 ]
IEA, “Review of Failures of Photovoltaic Modules,” IEA/OECD, 2014.
[32 ]
Fraunhofer ISE, “Photovoltaics Report,” Fraunhofer ISE, Freiburg, 2016.
[33 ]
27 [34
]
D. Rudolph, S. Olibet, J. Hoornstra, A. Weeber, E. Cabrera, A. Carr, M. Koppes and R. Kopecek, “Replacement of silver in silicon solar cell metallization pastes containing a highly reactive glass frit: Is it possible?,” Energy Procedia, no. 43 (2013), p. 44 – 53, 2013.
[35 ]
E. Lorenzo, R. Zilles, R. Moretón, T. Gómez and A. Martínez de Olcoz, “Performance analysis of a 7-kW crystalline silicon generator after 17 years of operation in Madrid,” Progress in Photovoltaics: Research and Applications, vol. 22, no. 12, p. 1273–1279, 2013.
[36 ]
F. Bandou, A. H. Arab, M. S. Belkaid, P.-O. Logerais, Riou, Olivier and A. Charki, “Evaluation performance of photovoltaic modules after a long time operation in Saharan environment,”
International journal of hydrogen Energy, vol. xxx, pp. 1-10, 2015. [37
]
A. Ndiaye, C. M. F. Kébé, A. Charki, P. A. Ndiaye, V. Sambou and A. Kobi, “Degradation evaluation of crystalline-silicon photovoltaic modules after a few operation years in a tropical environment,”
Solar Energy, vol. 103, 2014. [38
]
M. A. Quintana, D. L. King, T. J. McMahon and C. R. Osterwald, “COMMONLY OBSERVED DEGRADATION IN FIELD-AGED PHOTOVOLTAIC MODULES,” 2002.
[39 ]
A. Skoczek, “Long-term performance of photovoltaic modules,” 2008.
[40 ]
A. Skoczek, T. Sample and E. D. Dunlop, “The Results of Performance Measurements of Field-aged Crystalline Silicon Photovoltaic Modules,” Prog. Photovolt: Res. Appl., p. 227–240, 2009.
[41 ]
N. Kahoul, M. Houabes and M. Sadok, “Assessing the early degradation of photovoltaic modules performance in the Saharan region,” Energy Conversion and Management, p. 320–326, 2014. [42
]
C. Ferrara and D. Philipp, “Why Do PV Modules Fail?,” in International Conference on Materials for Advanced Technologies 2011, Symposium O, 2012.
[43 ]
D. C. Jordan, J. H. Wohlgemuth and S. R. Kurtz, “Technology and Climate Trends in PV Module Degradation,” in 27th European Photovoltaic Solar Energy Conference and Exhibition, September 24–28, 2012, Frankfurt, Germany, 2012.
[44 ]
A. Phinikarides, N. Kindyni, G. Makrides and G. E. Georghiou, “Review of photovoltaic degradation rate methodologies,” Renewable and Sustainable Energy Reviews, vol. 40, p. 143–152, 2014. [45
]
M. C. Peel, B. L. Finlayson and T. A. Mcmahon, “Updated world map of the Koppen-Geiger climate classification,” Hydrology and Earth System Sciences Discussions, pp. 439-473, 2007.
[46 ]
FAO, “Ghana - Country Pasture/Forage Resource Profiles,” 2006. [Online]. Available:
http://www.fao.org/ag/agp/agpc/doc/counprof/ghana/Ghana.htm#3.%20CLIMATE%20AND%20A GRO-ECOLOGICAL%20ZONES. [Accessed 21 November 2016].
[47 ]
28 [48
]
RETScreen International, RETScreen Climate Database, 2014.
[49 ]
F. Nkrumah, N. A. B. Klutse, D. C. Adukpo, K. Owusu, K. A. Quagraine, A. Owusu and W. .. Gutowski(Jr), “Rainfall Variability over Ghana: Model versus Rain Gauge Observation,”
International Journal of Geosciences, vol. 5, pp. 673-683, 2014. [50
]
P. Hernday, “Field Applications for I-V Curve Tracers,” SolarPro, 2011.
[51 ]
W. Herrmann and W. Wiesner, “Current-Voltage Translation Procedure for PV Generators in the German 1,000 Roofs-Programme,” CiteSeerX, 2014.
[52 ]
W. Zaaiman, “Solar Irradiance and Photovoltaic Measurements From Solar Radiation to PV Arrays,” AFRETEP 3rd Regional Workshop, 20th-24th 2012, Cape Town, South Africa, 2012.
[53 ]
IEC, “IEC 60891:2009 Photovoltaic devices - Procedures for temperature and irradiance corrections to measured I-V characteristics,” IEC, 2009.
[54 ]
M. R. Smith, C. D. Jordan and R. S. Kurtz, “Outdoor PV Module Degradation of Current-Voltage Parameters,” NREL, 2012.
[55 ]
Y. Tsuno, Y. Hishikawa and K. Kurokawa, “Modeling I-V Curves of PV Modules Using
Interpolation/Extrapolation,” Solar Energy Materials and Solar Cells, vol. 93, no. 6–7, p. 1070– 1073, 2009.
[56 ]
B. Marion, “A Method for Modeling the Current–Voltage Curve of a PV Module for Outdoor Conditions,” PROGRESS IN PHOTOVOLTAICS: RESEARCH AND APPLICATIONS, vol. 10, pp. 205-214, 2002.
[57 ]
J. A. Anderson, “Photovoltaic Translation Equations: A New Approach,” NREL, Colorado, 1996.
[58 ]
PVsyst SA, “PVSyst Photovoltaic Software,” 2012.
[59 ]
D. C. Jordan, S. R. Kurtz, K. VanSant, Newmiller and Jeff, “Compendium of photovoltaic degradation rates,” Progress in Photovoltaics: Research and Applications, vol. 24, no. 7, p. 978–989, 2016. [60
]
pveducation.org, “ Effect of parasitic Resistances- Series Resistance,” 2016. [Online]. Available: http://www.pveducation.org/pvcdrom/series-resistance. [Accessed 5 December 2016]. [61
]
29 Appendix 1: Measured performance data at various irradiance and temperature (irradiance nearest 1000 W/m2)
Module ID
T_mod, oC
G, W/m2
Isc [A]
Voc [V]
Impp [A]
Umpp [V]
P
[W] FF PWX1 56.70 970.00 2.73 18.33 2.18 11.86 25.80 0.51 PWX2 58.80 937.00 2.69 18.14 2.25 13.34 30.00 0.61
PWX3 58.90 941.00 2.67 18.02 2.15 13.53 29.10 0.60
PWX4 58.90 949.00 2.72 18.10 2.25 12.83 28.80 0.59
PWX5 54.10 997.00 2.83 18.73 2.39 13.88 33.20 0.63
PWX6 50.10 1,014.00 2.76 18.84 2.26 13.91 31.40 0.60
PWX7 51.10 958.00 2.79 18.73 2.30 14.01 32.20 0.61
![Figure 2: Global module installations over the years. Data REN21 [8]](https://thumb-us.123doks.com/thumbv2/123dok_us/1018126.1601801/4.595.86.502.411.584/figure-global-module-installations-the-years-data-ren.webp)
![Figure 4: Daily solar irradiation and precipitation for Kumasi [48] [49]](https://thumb-us.123doks.com/thumbv2/123dok_us/1018126.1601801/7.595.71.525.105.282/figure-daily-solar-irradiation-and-precipitation-for-kumasi.webp)
![Figure 7: I-V curve of ASE-50-PWX-D module at different irradiance levels. PV Syst SA [58]](https://thumb-us.123doks.com/thumbv2/123dok_us/1018126.1601801/13.595.113.489.110.401/figure-curve-ase-module-different-irradiance-levels-syst.webp)