Intermodal Passenger Transportation and Destination
Competitiveness in Greece
Marina Efthymiou and Andreas Papatheodorou
Abstract
Effective transportation is impeded by a number of caveats, including problems of accessibility to the destination, poor infrastructure, social and environmental issues. In this context, the implementation of intermodal solutions is essential to meet customer demand, resolve problems of transport supply and enhance destination competitiveness. Based on a suitable theoretical framework, this paper examines the attitude of Greek passengers towards intermodal transportation and their willingness-to-pay more to be provided with such a seamless service to allow for (partial at least) cost recovery of the related transport infrastructure. The findings suggest that there are many respondents who would actually pay more to be provided with a door-to-door intermodal travel experience; answers are highly dependent on their place of residence.
Keywords: intermodality, destination competitiveness, passenger attitude, willingness-to-pay, Greece.
To cite this article:
Marina Efthymiou & Andreas Papatheodorou (2015) Intermodal passenger transport and destination competitiveness in Greece, Anatolia, 26:3, 459-471, DOI:
10.1080/13032917.2015.1012171
Introduction
Transportation is a constituent element of tourism. In fact, every industry with a ‘tourism ratio’ (i.e. its tourism related receipts as a percentage of its total turnover) exceeding 15% is regarded as part of the tourism system; in this context, commercial aviation and cruising (at least) both with a related ratio over 90% are regarded as par excellence tourism sectors (Duval, 2007; Page, 1999; Stabler, Papatheodorou & Sinclair, 2010). The demand for transportation services is a function of many factors. It depends on the price of the transport service, the presence or absence of substitutes and the quality of the service provided (Profilidis, 2008). Transport mode competition has led to improvements into the quality of transportation. Nonetheless, there are still many problems unsolved. For instance, one has to use different means of transportation, in order to reach their final destination. Yet it may prove difficult, inconvenient and time-consuming to change modes.
In fact, connection between different mode terminals is of high importance. Many of today’s airports are located in previously isolated areas and built at a time when terminal construction was based upon the assumption that all passengers arrive or depart by private car or taxi (Vespermann & Wald, 2011). For instance, someone may have to move from the airport to the bus station with their luggage; they may not know how to transfer to the bus terminal and wait many hours for the next part of their journey. In addition, they may worry that a delay in the first leg of their journey (i.e. by air) may have negative repercussions on the realization of subsequent journey legs and they also face imperfect information. Hence, it seems that low priority has been given by policymakers into the need of passengers to combine different means of transport. The solution to the above concerns is effective intermodality that is widely used in the transportation of goods.
of a survey of Greek passengers; the main research objective is to identify the role of socio-demographic characteristics in passenger willingness-to-pay for intermodal solutions especially in very harsh economic times.
Literature review
Passenger intermodality is “a policy and planning principle that aims to provide a passenger with different modes of transport in a combined trip chain for a seamless journey” (Müller et al., 2004, p. I). By definition intermodality is the use of several means of transport for a single door-to-door trip, provided that transport modes are coordinated. This streamlining can be realized thanks to adequate intermodal infrastructure, and to intermodal agreements concluded by transport operators. These agreements for instance allow a common reservation for the whole trip; coordinated timetables; a joint check-in process and the certainty of reaching the final destination in spite of any delays experienced by one or more transport modes during the trip. The available literature has mainly placed emphasis on air–rail integration (e.g. Chiambaretto & Decker, 2012; Givoni & Banister, 2006; Román & Martín, 2014) but other possible mode combinations include urban public transport/long-distance train; rail/ship; air/ship; and cycling/ long-distance train.
Intermodality is a subject that brings transport operators, planning bodies, passengers and society together. The three major stakeholders (customers, operators and destination authorities) are highly interlinked. It is believed that intermodality can mitigate the existing capacity problems of current modal and loosely connected networks resulting in traffic congestion and pollution and thus contribute to higher efficiency of individual trips and the transport system as a whole especially in cities (Dacko & Spalteholz, 2014). Intermodality can also reduce negative social and environmental externalities (Dimitriou, Voskaki & Sartzetaki, 2014) and promote sustainable development and territorial cohesion (Müller et al., 2004). For all these reasons, intermodality may improve destination competitiveness with positive repercussions on tourism development (Liu, Tzeng, Lee & Lee, 2013).
Undoubtedly, the passenger is the one who primarily benefits from intermodality. The positive effects focus on the duration of the transportation process, the price of the service, comfort and improved accessibility to various areas. In particular, it is most likely that the time of arrival at the destination will become shorter. But even if this is not the case, the dead time of the passenger will be spent on a friendly environment such as an airport terminal and its lounges. Moreover, it is highly important to consider the value-for-money of the intermodal service: as a result of enhanced accessibility passengers will likely gain easier and faster access to areas that were previously difficult to reach. Finally, the cooperation of modes leads to an increase of the overall efficiency of the transport system and improves the transport experience. The traveller has the opportunity to enjoy a more comfortable journey. All the above raise of course the important issue of willingness-to-pay by passengers given that the added value offered by intermodality often relies on expensive infrastructural developments (Anastasiadou, Dimitriou, Fredianakis, Lagoudakis, Traxanatzi & Tsagarakis, 2009).
possible by various means of transport and their intensity depends on several factors, i.e. the availability of specific means of transport; the incentives for travel, which are a key factor in determining feasible new routes and networks, and strengthening existing ones; the available time of the passengers; and the use of different hubs, according to cost and efficiency.
Moreover, tourists can use various means of transport during their journey, e.g. taxi, public transport, train and airplane. Someone can use the airplane to go from the origin area to a destination in another country; the train to travel within the country of the destination; and bus or taxi to wander around the area. Finally, when multiple destinations are involved in the trip, this has an effect on the use and choice of transport modes. For example, a family travelling with a caravan can make more than one stops at various destinations. The flow of the journey will be affected for example by the existence of infrastructure and the schedule of services (Page, 1999).
By reducing traffic congestion and emissions, intermodality also improves destination competitiveness from a green marketing perspective. In fact, a region has an image and according to its impact on people, the area may be considered attractive or not. Angelis and Gaki (1999) argue that the image of a region may be categorized into two categories, i.e. the basic and the specific image. The basic image of a given region measures the extent to which the area meets some essential criteria common to all who wish to visit the region. The specific image of a given region, as perceived by a particular group that is likely to visit it, measures the extent to which this group considers this area as the final choice for their trip.
Improving the basic image requires mainly infrastructure development. This action will enable investors and will eventually lead to the improvement of some specific factors. Obviously, this method is expensive and slow, but its effects last longer. An investment for example in road infrastructure or making a port an interchange hub (to accommodate for instance ships and buses), would improve the basic picture of an area and/or in conjunction with a coherent advertising campaign it would improve the image of the specific wider region. The ‘’pull" strategy is more effective than the ‘’push" strategy which is an effort to improve the specific factors that affect the tourists. The push strategy is a fast technique, but has questionable lasting results. The combination of both is deemed as ideal (Holloway, 2004).
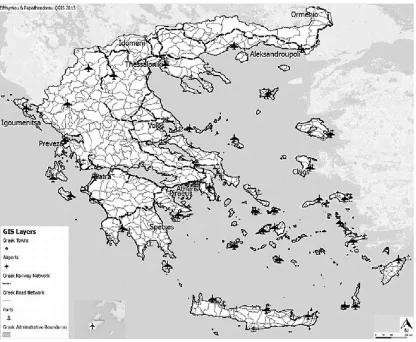
all transport modes (Papatheodorou, 2001a). More specifically, the Greek geomorphological pattern is extremely complex. Greece has a large number of islands and a mountainous landscape, which makes all investments in infrastructure more difficult and costlier compared to other countries. This results into a comparative disadvantage from a transport perspective. In the past two decades transport in Greece has undergone significant changes but ferry transport remains the prominent mode of transportation between islands. Greece has fourteen main ports, the most important ones being Piraeus, Patras, Thessaloniki and Igoumenitsa (see Figure 1).
Figure 1. Greece – major transport infrastructure.
Piraeus, metro and suburban rail (Athens International Airport, 2014). Still, Athens International Airport is an exception to the rule. At present, Metro (underground rail) exists only in Athens, but until 2017 the construction of Thessaloniki metro is scheduled to be completed. Efficient and effective public transportation is provided only in two large cities, namely Athens and Thessaloniki.
The Greek railway network is “relatively limited due to the mountainous terrain of the country with general alignment dating back to the early 1900s” (Ecorys, 2006, p.8). Considerable investments have been made since 1980, aiming to upgrade the existing sections. This is expected to continue in the upcoming years. The operating railway network is approximately 2,550km long, consisting of 70% of standard gauge line (1,435 mm) (Attiki, Central Greece, Thessalia, Makedonia and Thrace) and 35% of metric gauge line (Peloponnesus) (Hellenic Railways Organisation, 2013). One of the greatest difficulties is the lack of electric traction and the operational inefficiency of the rail stations. The maximum speed is now 160 Km/h, which applies to 18% of the rail network. In 40% of the rail network the maximum speed is 80 to 119 km/h and in 19% less than 79 Km/h (Hellenic Railways Organisation, 2013). Still, the observed modal split in passenger travel demand reveals the existing relatively weak position of rail in the transport mix. It is noticeable that some improvement has been made, but obviously this is not sufficient. Service improvements and linking of rail infrastructure to ports may have a positive impact on intermodality in the future in spite of the geomorphology of the country which poses natural limits to this particular mode (i.e. rail) of transport.
Passenger transportation by sea mainly accommodates trips between continental Greece and the islands, between islands, as well as between Greece and Italy, competing only against air transport. A small number of short sea shipping links exists between the Greek islands in the Eastern Aegean Sea and the Turkish Aegean coast. The total number of sea passengers carried in 2010 in Greece was 84 million (Eurostat, 2012). During the summer period, transport demand increases substantially vis-à-vis the annual average resulting in the insufficiency of supply to meet the requirements of the peak period.
According to the Travel and Tourism Competitiveness Report (World Economic Forum, 2013) Greece ranked 20th out of 140 countries in terms of air transport infrastructure (with a score of 4.7 out of 7) and 58th (score: 4.0) in ground transportation. Greece has a notable competitive advantage in airport density (15th position) and the number of operating airlines (19th position). The country’s lowest ranks are, as far as the air transportation is concerned, the quality of infrastructure (45th position) and the size of the international air transport network (58th position). With respect to ground transport infrastructure, the lowest ranks relate to the quality of roads (71st position), the port infrastructure (66th position) and the quality of railroad infrastructure (67th position) while the highest rate concerns road density (39th position). Greek ports have three major problems: poor equipment and low capital expenditure on infrastructure; very poor connections with the hinterland (railways, road) and administrative and operational deficiencies (European Commission, 2012).
The geographical discontinuity of Greece in conjunction with the promising developments in transport infrastructure set the ideal base for the enhancement of intermodality. Moreover, and in spite of the transportation problems that they encounter, many areas are regarded as attractive by tourists due to the abundance of tourism-related resources (e.g. beaches, heritage). Intermodality can offer added value even in these areas as it is an additional element to attract tourists. Thus interoperability becomes a key element in the modern transport for tourism system. In the next empirical section of this paper the attitude of the Greek passengers is examined. In particular, we will investigate if Greeks actually desire intermodal services and whether they are willing to contribute and cover a part of the cost for this facility.
Survey data were collected by one of the authors from November 2013 to March 2014. The target group in scope for intermodality was a broad range of Greek community people: air and rail travellers, and most importantly potential travellers who were at the time unaware of intermodal solutions. In particular, the survey was conducted with questionnaires filled up by Greek (both incoming and outgoing) passengers either online and/or in points of access such as Athens International Airport. A total of 469 questionnaires were answered, 256 from internet and 213 with the interviewer’s (i.e. one of the authors) onsite assistance. From them only 431 were taken into consideration and the rest were excluded from the analysis as invalid. The process that was used to conduct the survey is called simple random sampling (Kothari, 2004). Each individual was chosen randomly and entirely by chance (Dattalo, 2010). The statistical package SPSS (Statistical Package for Social Sciences; Version: IBM SPSS Statistics 20) was used to derive descriptive statistics. Chi-square tests and non-parametric Monte Carlo test with 95% confidence level or a 0.05 significance level were used to examine the statistical relationship between the different variables. Furthermore, the ratio Cramer’s V was used to examine the intensity of interdependence among the variables.
Results
According to the descriptive statistics of the sample 48.9% of the respondents were women and 41.1% men. Moreover 40.8% of the respondents were in the 18-25 years age cohort; 32% were between 26 and 35; 22% between 36 and 55; and 5.1% were over 56 years old. In addition, 26.2% of the respondents worked in the private sector, 13.2% in the public sector, 30.4% were students, 10.9% were freelance businesspeople, 12.5% unemployed and 6.7% were classified under the category “Other”. More than half of the respondents reside in big cities (43.4% in Athens, 8.8% in Thessaloniki, 5.8% in Patras and 42% in other smaller cities and villages), while 17% of the interviewees travel cross border; moreover 30% travel 1-2 times per month. Table 1 reveals that almost 46% of respondents use only one mode of transport, but more than half (54%) need to combine more than one means of transport in order to get to their final destination.
Table 1. Use of modes of Transport (n=431).
Use of single Mode of Transport Per cent of respondents
Private car 24.1%
Coach 8.8%
Airplane 7.7%
Rail 2.6%
Ship 2.3%
Motorbike 0.5%
Total 46%
Combination of different modes of Transport Per cent of respondents
Private Car and Airplane 7.7%
Private car and Coach 6.5%
Train and Coach 4.4%
Private Car, Airplane and Ship 3.9%
Private car and Train 3.9%
Airplane and Ship 3.7%
Private car and Ship 3.5%
Private car, Airplane and Train 2.8%
Airplane and Coach 2.6%
Coach and Ship 2.3%
Airplane and Train 1.6%
Train, Airplane and Coach 1.2%
Airplane, Coach and Ship 1.2%
Other combinations 8.7%
Table 2 shows how the respondents ranked the different means of transport according to four quality elements, i.e. safety, comfort, speed and relation between quality and price. We used a 10-point scale, where 0 represented “extremely dissatisfied” and 10 “extremely satisfied”. We notice that the higher score in almost all quality elements is attributed to car and airplane. Although the rate of use of the coach (8.8%) is higher than that of the airplane (7.7%), respondents gave higher score to the airplane, which indicates that their choice depends also on different factors such as ease of accessibility. When asked if they know the definition of intermodal passenger transportation, 94% of the respondents answered “no”. When asked if they have ever used such a service, 84% answered “no”. The above reveals that a significant percentage of the respondents had used intermodality; however they did not know how it was called. This triggered the intervention of the survey conductors who explained the essence of intermodality to avoid any subsequent misunderstandings by the respondents. The most common modal combination was air/rail and rail/bus. Moreover, all respondents were satisfied by the level of service provided.
The horizontal axis of Figure 2 shows that 87.5% of the respondents were willing to pay more to be provided with services of intermodal transportation. In particular, 30.9% of the respondents would pay 1-5% of the total cost of the trip, 34.3% would pay 5-10%, and 12.1% would pay 10-20% of the total cost of the trip in order to be offered intermodal transportation. Moreover one out of ten does not care about the cost of such a service in order to enjoy a seamless door-to-door trip experience. This result is rather astonishing given the deep financial crisis faced by Greece: unless the result is spurious (i.e. the respondents were thinking too little when filling the questionnaire), it clearly shows the importance of intermodal solutions for the welfare of the Greek passenger community. In fact, the results of the non-parametric Monte Carlo test show that the demographic variables are correlated with travel-related variables. The frequency of travelling is closely connected with the means of transport the respondents use, since the Fisher’s Exact Test statistic (2-sided) has lower bound 0.003<0.05 and upper bound 0.005<0.05. Cramer’s V statistic is 0.03, which means that the two variables (i.e. frequency of travelling and means of transport the respondents use) are almost perfectly correlated.
Women also travel more often than men, with the exception of frequency 1-2 trips/week, where men dominate. The variable of gender has a strong statistical relationship with travel frequency (Cramer’s V=0.001). The majority of those who travel with their family use their private car. Those who travel alone usually travel mainly by car but at the same time there is almost an equal percentage that uses different combinations of means of transport (more than two modes). Finally, those who travel with company also use more than two means of transportation. Cramer’s V ratio between the means of transport for distances over 100 Km has a strong statistical relationship (0.03) with whom they travel with.
the respondents use for distances over 100 Km are closely statistically related (Cramer’s V equals to 0.00).
The most important question asked is what percentage of the total cost of transportation the respondents were willing to pay to benefit from intermodality (Figure 2). A high percentage of the respondents would pay extra for this service. When the non-parametric test of Monte Carlo was used, we found that this variable depends on the variable “place of residence”. Many cities and villages in Greece face problems of connection and accessibility. That is why people who live in poorly accessible areas greatly value intermodality and are willing to pay for it. Residents in fully accessible areas are less or not willing to pay for it. The Fisher’s Exact Test statistic (2-sided) lower bound equals to 0.032<0.05 and upper bound equals to 0.039<0.05 and the Cramer’s V ratio is 0.557.
Figure 2. Percentage of the total cost of transportation the respondents are willing to pay in order to be offered intermodality cross-examined with the place of residence (n=431).
According to Pitsiava-Latinopoulou and Iordanopoulos (2012) to be sustainable a transport system should take into account the needs of all commuters within an area, trying to provide the best possible travel conditions for all travellers without creating external side effects for the rest of society. Intermodal passenger transportation reinforces “international trade and economic growth, while satisfying the requirements for sustainable development in terms of environmental issues and safety” (Morris, 2003, p.18). In this context, the present paper innovates by considering an additional implication of effective intermodality, namely increased destination competitiveness. Moreover, while the available literature on transport for tourism has focused on predominantly on selective transport modes (e.g. air transport) or at best in intermodal or intra-modal competition (Suarez-Aleman, 2010), this paper steps forward to consider the accessibility implications of considering these modes together.
Although no formal conjoint analysis has been undertaken as in the case of Chiambaretto, Baudelaire and Lavril (2013), the present empirical research did identify that from the 431 respondents 87.5% of them are willing to contribute in covering the costs of related investments. One tenth of respondents do not care about how much this service will cost. Another important finding is that the decision to pay more depends on place of residence and not on gender or profession or age or even on travel habits. This may mean that the respondents’ intention probably shows lack of sensitivity in terms of available income. Even in times of economic recession, tourism (for both business and leisure purposes) is a growing activity as there are people who want to travel seeking a seamless experience. This has important implications for policymakers who should thus aim at improving intermodality to increase destination competitiveness irrespectively of the actual stage of the business cycle as related benefits extend in the longer-term.
findings of the present survey reveal that Greek passengers are ready for such a service, and moreover they are willing to pay for it in spite of the economic crisis. There are some pilot introductions of intermodality in the Greek market. There is a rail-taxi service in Thessaloniki, Volos and Xanthi where rail passengers with those destinations can get a coupon of combined transportation between rail and taxi with a 15% discount on taxi rates through special points of sale. There is also the combination coach/ship. KTEL of Macedonia (National Bus Operator in Northern Greece) offers the possibility of buying tickets of shipping companies inside Macedonia Intercity Bus Station in Thessaloniki.
In order to expand the penetration of intermodality, ambitious programmes have to be implemented from a transport planning perspective (Page, Yeoman, Connell & Greenwood, 2010). These programmes require coordination, funding, taking into consideration environmental issues and user concerns. Furthermore, some barriers have to be addressed. The success of intermodality is subject to the quality of the value delivered to the customers. Intermodality, by definition, must “be embedded in an overall network, delivering convenient door-to-door services” (Vespermann & Wald, 2011, p.1195). According to the Air Transport Action Group (2014) intermodality is high on the political agenda in Europe and increasingly so in other parts of the world, since it plays an important role by enabling better mobility for the traveller and solving many transport problems like emissions and noise.
Up until recently, for most parts of the world, intermodal efforts focused primarily on freight logistics. Nonetheless, it is increasingly recognized that the benefits of an intermodal approach already realized in the freight transportation industry can be extended into the passenger transportation arena. As claimed by Papatheodorou (2001b, p.164) “destination choice has always been a central issue” in the transport management literature, so destinations should be made as accessible as possible. Whether or not passenger services are provided by the private sector or by the government, thinking in terms of providing a seamless, door-to-door service through a combination of integrated modes must be a part of present and future planning activities.
passenger transportation. Although the explicit focus on Greek travellers should be acknowledged as a limitation of the empirical part of the paper, there are still important implications for inbound tourism too. In fact, those tourists interested in all-inclusive packages offering integrated tourism services in large hotel complexes are unlikely to care about the existence of intermodal solutions. On the other hand, free independent travellers and/or those interested in exploring Greece beyond certain key areas are expected to focus on public transport alternatives and intermodal facilities. From a strategic destination perspective focusing on these very travellers makes good sense as they contribute to the rise of the tourism multiplier and the spread of tourism benefits in a wider spatial context (Stabler et al., 2010). On these grounds and based on a proper cost-benefit analysis it may prove the case that intermodality can indeed lead to an increased competitiveness of Greek tourism destinations per se and the country as a whole.
References
Anastasiadou M., Dimitriou D., Fredianakis A., Lagoudakis E., Traxanatzi G. & Tsagarakis K. (2009). Determining the parking fee using the contingent valuation methodology. Journal of Urban Planning and Development, 135(3), 116-124. Angelis, V.Α. & Gaki E. (1999). The effect of transportation networks on
regional development: the case of Greece. Studies in Regional and Urban
Planning, 7, 153 -165.
Chiambaretto, P. & Decker, C. (2012). Air – rail intermodal agreements: balancing the competition and environmental effects. Journal of Air Transport Management, 23, 36-40.
Chiambaretto, P., Baudelaire, C., & Lavril, T. (2013). Measuring the willingness-to-pay of air-rail intermodal passengers. Journal of Air Transport Management, 26, 50-54.
Dacko, S. G. & Spalteholz, C. (2014). Upgrading the city: enabling intermodal travel behaviour. Technological Forecasting and Social Change, 89, 222-235.
Dattalo, P. (2010). Strategies to approximate random sampling and assignment. New York: Oxford Univercity Press.
Dimitriou D., Voskaki A., & Sartzetaki M. (2014). Airports environmental management: results from the evaluation of European airports environmental plans, International Journal of Information Systems and Supply Chain
Management, 7(1), 1-14.
Ecorys (2006). Study on strategic evaluation on transport investment priorities under structural and cohesion funds for the programming period 2007-2013, Rotterdam: Ecorys.
Eurostat (2003). European statistics from A to Z , Brussels: Eurostat.
Givoni, M. & Banister, D. (2006). Airline and railway integration. Transport Policy, 13, 386-397.
Holloway, J. C. (2004). Marketing for tourism, Harlow: Prentice Hall.
Kothari, C. R. (2004). Research methodology, methods and techniques. New Delhi: New Age International.
Kyriazi, N. (2011). Social research: critical review of methods and techniques (in Greek). Athens: Pedio.
Macharis, C., Pekin, E. & Rietveld, P. (2011). Location analysis model for Belgian intermodal terminals: towards an integration of the modal choice variables.
Procedia Social and Behavioral Sciences, 20, 79-89.
Morris, P. (2003). Air/ rail intermodality study (final report), London: IATA.
Müller, G., Riley, P., Asperges, T. & Puig-Pey, P. (2004). Towards passenger intermodality in the EU, recommendations for advancing passenger
intermodality in the EU (Report 3), Dortmund: European Commission.
Liu, C. H., Tzeng. G. H., Lee, M. H. & Lee, P. Y. (2013). Improving metro-airport connection service for tourism development: using hybrid MCDM models.
Tourism Management Perspectives, 6, 95-107.
Page S., J. (1999). Transport for tourism. London: Cengage Learning
Page, S. J. & Lumsdon, L. (eds.) (2004). Tourism and transport: issues and agenda for
the new millennium, Boston: Elsevier.
Page, S. J., Yeoman, I., Connell, J., & Greenwood, C. (2010). Scenario planning as a tool tounderstand uncertainty in tourism: the example of transport and tourism in Scotland in 2025. Current Issues in Tourism, 13(2), 99–137.
Papatheodorou, A. (2001a). Tourism, transport geography and industrial economics: a synthesis in the context of mediterranean islands. Anatolia, 12 (1), 23-34.
Papatheodorou, A., (2001b). Why people travel to different places? Annals of Tourism
Research, 28(1), 164-179.
Petrakos, G. & Tranos, E. (2008). Egnatia odos and regional development: a theoretical and experimental study. Review of Economic Science, 14, 127-160.
Pitsiava-Latinopoulou, M., & Iordanopoulos, P. (2012). Intermodal passengers terminals: design standards for better level of service. Procedia - Social and
Behavioral Sciences 48, 3297 – 3306
Profilidis, Β. (2008). Economics of transportation (in Greek). Athens: Papasotiriou. Research Institute of Regional and Urban Development, Building and Construction of
the Federal State of North Rhine-Westphalia (2004). Towards passenger intermodality in the eu, analysis of the key issues for passenger intermodality
(report 1), Dortmund: European Commission.
Riley, P., Bührmann, S. & Christiaens, J. (2010). Intermodal passenger transport in europe passenger intermodality from A to Z, the european forum on intermodal
Román, C., & Martín, J. C. (2014). Integration of HSR and air transport: understanding passengers’ preferences. Transportation Research Part E, 71, 129-141.
Stabler, M., Papatheodorou, A. & Sinclair, M. T. (2010). The Economics of tourism, second edition, London: Routledge.
Suarez-Aleman, A. (2010). The role of intermodal and intramodal transport competition in the choice of tourist destinations. XIV Encuentros de Economia Aplicada, working paper.
Vespermann, J. & Wald, A. (2011). Intermodal integration in air transportation: status quo, motives and future developments. Journal of Transport Geography, 19, 1187–1197.
World Economic Forum (2013). The Travel & Tourism Competitiveness Report 2013,
reducing barriers to economic growth and job creation, Geneva: World
Economic Forum.
Internet References
Air Transport Action Group (2014). Intermodality. Available online http://www.atag.org/our-activities/intermodality.html, accessed on 22/09/2014. Athens International Airport (2014). About us, Available online http://www.aia.gr ,
accessed on 30/05/2014.
Eurostat (2012). Passenger transport statistics. Available online, http://epp.eurostat.ec.europa.eu/statistics_explained/index.php/Passenger_transp ort_statistics, accessed on 27/05/2013.
Hellenic Civil Aviation Authority (2013). Airports annual statistics 1992 – 2012. Available online http://www.ypa.gr/content/index.asp?tid=683, accessed on 27/05/2013
Hellenic Railways Organisation, (2013). Hellenic Railways Organisation. Available
online (in Greek):
http://www.ose.gr/el/%CE%91%CF%81%CF%87%CE%B9%CE%BA%CE% AE%CE%A3%CE%B5%CE%BB%CE%AF%CE%B4%CE%B1/%CE%A4% CE%BF%CE%94%CE%AF%CE%BA%CF%84%CF%85%CE%BF%CF%84 %CE%BF%CF%85%CE%9F%CE%A3%CE%95.aspx , accessed 10/10/2013. International Monetary Fund (2014). World economic outlook database: Greece,
Available online
http://www.imf.org/external/pubs/ft/weo/2014/02/weodata/index.aspx, accessed 05/05/2014.
World Bank (2013). Passenger cars (per 1,000 people). Available online http://data.worldbank.org/indicator/IS.VEH.PCAR.P3, accessed on 27/05/2013
Marina Efthymiou & Andreas Papatheodorou (2015) Intermodal passenger transport and destination competitiveness in Greece, Anatolia, 26:3, 459-471, DOI:
10.1080/13032917.2015.1012171