http://www.sciencepublishinggroup.com/j/ijsedu doi: 10.11648/j.ijsedu.20190704.13
ISSN:2376-7464 (Print); ISSN: 2376-7472 (Online)
The Role of English Language Proficiency as Determinant
of PGDT Candidate Academic Performance Across
Selected Public Universities of Ethiopia
Fuad Ali
1, *, Hailemichael Lemma
1, Desalegn Motbaynor
2 1Department of Curriculum and Instruction, Debre Berhan University, Debre Berhan, Ethiopia
2Department of Educational Planning and Management, Debre Berhan University, Debre Berhan, Ethiopia
Email address:
*
Corresponding author
To cite this article:
Fuad Ali, Hailemichael Lemma, Desalegn Motbaynor. The Role of English Language Proficiency as Determinant of PGDT Candidate Academic Performance Across Selected Public Universities of Ethiopia. International Journal of Secondary Education.
Vol. 7, No. 4, 2019, pp. 107-115. doi: 10.11648/j.ijsedu.20190704.13
Received: August 19, 2019; Accepted: October 31, 2019; Published: November 26, 2019
Abstract:
The purpose of this study was to assess the role of English language proficiency on academic performance of Post Graduate Diploma in Teaching (PGDT) candidates. Random and available sampling techniques were employed. Accordingly, 50 candidates’ (41 male, 9 female) and two public Universities were sampled. Secondary data of candidates were obtained from the archives of sampled Universities’ registrar office. Simple linear regression and multiple linear regression analysis techniques were used. Language proficiency, University, grade point average, gender and University entry grade point were used as independent variables for multiple regression analysis; while academic performance was used as dependent variable. In the simple linear regression analysis, language was the only independent variable; whereas academic performance was the dependent variable. The study confirmed that language proficiency was found to be statistically significant predictor of academic performance with simple regression analysis with R Square (r2) value of 9.3% and sig’ value of P=.032. In multiple regression analysis, the model was also found to be statistically significant predictor of academic performance with r2=56.6% and P<.000. Accordingly, implications and recommendations of the study were discussed and forwarded.Keywords:
Explanatory Variable, Linear Regression, Multiple Regressions, Outcome Variable, Predictor, Proficiency1. Introduction
Quality of education which is measured in terms of students exam score for the current case could be affected by enormous factors such as language skill, students’ socio economic background, teacher effectiveness, methodology, student’s interest, school/institution quality among others [4, 12, 22]. Among the aforementioned factors, language proficiency is considered as one of the most determinants of students’ academic performance which is the concern of this study.
It is understandable that language skill is a tool and key to grasp academic concepts across disciplines. In the absence of language proficiency, it would be unthinkable to understand and know the meaning and concept of any subject concept within the academic world [15]. Currently, English language
has been one of the most widely used medium of communication and instruction among many countries of the glob [4, 12]. Over the last four decades, the use of English language as a medium of international communication through various electronic and printed media unprecedentedly has been paramount. Particularly, the role of the language towards accelerating the happening of globalization is indispensable. However, with the exception of few countries, many of the countries use English as their second language which in turn imposes difficulty to master and adequately exploit its use as medium of communication and instruction.
further investigation [13]. Uncertainties of research findings raise questions on the extent of English Language Proficiency (ELP) threshold to adequately predict academic success and the specific academic discipline that highly demands the competency of the language skill more than other academic disciplines and why? Such questions are the areas where more scientific research needs to be conducted for further explanation and confirmation of the complex association of ELP and students’ academic performance.
At international level, Testing of English as Foreign Language (TOEFL), International English Language Testing System (IELTS), and English for Specific Purposes (ESP) are the prominent and well recognized language proficiency indicators for international students’ scholarship competition [12, 13]. Particularly English speaking Western countries including Australia, demand certificate of such international language proficiency confirmation as a precondition to admit international students with in their reputable universities [21]. The underlined assumption to do so is that English proficiency is considered as an indicator of students’ academic performance in major subject courses [15, 19]. On the contrary, there are also conflicting research findings claiming that ELP does not have an association with academic performance of students [18]. Based on the findings of the past literature and personal experience, it is possible to infer that ELP would have an association with academic performance being language as one of predictors of students’ academic success with other determinant factors as well. But the issue needs to be raised here is, about the extent of predictive potential of ELP on academic performance of students. To this effect, conducting such studies on the contribution of ELP on academic performance would be worth for further scientific findings and betterment of students learning as of the current one under discussion.
In Ethiopia, English language is taught as a foreign language course at primary level, whereas at secondary and tertiary levels English language is used as a medium of instruction for all academic courses except the home language courses [19, 24]. Nevertheless, English is a second language for Ethiopian students who don’t have conducive environment to practice and master it, outside the classroom [4, 5]. Such impediment factors together with other language proficiency shortcomings (school, socio-economic background, and teacher related factors) would affect students’ academic achievement and thereby causes for deterioration of educational quality of the nation [19].
For example, according to the national assessment of English language proficiency test for grade 10 and 12 students; 86.2% of grade 10 and 65.1% of grade 12 students scored below the minimum standard (50%) [19]. In this regard, primary, secondary, and even some of the higher education teachers do not have the required proficiency of the language to properly impart the subject matter knowledge for their students [4, 10].
Hence, English language proficiency limitation of students has a direct repercussion on academic performance of other subjects. Therefore, it would be worth looking for
intervention mechanism supported by scientific findings as of the current study. On the basis of the above intention the current study tried to answer the following basic research question.
1.To what extent English language proficiency predicts students’ academic performance?
2.Is there a significance variation among sample students in mastering of English language proficiency and predicting academic performance across universities? Some of the Operational definitions of terms used in this study were the following:
1.Academic performance: Refers to placement examination score of PGDT candidates on their major subject areas.
2.English language proficiency: Refers to two categories of English language examinations prepared nationally as described below:
a)University entry English examination result of PGDT students which is obtained from grade 12 university entry exam profile
b)PGDT placement examination of General English language result of PGDT candidate students
3.PGDT: Refers to Post Graduate Diploma in Teaching program which is provided for first degree holder to be teachers.
2. Materials and Methods
2.1. Research Design
Correlation design and quantitative method were selected because of its appropriateness to fit to the nature of the research title, purpose, questions and the variables which are going to be treated as independent and dependent variables.
Correlation is a preferable design to describe and analyse the attitudes, opinions, relationships or association, behaviours, or characteristics of the population by using descriptive and inferential statistical packages [8]. There are two basic types of correlation research designs known as explanatory and prediction. Prediction design is preferable for this study to identify one or more variables that can predict changes in another variable measured at a later point in time rather than simultaneous occurrence of variables’ relationships. Hence, English language proficiency as variable of the current study is supposed to be predictor or forecaster of PGDT students’ academic performance at their placement examination as prospective candidates of PGDT program.
2.2. The Study Area and Period
The study was carried out in two public Universities of Ethiopia namely, Addis Ababa and Debre Berhan. Data collection was conducted from September to March 2016/2017.
2.3. Population and Sampling
Ethiopia public universities, which run PGDT program since 2013 and all PGDT candidates who were recruited as candidates of studying PGDT in these universities were population of the study.
Under the umbrella of the multistage sampling technique, cluster sampling and simple random sampling techniques were employed. Accordingly, the 31public universities (8 first generation/old, 13second generation/intermediate, 10 third generation/new), were clustered in to three categories (old, intermediate, and new). One sample university from the first two categories excluding the new category was selected by using simple random technique. Among the old, Addis Ababa University (AAU); and from the intermediate, Debre Berhan University (DBU) was selected through random sampling technique. However, the 10 very newly opened public universities (opened in 2012) were excluded from the sample population of the study because of the fact that they had not yet reached on the level of producing the target student population of the study.
Among the whole programs of PGDT (social sciences, languages, natural sciences), Geography department was selected purposively mainly because of the reason that the discipline of geography is considered as an intermediate subject between social and natural science discipline (Smith, 2004). Fifty sampled students’ data profiles (41 male and 9 female) were selected through available sampling techniques and used for the analysis.
2.4. Instruments
Data collection instrument was merely recorded documents which were obtained from the Ministry of Education (MOE) and sampled Universities. In this regard PGDT entrance/placement examination result of 2014 academic year and their University entry grade point (EHEECE result) were collected.
2.5. Data Processing and Analysis
Both descriptive and inferential statistics were used as instruments of data analysis techniques of the current study. Descriptive statistical techniques such as mean/median/mode, standard deviation (measure of variability) and graphs were used. Graph was used to show the relationship that is assumed to exist between the dependent and independent variables of the current study. Inferential statistic was employed to analyse the data by using simple linear regression and multiple linear regression statistical analysis techniques. Simple and multiple linear regression techniques were found to fit with the research title, questions and purposes. Therefore, the data were analysed using both descriptive and inferential statistical techniques through recent Statistical Package in Social Science (SPSS) version 20 software.
To analyse the association between the predictor and the outcome variables, the following simple and multiple linear regression equation was employed:
Y = A+B1X2+B2X2+……..BnX n
Where,
Y = the dependent variable (students’ academic performance/placement exam score of PGDT);
A = the intercept or the value of Y when the value of independent variables (X) is zero;
B1 = the coefficient for independent variable X1 (English
language proficiency exam result)
B2 = the coefficient for independent variable X2
(University)
Considering educational and social science research literatures, the “alpha” level of the current study was determined to be 0.05 in which the whole analysis of the study depends on it as cut point of significance level. Therefore, if the P-value level is greater than 0.05 the null hypothesis would be accepted; while the alternative hypothesis would be rejected and the study would not also be statistical significance and the vice versa.
3. Results
3.1. Descriptive Statistical Analysis of Data
The results of the study were presented as follows:
3.1.1. Language Across Universities
Table 1. Mean score of language across universities.
University Mean N Std. Deviation
1st generation(Addis Ababa) 44.81 32 6.967
2nd generation(DBU) 36.94 18 5.589
Total 41.98 50 7.490
Table 2. Mean score of language across gender.
Gender Mean N Std. Deviation
Male 42.78 41 7.680
Female 38.33 9 5.523
Total 41.98 50 7.490
As indicated in tables 1 and 2 above, among 50 sampled data, 32 (M=29, F=3) were from the 1st generation university; while the remaining 18 (M=12, F=6) were from the 2nd generation university. The descriptive statistics indicates that the mean score of language performance of the candidates was 41.98. Whereas, the comparison of language score across university and gender illustrates that mean score of male candidates was 42.78 and female candidates’ score was 38.33; in case of university 1st generation university candidates scored 44.81 average marks, whereas that of the 2nd generation candidates scored mean marks of 36.94.
3.1.2. Performance Versus Gender
Table 3. Performance versus Gender.
Gender Mean N Std. Deviation
Male 47.4390 41 8.51193
Female 40.1556 9 6.97193
Total 46.1280 50 8.66435
of gender, it shows that male students irrespective of their institution outperformed against their female counter parts in which the average score of male is 47.44, whereas that of female is 40.16.
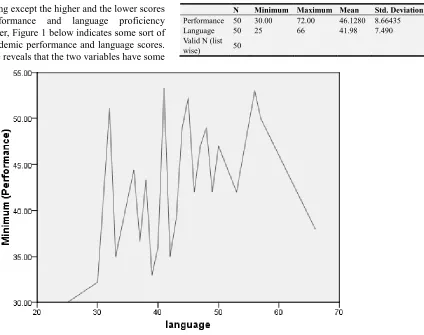
The average academic performance of Post Graduate Diploma in Teaching (PGDT) candidates accounts 46.13%, whereas language proficiency of the same students is 41.98 %. Such variation of mean scores observed in Table 2 could not tell anything except the higher and the lower scores of academic performance and language proficiency respectively. However, Figure 1 below indicates some sort of pattern between academic performance and language scores. Therefore, the figure reveals that the two variables have some
sort of positive correlations. In this respect, this would be safe to claim that if there is an increase of language proficiency, there would be an increase of academic performance. Irrespective of this pattern, there is also little exceptionality which show that low language score resulted in high academic performance score (See Figure 1).
Table 4. Performance in terms of language.
N Minimum Maximum Mean Std. Deviation
Performance 50 30.00 72.00 46.1280 8.66435
Language 50 25 66 41.98 7.490
Valid N (list
wise) 50
Figure 1. Pattern of performance versus language.
Table 5. Academic performance in relation to university.
University Mean N Std. Deviation
1st generation(Addis Ababa) 46.6563 32 9.04330
2nd generation(DBU) 45.1889 18 8.11120
Total 46.1280 50 8.66435
Table 5 above shows that the average score of academic performance of the 1st generation university candidates is about 46.66, whereas the 2nd generations mean score is about 45.19. Even though, it is not yet statistically confirmed, practically the difference between the institution academic scores is not that much sound. This slight difference may be the attribution of different factors such as students’ background, institutional related factors, or other latent variables. Moreover, academic performance across universities reveals inverse relationship, in which when the line projects from 1st generation to the 2nd, academic score of PGDT candidates decrease and the vice versa.
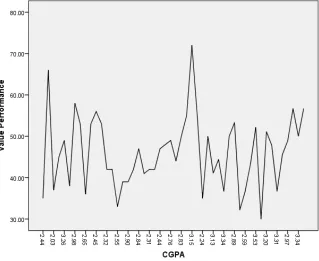
3.1.3. Academic Performance and CGPA
Table 6. Relationship of academic performance and CGPA.
N Minimum Maximum Mean Std. Deviation
Performance 50 30.00 72.00 46.1280 8.66435
CGPA 50 2.03 3.76 2.8602 .41618
Valid N (list
wise) 50
case, CGPA as an independent variable seems to be a predictor of academic performance. But there are also some exceptional scores in which a high score of CGPA may not
be always a predictor of high academic performance; that is why the projected line does have a number of curved points.
Figure 2. Academic performance and CGPA.
3.1.4. Academic Performance and Entry Point
Table 7. Academic performance and entry point.
N Minimum Maximum Mean Std. Deviation
Performance 50 30.00 72.00 46.1280 8.66435
Entry 50 297 454 365.36 36.849
Valid N (list
wise) 50
Figure 3. Academic performance and entry points.
Irrespective of other variables (gender, university etc), the mean score of entry grade point of the candidates is 365.36 with 36.8549 Std. deviation as indicated in table 7 above. In this regard, it would not be possible to talk about the relationship of
academic performance versus entry point of candidates. Therefore, it would be good to look at Figure 3 where the line that projected in the positive direction of the y and x axis; and this line indicate a direct relationship of performance and entry grade points. But at this point, it is not supportive to claim the extent of relationships exist between the two variables without rigorously analyzing it with sound statistical techniques which was done in the next inferential statistical section of the study.
3.2. Inferential Statistical Analysis of Data
In this sub section, dominantly two categories of regression analysis notably simple linear regression and multiple linear regressions were analysed.
3.2.1. Simple Regression Analysis
Table 8. Model Summary of simple regression.
Model R R Square Adjusted R Square Std. Error of the Estimate
1 .304a .093 .074 8.33875
a. Predictors: (Constant), language b. Dependent Variable: Performance
Table 9. ANOVA table of simple regression ANOVAa.
Model Sum of Squares df Mean Square F Sig.
1
Regression 340.812 1 340.812 4.901 .032b
Residual 3337.669 48 69.535
Total 3678.481 49
Table 10. Coefficient of simple regression Coefficientsa.
Model
Unstandardized Coefficients
Standardized
Coefficients t Sig. B Std. Error Beta
1 (Constant) 31.347 6.780 4.623 .000
language .352 .159 .304 2.214 .032
a. Dependent Variable: Performance
The model summary table of simple regression indicates that the coefficient of determination or variance which is represented by R Square (r2) is equal to.093. This value tells that 9.3% of the variance is explained by the model or explanatory variable. Therefore, the remaining 90.7% of the variance on academic performance was determined by unknown variables or factors or latent variables. The ANOVA output table confirmed that language was slightly statistically significant predictor of academic performance
with ‘sig.’ value of.032 which is less than the alpha threshold value of.05 and symbolically represented by F1, 48= 4.901, P<.05 (Table 9).
3.2.2. Multiple Regression Analysis
In this sub section the combined effect of the independent variables against the dependent variable was analysed and predictive potential of the explanatory variables was also determined.
Table 11. Anova of multiple regression Anovaa.
Model Sum of Squares df
Mean
Square F Sig.
1
Regression 2082.644 5 416.529 11.484 .000b
Residual 1595.837 44 36.269
Total 3678.481 49
a. Dependent Variable: Performance
b. Predictors: (Constant), University, Gender, language, CGPA, Entry
Table 12. Model summary of multiple regressions.
Model R R Square Adjusted R Square Std. Error of the Estimate Change Statistics
R Square Change F Change df1 df2 Sig. F Change
1 .752a .566 .517 6.02238 .566 11.484 5 44 .000
a. Predictors: (Constant) University, Gender, language, CGPA, Entry b. Dependent Variable: Performance
As the summary model indicates the value of R2 is.566 which implies that 56.6 % of the variance is explained by the explanatory variables (University, Gender, language, CGPA, Entry). From this statistical figure, it is possible to infer that the model was found to be statistically significant predictor
of performance with sig. value of.000. Moreover, the variability table (Table 11) confirmed the existence of statistically significant variability among the variables which could be symbolically represented by F5, 44=11.484, P<.000.
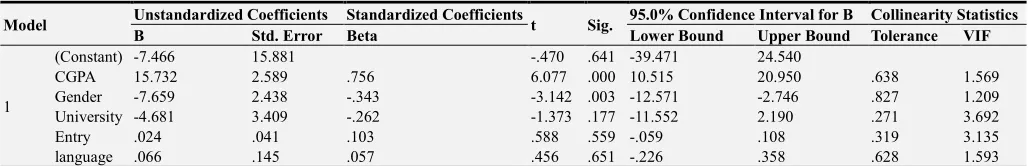
Table 13. Coefficient of determination in multiple regression Coefficientsa.
Model Unstandardized Coefficients Standardized Coefficients t Sig. 95.0% Confidence Interval for B Collinearity Statistics B Std. Error Beta Lower Bound Upper Bound Tolerance VIF
1
(Constant) -7.466 15.881 -.470 .641 -39.471 24.540
CGPA 15.732 2.589 .756 6.077 .000 10.515 20.950 .638 1.569
Gender -7.659 2.438 -.343 -3.142 .003 -12.571 -2.746 .827 1.209
University -4.681 3.409 -.262 -1.373 .177 -11.552 2.190 .271 3.692
Entry .024 .041 .103 .588 .559 -.059 .108 .319 3.135
language .066 .145 .057 .456 .651 -.226 .358 .628 1.593
a. Dependent Variable: Performance
For the sake of comparison among and between variables, coefficient of determination was analysed (see Table 13). From the coefficient Table13, the second column under the heading of unstandardized coefficient and sub heading of ‘B’, there are lists of figures corresponding to the respective predictor variables. Accordingly, the value of language for example=.066, Gender=-7.659, Entry=.024, CGPA=15.732 and University = -4.681. However, these figures could not be used for the purpose of comparison mainly because of the reason that they don’t have the similar measurement of value of the variables; that is why the heading of the column is entitled as ‘unstandardized’. Therefore, these values are used for the purpose of comparison only with variable itself rather than across variables.
For example, the value of language is.066 which implies that an increase of 1 point language score would increase.066
point score of academic performance. The figure that does not have negative sign indicates that there is a direct relationship between language proficiency and academics performance. Gender value is -7.659 which implies that female students performed an average of 7.659 scores less than their male counter parts. Entry coefficient is .024 which indicates that for 1 point increase of entry point; there is an increase of .024 increase of academic performance. In case of CGPA, there is 15.732 coefficients which tells that for 1 point increase of CGPA, there is an increase of 15.732 score of academic performance. The coefficient of university is -4.681 which ensures that the 2nd generation university students scored an average of 4.681 less than that of the 1st generation university students.
corresponding to each of the predictor variables. Therefore, these figures are used for the purpose of comparison across variables; because these figures are already standardized by the SPSS model itself. What a reader should bear in mind here is that ignoring the negative sign indicated in some of the values and only considering the absolute values of the figure and then compares extent of prediction by using the magnitude of the values. The negative sign simply indicates the direction rather than the extent of determination or prediction of the variables.
Among the five predictor variables, only two variables (gender and CGPA) are found to be statistically significant predictors of the outcome variable. However, the rest three variables (language, entry and university) are not statistically significant predictors of the outcome variable.
To determine the degree of prediction among the listed predictor variables, it is worth to compare the ‘Beta’ values. Therefore, CGPA is the strongest predictor of the outcome variable because its value (.756) is the strongest value among the rest values. While gender is the 2nd strong predictor; university is the 3rd strong predictor; entry is the 4th and language is the weakest predictor of the outcome variable among the independent variables analysed (See Table13).
4. Discussion and Implications
Literature shows that the impact of language proficiency on students’ academic performance is mixed results. In some cases language proficiency reveals significant predictor of
academic performance, whereas in other cases it shows insignificant predictor of academic performance. For example, a study conducted on the impact of language on academic performances of undergraduate students in Somalia indicates that English language has insignificant predictor value of academic performance [2]. On the contrary, a study conducted on the impact of English language proficiency on academic performance among international students, in north central Louisiana in the United States indicates that there is statistically significant predictor value [14]. Similarly a study conducted in Saudi Arabia among medical preparatory students, indicates that English language proficiency has a positive correlation with academic performance [3]. With the same manner, simple linear regression analysis of this study ensures that language proficiency is significant predictor of PGDT students’ academic performance.
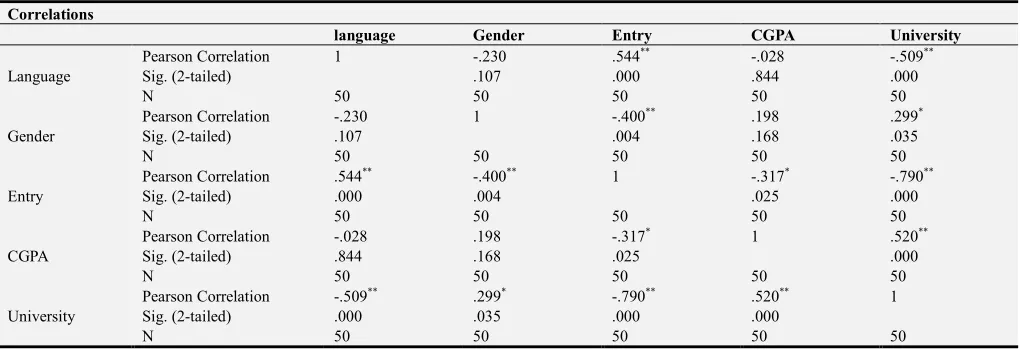
However, in multiple regression analysis, language proficiency could not confirm statistically significant predictor of academic performance. Analysis of correlation of independent variables by using bivariate data analysis techniques confirmed that language significantly correlated with variables of entry and university. Therefore, analysis of multiple regression of the three independent variables (CGPA, gender and language) and making constant the two significantly correlated variables (entry and university) assured that language is also statistically significant predictor of academic performance as observed in simple linear regression analysis (see Table 14).
Table 14. Correlation of variables.
Correlations
language Gender Entry CGPA University
Language
Pearson Correlation 1 -.230 .544** -.028 -.509**
Sig. (2-tailed) .107 .000 .844 .000
N 50 50 50 50 50
Gender
Pearson Correlation -.230 1 -.400** .198 .299*
Sig. (2-tailed) .107 .004 .168 .035
N 50 50 50 50 50
Entry
Pearson Correlation .544** -.400** 1 -.317* -.790**
Sig. (2-tailed) .000 .004 .025 .000
N 50 50 50 50 50
CGPA
Pearson Correlation -.028 .198 -.317* 1 .520**
Sig. (2-tailed) .844 .168 .025 .000
N 50 50 50 50 50
University
Pearson Correlation -.509** .299* -.790** .520** 1
Sig. (2-tailed) .000 .035 .000 .000
N 50 50 50 50 50
**. Correlation is significant at the 0.01 level (2-tailed). *. Correlation is significant at the 0.05 level (2-tailed).
5. Conclusion
On the basis of the data analysis conducted in this study and under the framework of the research questions crafted, the following conclusions were drawn:
1.English language proficiency has slightly a positive correlation with students’ academic performance of the sampled students
2.There is no statistically significant correlation between
English language proficiency and University.
6. Recommendations
1.As the mean score of candidates of this study is 41.98 which implies that it is 8.02 score below from the minimum cut of point (50%). Because of this, extra English language trainings and tutorial programs need to be arranged and provided by university’s concerned bodies for those 1st year university students particularly those who lack the minimum threshold of language proficiency.
2.Establishing and strengthening English Language Improvement Canters especially for freshman students should be worthwhile.
3.Remedial action on language proficiency is recommended especially for female students and 2nd generation students more than their counter parts, because their language scores is minimal compared to their counter peers of 1st generation students and male students in general.
4.It is good to revisit and revise the quality of English language subject taught at primary and secondary schools.
Author’s Contributions
HL is a principal Investigator of the study, while FA and DM, are co-investigator of the study. Conversely, the overall process of the research was conducted with the participation of all authors.
Disclosure
All the authors do not have any possible conflicts of interest.
Acknowledgements
The study was conducted with the financial support obtained from Debre Berhan University. The authors are so very grateful to Debre Berhan University for financial support.
References
[1] Ali, S. M., Deuren, R. V., Kahsu, T.,&Woldie, W.(2013). Capacity Development in Higher Education: New Public Universities in Ethiopia. Working Paper No. 2013/24. Maastricht School of Management.
[2] Addow, A. M., Abubakar. A. H., & Abukar, M. S. (2013). English Language Proficiency And Academic Achievement For Undergraduate Students In Somalia. Faculty of Business and Accountancy, SIMAD University, Mogadishu, SOMALIA. Educational Research International, 2 (2), ISSN-L: 2307-3713.
[3] Amin, T. T., Balaha, M., Kaliyadan, F., & Rao, P. S. (2015). English language proficiency and academic performance: A study of a medical preparatory year program in Saudi Arabia. Journal of Medicine, DOI: 10.4103/2231-0770.165126 [4] Bachore, M. M. (2015). The status, roles and challenges of
teaching English language in Ethiopia context: the case of selected primary and secondary schools in Hawassa University technology village area. International Journal of Home Science, 1 (2), 86-90.
[5] Bogale, B. (2009). Language Determination in Ethiopia: What Medium of Instruction? Proceedings of the 16th International Conference of Ethiopian Studies. Addis Ababa.
[6] Brewer, M. B., &Crano, W. D. (2002). Principles and Methods of Social Research (2nd ed). Mahwah, New Jersey: Lawrence Erlbaum Associates, Inc.
[7] Cohen, L., Manion, L., & Morrison, K. (2005). Research methods in education (5th ed). London and New York. [8] Creswell, J. W. (2012). Education research: planning,
conducting, and evaluating quantitative and qualitative research (4th ed). University of Nebraska–Lincoln, Pearson. [9] Creswell, J. W. (2003). Research Design: Qualitative,
Quantitative and Mixed Methods Approaches (2nd Ed). Sage Publications.
[10] Dagnew, T. (2012). English Language Education: 1974 to Present. Report presented on the conference entitled “Enhancing the Quality of English Language Education in Ethiopia”. The Institute of International Education and Ambo University.
[11] Gale, T., & Molla, T. (2014). Inequality in Ethiopian higher education: reframing the problem as capability deprivation. Discourse: Studies in the Cultural Politics of Education, DOI: 10.1080/01596306.2013.871447.
[12] Haghdoost, A,. Kashanian, N. M., Maleki, A., Sadeghi, B. (2013). English Language Proficiency as a Predictor of Academic Achievement among Medical Students in Iran. Theory and Practice in Language Studies, 12 (3), 2315-2321. [13] Hill, K., Lynch, B., & Storch, N. (1999). A comparison of
IELTS and TOEFL as predictors of academic success. International English language testing system (IELTS) research reports. Territory: IELTS Australia Pty Limited. [14] Hwang, E., Martirosyan, N., & Wanjohi, R. (2015). Impact of
English Proficiency on Academic Performance of International Students. Journal of International Students, 1 (5), pp. 60-71.
[15] Jordaan, W., Stephen, D., & Welman, J. (2004). English language proficiency as an indicator of academic performance at a tertiary institution. SA Journal of Human Resource Management, 2 (3), 42-53.
[16] Lodico, M. G., Spaulding, D. T., &Voegtle, K. H. (2006). Methods in Educational Research: From Theory to Practice. Sansfrasisco: Jossey-BassA Wiley Imprint.
[17] Ministry of Education. (2010). Education Sector Development Program IV. Addis Ababa.
[18] Morin, K., Schiffman, R., Torregosa, M. B., Ynalvez, M. A. (2015). English-Language Proficiency, Academic Networks, and Academic Performance of Mexican American Baccalaureate Nursing Students. Nursing Education Perspectives, 1 (36), 8-15.
[20] Neuman, W. L. (2007). Basics of social research: qualitative and quantitative approaches (2nd ed). Pearson Education, Inc. [21] Seelen, L. P. (2002). Is performance in English as a second
language a relevant criterion for admission to an English medium university?Higher Education 44: 213–232.
[22] Sheibani, O. b. (2012). Language Learning Motivation among Iranian Undergraduate Students. World Applied Sciences Journal, 19 (6), 838-846.
[23] Smith, F. (2004). “It's not all about grades”: accounting for gendered degree results in geography at Brunel University. Journal of Geography in Higher Education, 28 (2), 167–178. [24] TGE. (1994). Federal Democratic Republic Government of