Proceedings
of
the
Nutrition
Society
The Annual Meeting of BAPEN with the Nutrition Society was held at Harrogate International Centre, Harrogate on 29–30 November 2011
Conference on ‘Malnutrition matters’
Nutrition Society Symposium: Muscle wasting with age: a new challenge in
nutritional care; part 1 – the underlying factor
Ageing and taste
Lisa Methven
1*, Victoria J. Allen
2,3, Caroline A. Withers
1and Margot A. Gosney
2,31Department of Food and Nutritional Sciences, University of Reading, Reading RG6 6AP, UK
2Clinical Health Sciences, University of Reading, London Road, Reading RG1 5AQ, UK
3The Royal Berkshire NHS Foundation Trust, Reading RG1 5AN, UK
Taste perception has been studied frequently in young and older adult groups. This paper systematically reviews these studies to determine the effect of ageing on taste perception and establish the reported extent of sensory decline. Five databases were searched from 1900 to April 2012. Articles relating to healthy ageing in human subjects were included, reviewed and rated (Downs and Black scoring system). Sixty-nine studies investigated the effect of ageing on taste perception; forty examined detection thresholds of which twenty-three provided sufficient data for meta-analysis, eighteen reported identification thresholds and twenty-five considered supra-threshold intensity perception. Researchers investigating detection thresholds considered between one and thirteen taste compounds per paper. Overall, the consensus was that taste
detection thresholds increased with age (Hedges’ g=0.91, P<0.001), across all taste
mod-alities. Identification thresholds were reported to be higher for older adults in seventeen out of eighteen studies. Sixteen out of twenty-five studies reported perception of taste intensity at supra-threshold levels to be significantly lower for older adults. However, six out of nine studies concerning sucrose found perceived intensity of sweet taste not to diminish with age. The findings of this systematic review suggest taste perception declines during the healthy ageing process, although the extent of decline varies between studies. Overall, the studies
reviewed had low Downs and Black scores (mean 16 (SD 2)) highlighting the need for more
robust large scale and longitudinal studies monitoring the impact of ageing on the sensory system, and how this influences the perception of foods and beverages.
Age: Taste: Threshold: Detection: Intensity
Older adults are at risk of under nutrition due to a multi-tude of physiological, psychological and socio-economic factors. Physiological factors are diverse, such as malab-sorption of nutrients, infection, dysphagia, as well as loss of appetite and sensory decline. Older people frequently complain of blandness of foods or sensory changes that may influence their liking and subsequent consumption of
food, further impacting on their risk of malnutrition(1).
Previous researchers have used taste enhancement, aiming to increase liking and consumption of meals by older
adults, with conflicting results(2,3). Therefore, in order to
develop foods leading to improved liking and consumption by older adults, analysis of age-related changes in taste perception is essential. This paper systematically reviews the evidence for deterioration of taste perception within healthy ageing and discusses the extent of change.
Methods: search strategy, selection, scoring and data extraction
Medical databases Medline, EMBASE and CINAHL as well as Science Direct and Web of Science databases were
Abbreviation: AFC, alternative forced choice.
*Corresponding author:Dr Lisa Methven, fax +44 1183 787708, email [email protected]
Proceedings
of
the
Nutrition
Society
searched from 1900 to April 2012 for relevant articles. Search terms were: ‘taste, tastant, gustation, threshold, identification, perception, intensity, acuity.’ Within the medical databases the search included age category limits of over 65, over 80 years and human subjects’ studies. In the latter two databases, search terms ‘age, elder, old and geriatric’ were also included. Articles were excluded by either the abstract or the full paper if they did not fall within the inclusion criteria; the papers had to investigate both younger adults and older adults (over 65 years), be related to healthy ageing and not a disease state. Aroma, olfaction and smell were also excluded. Review articles found in searches were hand searched for relevant articles within reference lists, with resulting studies assessed for relevance and where suitable included in this review. Accepted articles were reviewed by two researchers inde-pendently and appraised using the Downs and Black
scor-ing system(4). The checklist comprised twenty-six
questions to evaluate the reporting, external and internal validity (bias and confounding). The final question regarding statistical power was removed as most studies were not intervention studies and hence did not provide a power calculation; however, the total number of partici-pants in each study was reviewed. Disagreements in ratings were discussed and final consensus scores were given for each study. The data extracted included whether the study investigated taste detection or identification thresholds or supra-threshold intensities, as well as authors, publication year, sensory methodology, participant information and key findings. Meta-analysis was carried out on the data extracted from articles which investigated taste-detection thresholds using the Comprehensive Meta-Analysis soft-ware (Version 2).
Results
Sixty-nine relevant articles were included in this review, from the initial search acquisition of 3959 articles of which 127 non-English articles were excluded. Participant num-bers varied greatly depending on the study type and size, from twelve to 761 respondents; however, the study sizes were small with sixty participants as the median size. Taste detection thresholds were studied in forty papers of which twenty-three provided sufficient data to be included in a meta-analysis, either as independent group means with standard deviation or as correlation coefficients of thresh-old against age. Identification threshthresh-olds were reported in eighteen papers and taste intensity perception was sidered in twenty-five papers. The taste modalities con-sidered included sweet, salty, sour, bitter and umami. Papers ranged in their consideration from one to all mod-alities; the number of tastant compounds considered within each modality varied from one to thirteen.
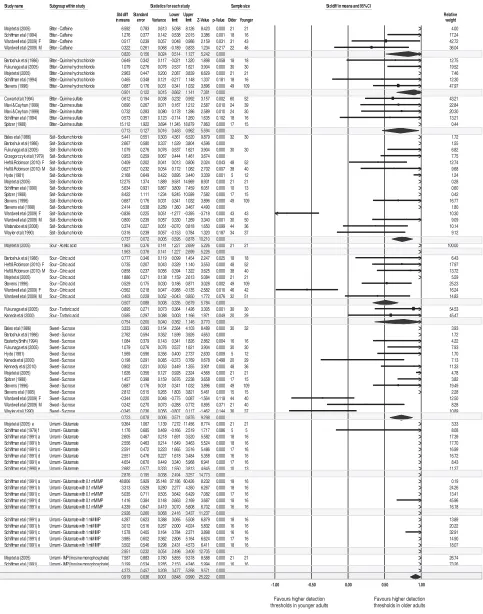
Effects of ageing on taste detection
Fig. 1 summarises the meta-analysis output across all taste modalities reported. The effect size (reported as Hedges’
g), the sample size and the significance (Pvalue) of each
study can be seen in Fig. 1. Where the bar is located to the
right side of the plot it indicates that a study found higher detection thresholds in older adults, the bar is on the left where thresholds were higher in younger adults; centred bars indicate no difference in thresholds between either group. However, only the tastants typically tested have been included in the plot, for example, sucrose for sweet taste and NaCl for salt taste. Other tastants within each modality, which were included in a limited number of studies, are discussed later separately. The overall con-sensus across all tastes and all papers is given at the end of the Fig. and the consensus for each taste modality is given within Fig. 1. The weighting of each study to the con-sensus is given to the right of the plot; these were derived from the sample size.
Of the total twenty-three relevant articles that underwent meta-analysis, twenty found taste detection thresholds to significantly increase with age, and these covered all five modalities (Fig. 1). However seven studies found no effect of age for sucrose (four studies), NaCl (two studies), qui-nine hydrochloride (two studies), caffeine (one study), quinine sulphate (one study), citric acid (one study) and
glutamate (one study). One study(5)unexpectedly found a
significant decrease in taste-detection threshold with age for females only across two taste modalities (sour and salt). It is clear from Fig. 1 that the trend of increasing detection thresholds with age is most conclusive for umami, where all studies have observed thresholds to increase. However, this modality has only been studied by two research groups. Thresholds for salt and sour tastants increase in more than 80 % of studies. Bitter and sweet tastants have also been found to be negatively affected by healthy age-ing in 70 % of studies.
There are numerous reasons for discrepancies across studies, including the widely varying number of partici-pants tested, different age ranges, varying male:female ratios and different exclusion or inclusion of confounding factors such as participants with dentures and smokers. In addition, sensory-testing methodologies varied, as did the tastants used coupled with their concentration ranges and progressions. Many studies commented that there were gender differences in thresholds as well as age differences, so as the genders were not balanced in all studies this will
have contributed to discrepancies(5–9).
Of the forty papers investigating detection thresholds, the majority used some form of alternative forced choice (AFC) procedure where tastants were presented in aqueous solution alongside control water samples; either
2-AFC(10,11) where each sample concentration was
pre-sented against one water control and the volunteer stated
which was the stronger sample, or 3-AFC(5,9,12)where each
sample was presented against two controls. In some cases, volunteers were only presented each concentration once
(an ascending AFC method)(12–19), whereas more rigorous
papers used a staircase methodology where ‘turning points’ are established through presenting the volunteer samples below and above their individual threshold more than once to have more confidence in the individual’s
thresh-old(8,10,11,20–27). Hybrids between these two method
types do exist, for example where authors have used an ascending AFC method and then repeated the
Proceedings
of
the
Nutrition
Society
Study name Subgroup within study Statistics for each study Sample size Std diff in means and 95% CI
Std diff Standard Lower Upper Relative
in means error Variance limit limit Z-Value p-Value Older Younger weight
Mojet et al (2005) Bitter - Caffeine 6.592 0.783 0.613 5.058 8.126 8.423 0.000 21 21 4.00 Schiffman et al (1994) Bitter - Caffeine 1.276 0.377 0.142 0.538 2.015 3.386 0.001 18 16 17.24 Wardwell et al (2009) F Bitter - Caffeine 0.517 0.239 0.057 0.048 0.986 2.159 0.031 31 43 42.72 Wardwell et al (2009) M Bitter - Caffeine 0.322 0.261 0.068 -0.189 0.833 1.234 0.217 22 46 36.04
0.820 0.156 0.024 0.514 1.127 5.242 0.000
Bartoshuk et al (1986) Bitter - Quinine hydrochloride 0.649 0.342 0.117 -0.021 1.320 1.898 0.058 18 18 12.75 Fukunaga et al (2005) Bitter - Quinine hydrochloride 1.079 0.276 0.076 0.537 1.621 3.904 0.000 30 30 19.52 Mojet et al (2005) Bitter - Quinine hydrochloride 2.963 0.447 0.200 2.087 3.839 6.629 0.000 21 21 7.46 Schiffman et al (1994) Bitter - Quinine hydrochloride 0.465 0.348 0.121 -0.217 1.148 1.337 0.181 18 16 12.30 Stevens (1996) Bitter - Quinine hydrochloride 0.687 0.176 0.031 0.341 1.032 3.896 0.000 49 109 47.97
0.901 0.122 0.015 0.662 1.141 7.381 0.000
Cowart et al (1994) Bitter - Quinine sulfate 0.612 0.194 0.038 0.232 0.992 3.157 0.002 60 52 43.21 Mavi & Cayhan (1999) Bitter - Quinine sulfate 0.690 0.267 0.071 0.167 1.212 2.587 0.010 24 39 22.84 Mavi & Ceyhan (1999) Bitter - Quinine sulfate 0.732 0.283 0.080 0.178 1.286 2.589 0.010 24 30 20.30 Schiffman et al (1994) Bitter - Quinine sulfate 0.573 0.351 0.123 -0.114 1.260 1.635 0.102 18 16 13.21 Spitzer (1988) Bitter - Quinine sulfate 15.112 1.922 3.694 11.345 18.879 7.863 0.000 17 15 0.44
0.713 0.127 0.016 0.463 0.962 5.594 0.000
Bales et al (1986) Salt - Sodium chloride 5.441 0.551 0.303 4.361 6.520 9.879 0.000 32 30 1.72 Bartoshuk et al (1986) Salt - Sodium chloride 2.667 0.580 0.337 1.529 3.804 4.596 0.000 1.55 Fukunaga et al (2005) Salt - Sodium chloride 1.079 0.276 0.076 0.537 1.621 3.904 0.000 30 30 6.82 Grzegorczyk et al (1979) Salt - Sodium chloride 0.953 0.259 0.067 0.444 1.461 3.674 0.000 7.75 Heft & Robinson (2010) F Salt - Sodium chloride 0.409 0.202 0.041 0.013 0.806 2.024 0.043 48 52 12.74 Heft & Robinson (2010) M Salt - Sodium chloride 0.627 0.232 0.054 0.172 1.082 2.702 0.007 38 40 9.68 Hyde (1981) Salt - Sodium chloride 2.168 0.649 0.422 0.895 3.440 3.339 0.001 5 12 1.24 Mojet et al (2005) Salt - Sodium chloride 12.275 1.374 1.889 9.581 14.969 8.931 0.000 21 21 0.28 Schiffman et al (1990) Salt - Sodium chloride 5.634 0.931 0.867 3.809 7.459 6.051 0.000 10 13 0.60 Spitzer (1988) Salt - Sodium chloride 8.422 1.111 1.234 6.245 10.599 7.582 0.000 17 15 0.42 Stevens (1996) Salt - Sodium chloride 0.687 0.176 0.031 0.341 1.032 3.896 0.000 49 109 16.77 Stevens et al (1998) Salt - Sodium chloride 2.414 0.538 0.289 1.360 3.467 4.490 0.000 1.80 Wardwell et al (2009) F Salt - Sodium chloride -0.836 0.225 0.051 -1.277 -0.395 -3.718 0.000 43 43 10.30 Wardwell et al (2009) M Salt - Sodium chloride 0.800 0.239 0.057 0.330 1.269 3.340 0.001 30 50 9.09 Watanabe et al (2008) Salt - Sodium chloride 0.374 0.227 0.051 -0.070 0.818 1.650 0.099 44 36 10.14 Wayler etal (1990) Salt- Sodiumchloride 0.316 0.239 0.057 -0.153 0.784 1.320 0.187 34 37 9.12
0.737 0.072 0.005 0.595 0.878 10.210 0.000
Mojet et al (2005) Sour - Acetic acid 1.963 0.376 0.141 1.227 2.699 5.226 0.000 21 21 100.00 1.963 0.376 0.141 1.227 2.699 5.226 0.000
Bartoshuk et al (1986) Sour - Citric acid 0.777 0.346 0.119 0.099 1.454 2.247 0.025 18 18 6.43 Heft & Robinson (2010) F Sour - Citric acid 0.735 0.207 0.043 0.329 1.140 3.553 0.000 48 52 17.97 Heft & Robinson (2010) M Sour - Citric acid 0.858 0.237 0.056 0.394 1.322 3.625 0.000 38 40 13.72 Mojet et al (2005) Sour - Citric acid 1.886 0.371 0.138 1.159 2.613 5.084 0.000 21 21 5.59 Stevens (1996) Sour - Citric acid 0.529 0.175 0.030 0.186 0.871 3.028 0.002 49 109 25.23 Wardwell et al (2009) F Sour - Citric acid -0.562 0.218 0.047 -0.988 -0.135 -2.582 0.010 46 42 16.24 Wardwell et al (2009) M Sour - Citric acid 0.403 0.228 0.052 -0.043 0.850 1.772 0.076 32 51 14.83
0.507 0.088 0.008 0.335 0.679 5.784 0.000
Fukunaga et al (2005) Sour - Tartaric acid 0.895 0.271 0.073 0.364 1.426 3.305 0.001 30 30 54.53 Kaneda et al (2000) Sour - Tartaric acid 0.585 0.297 0.088 0.003 1.166 1.971 0.049 20 29 45.47
0.754 0.200 0.040 0.362 1.146 3.770 0.000
Bales et al (1986) Sweet - Sucrose 3.333 0.393 0.154 2.564 4.103 8.489 0.000 30 32 3.93 Bartoshuk et al (1986) Sweet - Sucrose 2.762 0.594 0.352 1.599 3.926 4.653 0.000 1.72 EasterbySmith (1994) Sweet - Sucrose 1.084 0.379 0.143 0.341 1.826 2.862 0.004 16 16 4.22 Fukunaga et al (2005) Sweet - Sucrose 1.079 0.276 0.076 0.537 1.621 3.904 0.000 30 30 7.93
Hyde (1981) Sweet - Sucrose 1.569 0.596 0.356 0.400 2.737 2.630 0.009 5 12 1.70
Kaneda et al (2000) Sweet - Sucrose 0.198 0.291 0.085 -0.373 0.769 0.678 0.498 20 29 7.13 Kennedy et al (2010) Sweet - Sucrose 0.902 0.231 0.053 0.449 1.355 3.901 0.000 48 36 11.33 Mojet et al (2005) Sweet - Sucrose 1.626 0.356 0.127 0.928 2.324 4.568 0.000 21 21 4.78 Spitzer (1988) Sweet - Sucrose 1.457 0.398 0.159 0.676 2.238 3.658 0.000 17 15 3.82 Stevens (1996) Sweet - Sucrose 0.687 0.176 0.031 0.341 1.032 3.896 0.000 49 109 19.49 Stevens et al (1995) Sweet - Sucrose 2.812 0.515 0.265 1.803 3.821 5.461 0.000 15 15 2.28 Wardwell et al (2009) F Sweet - Sucrose -0.344 0.220 0.048 -0.775 0.087 -1.564 0.118 44 40 12.50 Wardwell et al (2009) M Sweet - Sucrose 0.242 0.270 0.073 -0.288 0.772 0.895 0.371 21 40 8.28 Wayler et al (1990) Sweet - Sucrose -0.345 0.236 0.056 -0.807 0.117 -1.462 0.144 36 37 10.89
0.723 0.078 0.006 0.571 0.876 9.298 0.000
Mojet et al (2005) e Umami - Glutamate 9.364 1.067 1.139 7.272 11.456 8.774 0.000 21 21 3.33 Schiffman et al (1979) f Umami - Glutamate 1.176 0.685 0.469 -0.166 2.519 1.717 0.086 5 5 8.08 Schiffman et al (1991) a Umami - Glutamate 2.605 0.467 0.218 1.691 3.520 5.582 0.000 18 16 17.39 Schiffman et al (1991) b Umami - Glutamate 2.556 0.463 0.214 1.649 3.463 5.524 0.000 18 16 17.70 Schiffman et al (1991) c Umami - Glutamate 2.591 0.472 0.223 1.665 3.516 5.486 0.000 17 16 16.99 Schiffman et al (1991) d Umami - Glutamate 2.551 0.476 0.227 1.618 3.484 5.358 0.000 16 16 16.72 Schiffman et al (1991) e Umami - Glutamate 4.654 0.670 0.449 3.340 5.968 6.941 0.000 17 16 8.43 Schiffman et al (1990) e Umami - Glutamate 2.682 0.577 0.333 1.550 3.813 4.645 0.000 10 13 11.37
2.876 0.195 0.038 2.494 3.257 14.773 0.000
Schiffman et al (1991) a Umami - Glutamate with 0.1 mM IMP 48.806 5.929 35.148 37.186 60.426 8.232 0.000 18 16 0.19 Schiffman et al (1991) b Umami - Glutamate with 0.1 mM IMP 3.313 0.529 0.280 2.277 4.350 6.267 0.000 18 16 24.26 Schiffman et al (1991) c Umami - Glutamate with 0.1 mM IMP 5.035 0.711 0.505 3.642 6.429 7.082 0.000 17 16 13.41 Schiffman et al (1991) d Umami - Glutamate with 0.1 mM IMP 1.416 0.384 0.148 0.663 2.169 3.687 0.000 18 16 45.96 Schiffman et al (1991) e Umami - Glutamate with 0.1 mM IMP 4.339 0.647 0.419 3.070 5.608 6.702 0.000 16 16 16.18
2.926 0.260 0.068 2.416 3.437 11.237 0.000
Schiffman et al (1991) a Umami - Glutamate with 1 mM IMP 4.287 0.623 0.388 3.065 5.508 6.879 0.000 18 16 13.89 Schiffman et al (1991) b Umami - Glutamate with 1 mM IMP 3.012 0.516 0.267 2.000 4.024 5.832 0.000 16 16 20.22 Schiffman et al (1991) c Umami - Glutamate with 1 mM IMP 1.578 0.405 0.164 0.784 2.371 3.898 0.000 16 16 32.91 Schiffman et al (1991) d Umami - Glutamate with 1 mM IMP 3.985 0.602 0.362 2.806 5.164 6.624 0.000 17 16 14.90 Schiffman et al (1991) e Umami - Glutamate with 1 mM IMP 3.502 0.546 0.298 2.431 4.573 6.411 0.000 18 16 18.07
2.951 0.232 0.054 2.496 3.406 12.705 0.000
Mojet et al (2005) Umami - IMP (Inosine monophosphate) 7.587 0.883 0.780 5.855 9.318 8.588 0.000 21 21 26.74 Schiffman et al (1991) Umami - IMP (Inosine monophosphate) 3.199 0.534 0.285 2.153 4.246 5.994 0.000 16 16 73.26
4.373 0.457 0.209 3.477 5.268 9.571 0.000 0.919 0.036 0.001 0.848 0.990 25.222 0.000
-1.00 -0.50 0.00 0.50 1.00
( )
0.820 0.156 0.024 0.514 1.127 5.242 0.000
( )
2.951 0.232 0.054 2.496 3.406 12.705 0.000
0.901 0.122 0.015 0.662 1.141 7.381 0.000
0.713 0.127 0.016 0.463 0.962 5.594 0.000
( )
2.926 0.260 0.068 2.416 3.437 11.237 0.000
Sc
S hiffmff anm etal (1990) e Umam mi Glutatt mam tet 2.682 0.577 0.333 1.550 3.813 4.645 0.000 10 13 11.37
2.876 0.195 0.038 2.494 3.257 14.773 0.000
Wa
W yler etal (1990) SwS eet SuS crose 0.345 0.236 0.056 0.807 0.117 1.462 0.144 36 37 10.89
0.723 0.078 0.006 0.571 0.876 9.298 0.000
( )
0.754 0.200 0.040 0.362 1.146 3.770 0.000
( )
0.507 0.088 0.008 0.335 0.679 5.784 0.000
j ( )
1.963 0.376 0.141 1.227 2.699 5.226 0.000
0.737 0.072 0.005 0.595 0.878 10.210 0.000
M j l ( ) S A i id
( ) ( p p )
4.373 0.457 0.209 3.477 5.268 9.571 0.000
0.919 0.036 0.001 0.848 0.990 25.222 0.000
Favours higher detection thresholds in younger adults
Favours higher detection
thresholds in older adults
F, female; M, male
Type of glutamate: a, ammonium; b, calcium; c, magnesium; d, potassium; e, sodium / monosodium; f, L-glutamic acid
Proceedings
of
the
Nutrition
Society
predominantly of this type. The AFC approach has also been used where small quantities of samples have been
applied directly to the tongue by a pipette(23,29). Simpler
methods have been used; for example some researchers have used only single presentation of samples rather than a discrimination test between samples and controls. This has been carried out using solutions presented for normal drinking, either as a series of increasing
concentra-tions(30,31) or as simply a single tastant solution(32,33);
alternatively as tastants absorbed onto filter paper discs
that were placed directly onto the tongue(34), or as small
aliquots of tastant solution (1 ml) sprayed directly into the
mouth(6). The obvious advantage of such simpler methods
is to avoid excessive presentation of samples to elderly participants, avoiding fatigue; however, it can lead to less reliable results. Using a single concentration of tastant and determining the proportion of people that can detect its presence, is arguably not a method from which taste-detection thresholds can be quoted. However, it has
pro-vided useful data across very large subject cohorts (n 226)
where the age of the older cohorts has been higher
than in any other studies (101.9 (SD 1.4) compared with
70.5 (SD 5))(33). This Italian study found an overall
sig-nificant reduction in perception of taste (P<0.001) in
cen-tenarians compared with both adults (mean age 28) and
older people (mean age 71)(32,33). Another method
devel-oped to apply tastant solutions directly to the tongue was a gustometer, which enabled continuous presentation for 2 s intervals. Following each 2 s presentation the subjects give their degree of certainty concerning whether a stimulus was present or not. A large number of repetitions per per-son were possible using this method and results were
ana-lysed using a signal detection procedure (Rindex)(35). This
paper investigated salt detection thresholds that were found
to increase with age (P<0.0001), in line with the AFC-type
studies, and noted that there was regional sensitivity across the tongue. Finally, taste-detection thresholds can be mea-sured without the presentation of any tastant stimulus, instead through the use of electrogustometry, a technique
used to first report differences with age in the 1960s(36),
which has received attention again more recently(37,38).
The technique assumes that responses to electrical stimu-lation of the tongue mimic taste function.
It was noted that electrical thresholds increased with age
across all three studies(36–38); however, one study noted
that there was poor correlation between electrical
thresh-olds and sour or salty taste threshthresh-olds(37). It is perhaps
reasonable to conclude that although the use of electro-gustometry is very useful as a clinical tool to detect sub-stantial increases in taste thresholds, it cannot be used to infer specific taste thresholds.
Where authors investigated the same taste modality using differing tastant compounds, it was found that the
taste detection responses with age vary(11,13,15,16,18). In
addition, very few papers have evaluated detection
thresh-olds within food or beverage systems(12) although more
researchers have considered the perceived intensity of
supra-threshold levels of tastants within products(11,39–45).
Despite the overall consensus that taste detection dete-riorates with age, there is less evidence to suggest when this decline starts, as most studies have compared a cohort
of older adults with one of younger adults. Three recent studies have investigated taste detection thresholds over an age continuum. The electrogustometry method was used
with 461 participants with an age range of 15–94 years(38).
It was found that electrogustometry thresholds increased
from either age 60+ or 70+ depending upon the exact site
of measurement. The study by Yamauchi where aliquots of tastant solution were sprayed directly into participants
mouths(6)investigated four tastants with 670 participants of
age 20–90 years. They found salt thresholds to be
sig-nificantly higher at 70+ years, bitter at 80+years, sour
was significantly higher at 60+ years in males but not until
80+ years in females, whereas sweet thresholds were not
affected by age in their study. A study that presented a series of increasing concentrations of salt solutions to 109
participants of age range 19–95 years(31) found no
sig-nificant effect of age on thresholds. Results from the latter paper conflict not only with the Yamauchi paper, but with almost all papers in the meta-analysis that considered salt (Fig. 1). It is not clear why as all age groups were well
represented in the Watanabe paper(31); however the
differ-ence in sensory method used may have led to dis-crepancies. Summarising from the limited number of papers that have considered an age continuum, it appears that taste deterioration with age is only noted in later life, beyond at least 60 years of age.
Extent of taste decline with ageing
The extent of taste perception decline with age is rarely quantified and often disputed between research studies. However, it was clear that the effect of sensory decline depended largely upon the taste modality and upon the specific tastant.
Salt
It was clear from the meta-analysis (Fig. 1) that the NaCl taste thresholds increased with age, except for females in
one study(5). A similar result was found for other salt-taste
compounds including potassium chloride(11)as well as Na
salts of acetate, ascorbate, carbonate, citrate, phosphate,
succinate, sulphate and tartrate (all at pH 7)(16). Schiffman
found the magnitude of salt perception decline varied from
2.7- to 26.7-fold depending on the type of Na salt(16).
Across studies investigating NaCl thresholds were found to
increase between 1.4-(27) and 6.7-fold(16). The mean
thresholds quoted over all studies varied considerably; for
older people the range was from 4.9(20)to 58 mM(34); with
an average across the studies of 21 mM (0.12 %, w/w)
compared with the average across studies for younger
adults of 11 mM (0.06 %, w/w). Data from one study were
removed from the calculation of mean threshold as the paper quoted means values in different units for younger and older adults, implying a 57-fold decrease in threshold with age, which contradicted the direction of change
quo-ted in the paper(34).
Proceedings
of
the
Nutrition
Society
increase could effect detection of salt in meals by older people, certainly a level of 0.12 % (w/w) would be below the level of salt in most foods. The British Dietetic Asso-ciation class low, medium and high-salt food to contain
levels within the ranges of £0.3 g, 0.3–1.5 g and >1.5 g
per 100 g product. Although the distribution of individual
salt detection thresholds is wide, a large study (n 146) by
Baker(8) found that very few individuals had thresholds
above 50 mM(0.3 % NaCl).
Sour
The tastants included in the meta-analysis plot (Fig. 1) were citric, tartaric and acetic acids, the thresholds for which were found to increase with age, except in one out of five studies on citric acid where thresholds were found
to be higher in a younger group of females(5). A study of
hydrochloric acid with males found thresholds to increase
with age(19). From four citric acid studies, the reported
increase in threshold varied between 1.4-(5)and 11-fold(46);
however, the actual thresholds measured were much lower in the latter study where the total sample size was small
(n36) and there was a disproportionate number of females
(89 %). Across the studies the mean thresholds for younger
adults was 0.4 mMand for older adults 0.7 mM, representing
a 1.5-fold increase with age.
Bitter
The effect of age on bitter detection thresholds has been reported for thirteen different compounds across nine
dif-ferent studies(5,11,18,19,21,23,24,34,46)and in all but one case(5)
have been found to increase with age. The most common tastants studied are quinine derivatives and caffeine (Fig. 1). The extent of increase reported for quinine
detection thresholds was between 1.5-(18) and 7.4-fold(46).
For quinine hydrochloride the mean thresholds across four studies for the younger and older adult groups were 0.002
and 0.009 mM, respectively, representing a 4.1-fold
increase. For quinine sulphate the means were 0.005Mand
0.019 mM, respectively, similarly, a 4.0-fold increase.
Interestingly, the results for caffeine were less notable; the
extent of increase with age reported to be from 1.1-(5) to
1.6-fold(11). Across four studies the mean caffeine
thresh-olds for younger and older groups was 1.4 and 1.8 mM,
respectively, representing an overall mean increase of 1.2-fold with age.
It was noted that some studies took into account genetic differences in ability to detect the bitter phenylthiocarba-mide or propylthiouracil, whereas others did not, which would be a confounding factor. However, studies investi-gating these tastants found thresholds to increase with age(18,46). Schiffman(18)evaluated a wide range of thirteen bitter tastants in one study where participants were first screened into phenylthiocarbamide taste/non-taster groups.
The detection thresholds were significantly (P<0.05)
higher for the older group for seven of the compounds, with the extent of difference within the non-phenylthio-carbamide taster group ranging from 1.5-fold for quinine hydrochloride to 33-fold for magnesium nitrate. However,
the total sample size was small (n 34; sixteen younger,
eighteen older; half phenylthiocarbamide non-tasters).
Sweet
Sucrose-detection thresholds were measured in ten studies, four of which found no effect of age. The remaining seven
studies did find an increase with age varying from 1.2-(28)
to 2.6-fold(34). The mean threshold across the studies was
12.4 mM for younger adults and 16.8 mM for older adults,
representing a 1.4-fold increase. A limited number of studies have investigated sweeteners. Two studies on saccharin both concluded thresholds were approximately
4-fold higher in older adults(13,15). Regarding aspartame,
one study found thresholds to increase 4.1-fold with
age(15), whereas two other studies found no difference
between age groups(11,13). Schiffman evaluated a further
nine sweeteners and found detection thresholds of all to increase with age by between 1.5-fold (sodium cyclamate)
to 4.7-fold (monellin)(15).
Umami
Detection thresholds for umami have been evaluated in fewer studies. Three studies of monosodium glutamate all found detection threshold to increase with age. The mean
threshold across studies was 2.5 mMfor younger adults and
5.5 mM for older, representing a 2.2-fold increase. Two
studies of inosine monophospate reported 4.4-fold higher
detection thresholds in older adults (1.5 mMcompared with
0.3 mM). Schiffman investigated thresholds of a further
four glutamate salts all of which were between 3.7- and
8.5-fold higher for older adults(17). Glutamates and inosine
monophospate interact synergistically to increase overall umami taste. Thresholds for all four glutamate salts tested in combination with inosine monophospate also had higher
thresholds in older adults compared with younger(17).
Effects of ageing on taste identification thresholds
Eighteen studies considered identification
thresh-olds(5,6,12,15–17,30,32–34,42,47–53). Some authors using the AFC methodology report identification thresholds post-detection within the same procedure. Others used simpler methods such as ascending presentation of a series (state
when identified), either as solutions(42,47)or taste discs(34),
presenting a single concentration of a tastant and
deter-mining the proportion of subjects that can name it(32,33).
A recent simple but effective means to determine identifi-cation thresholds has been the use of taste strips; four dif-ferent concentrations per tastant, applied directly to the
tongue(48,52); or similarly using four concentrations of
solution applied as drops(50,53). Seventeen studies found
taste-identification thresholds to increase with age,
although one study reported only a weak relationship
between age and taste strip results(52). Only one study
found no significant difference between age groups(53);
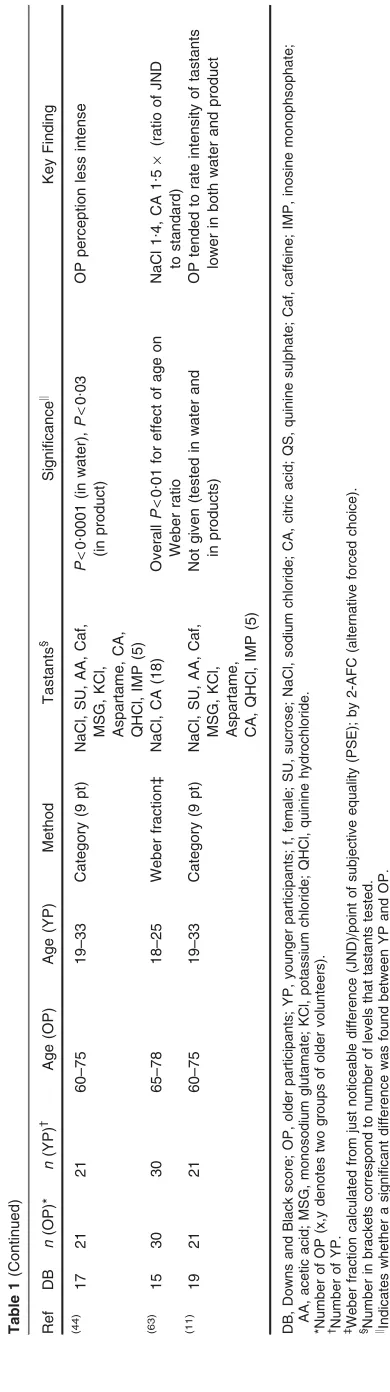
Table 1 Review of studies comparing perceived intensity of tastants and supra-threshold levels in younger and older adults
Ref DB n(OP)* n(YP)† Age (OP) Age (YP) Method Tastants§ Significancek
Key Finding
(55) 16 12 27 71 (
SD2) 19 (SD1) ME SU (56) NS No difference between YP and OP in
sweet intensity perception (57)
18 42(f) 108 Not given 18–22 ME Amino acids (3–14) Mean ratio 2.55 (slope YV/slope OV) Perceived intensity flatter for OP (mean
ratio was 2.55 : slope YP/slope OP)
(7) 16 24 28 75 (SD6) 28 (SD3) Line scale SU, NaCl, CA,
Caf (7)
SU and NaCl ns; CAP<0.05, Caf P<0.01
OP scored lower intensities for sour and bitter (gender differences)
(15) 14 12 12 75–81 19–24 ME Sweeteners (9–11) Mean ratio 2.06 (slope YV/slope OV) Psychophysical function (plotting log of
perceived intensity against log concentration) flatter for OP
(56) 15 20, 20 20 (65–78) (80–95) 20–25 ME NaCl (5) NS No age-related differences in
intensity scoring
(46) 13 18 18 74–93 20–30 ME SU, NaCl, CA,
QHCl (9–13)
NS Slope flatter, OP tended to score lower
concentrations more intense and higher cons less intense
(58) 17 32 22 >70 22–39 ME SU, NaCl, CA, QS(7) SU ns, CA, NaCl and QSP<0.05 Trend for OP to rate lower
(39) 12 60, 60 60 (70–79) (80–99) 20–29 ME NaCl (levels not
declared)
P=0.025 (in water) (P=0.001 in soup) OP rated high salt samples lower
intensity than young, but the very old rated them higher
(40)
20 60, 60 60 (70–79) (80–99) 20–29 ME CA (6 levels) P<0.001 solution and drink OP rated high acid samples lower
intensity than YP, but the very old rated them higher
(41) 16 60, 60 60 (70–79) (80–99) 20–29 ME CA, NaCl (6) P<0.05 solutions and products Age had negative impact on intensity
of perception (10)
18 29 29 65–80 19–35 Category (13 pt) SU, NaCl, CA, QS (3) SU ns; NaClP<0.05; CA and QS
P<0.01
Correlation between threshold and age was very weak
(59) 16 12 12 72 (SD3) 23 (SD2) Weber fraction‡ SU, Caf (21) SU ns; CafP<0.05 Caf Weber ratio for bitter: YP 0.4,
OP 1.27. OP needed 74 % inc to detect difference (YP 34 %) (60)
14 24 24 73 (SD5) 20 (SD3) ME SU, NaCl, CA, Caf (3) SU and NaCl ns; CA and CafP<0.05 OP lower intensities for sour (77 %)
and bitter (56 %)
(27) 18 34 37 65–78 55–65 ME NaCl, SU (6) NaClP<0.01, SU ns (trendP=0.07) NaCl intensity lower for OP than YP.
Salivary Na affected salt judgements
(61) 14 Continuousn87 Continuous 25–93 ME SU, NaCl (4) Not given No age-related differences in
intensity scoring
(45) 14 48 Not given >65 20–35 Ranking NaCl (4) in products Not given No significant difference in ability to
perceive salt at the four concentrations
(17) 15 18 16 87 (
SD4) 26 (SD5) ME 5 glutamate salts (7)
w/wo IMP
Mean slopes of YP>OP (P<0.05) in 14 out of 15 cases
Dose responses curves flatter for the OP
(21)
13 60 52 65–86 18–38 Category (13 pt) QS, urea (5) Urea ns; QSP<0.01 Differences not large
(18) 13 18 16 81 (SD2) 27 (SD1) ME 13 bitter compounds (7) Mean ratio of slope(YP)/slope(OP) 1.76
(P<0.05)
Intensity slopes for YP greater than for OP, for four out of eight compounds
(42) 19 29 35 79 (
SD6) 22 (SD2) Category (10 pt) SU (in 5 foods) (5) P<0.05 (in yoghurt only) OP rated higher sucrose yoghurts as
less sweet then YP (43)
17 24 24 60–75 20–30 Category (9 pt) NaCl (5) P<0.05 in water, ns in broth OP found salt slightly less intense in
water, same in broth
(62) 17 30 30 >65 19–34 Category (5 pt) SU, CA (5) in juice P<0.01 Perceived intensity flatter for OP
Ageing
and
taste
561
.
https://doi.org/10.1017/S0029665112000742
https:/www.cambridge.org/core
. University of West London
, on
29 Mar 2017 at 08:29:11
Proceedings
of
the
Nutrition
Society
Effects of ageing on perception of taste intensity at supra-threshold levels
Table 1 summarises the twenty-five extracted studies which report perceived intensity of tastants by younger and older adults. A similar review was done by Mojet in
2001(54). The most common assessment method was
mag-nitude estimation followed by the use of various category scales and also the calculation of Weber ratios through just noticeable difference discrimination tests.
When aiming to relate taste perception to food liking and choice, it is perhaps perceived intensity at supra-threshold levels that is most important if the tastant levels in foods are likely to be above detection thresholds. As noted in Table 1, a wide range of tastants have been investigated and some researchers have measured
per-ceived intensities in products(11,39,40,43–45,56,62–64). Sixteen
of the twenty-five studies noted that age had a significant negative impact on the intensity of perception, and a fur-ther two reported non-significant trends. This finding was relatively consistent for caffeine, citric acid, quinine and NaCl. Regarding sucrose, six studies found no significant effect of age on perceived intensity, which was disputed in a further three studies. Magnitude estimation studies where psychophysical functions could be calculated by plotting log perceived intensity against log concentration, tended to find that the slope was flatter for older volunteers, parti-cularly as higher concentrations of tastants were perceived as less intense than for younger volunteers. Only three studies reported no age-related differences in intensity scoring. The extent of effect was not frequently reported in the supra-threshold studies. However, Schiffman’s magni-tude estimation studies found the slope of perceived intensity against tastant concentration to be steeper for young adults than for older adults by a mean factor of 2.06
for sweet compounds(15)and 1.76 for bitter compounds(18).
Four studies investigating both pure solutions and products found a significant decrease in perception with age in both
cases(39–41,44). In the Mojet paper, this effect was
con-sistent over a wide range of tastants(44). However, one
study found a significant effect of age for salt solution
intensity which was not supported in both products(43).
Quality of data and reporting of studies
The Downs and Black scores for the reviewed articles ranged between eleven and twenty-one out of a possible
twenty-seven with an average rating of 16 (SD 2). This
average is low, with many studies failing to fully incor-porate and describe confounding factors, and very few reporting blinding of both the participants and the orga-nisers throughout the investigation, usually typical of clinical trials. Furthermore, the use of various sensory methods, and small participant numbers in most studies, reduces the ability to collate and compare results without over-emphasising methodological noise.
Conclusion
Overall, this systematic review generally found an age-related decrease in taste thresholds and sensitivity with
Proceedings
of
the
Nutrition
Society
age. However, the extent and significance of this decline varied between taste modalities, tastants and studies.
The effect of age on sensory perception, and specifically taste perception, is complex, due to the highly hetero-geneous nature of the older community. The main conclu-sion to be drawn from the studies reviewed in this paper is that taste perception declines with age. Understanding this decline in taste ability could help the development of specifically enhanced foods for older adults to compensate for sensory losses. While deterioration in salt perception should not be compensated for by the addition of extra salt in food for elderly people who may already be at risk of hypertension, CVD or hypernatraemia, authors have sug-gested that increased levels of umami tastants can improve liking and consumption of foods by older adults. Although this has typically been achieved through the direct addition
of monosodium glutamate(2), it can also be achieved
through the use of natural ingredients rich in umami taste
compounds(65).
Sensory decline is a generic process and happens to everyone, yet several factors can influence the extent of this sensory decline. Nutritional status, vitamin and micronutrient intakes can all influence sensory perception, and the extent of decline with age, with research focussing
on the involvement of Zn in taste perception(66). Dentition
in older adults could also influence sensory perception, especially if portions of the palate are covered, as well as
impacting on salivation(27).
Although the majority of studies reviewed reported a significant age-related decline in perceived intensity at supra-threshold levels, the extent of decline was under-reported. Yet, in order to determine how this should be addressed when developing foods and beverages for the older adult market, it is the extent of decline that is important to establish. Across a range of ten tastants in five product types, Mojet found no correlations between detection threshold sensitivity and preferred tastant con-centration. However, there was evidence of a negative correlation between supra-threshold perceived intensity
and preferred concentration in products for salt (P<0.05),
caffeine (P<0.001), aspartame (P<0.01) and inosine
monophospate (P<0.05). In other words, people with
reduced intensity perception preferred higher concentra-tions of these tastants. Knowledge of the decline of taste and olfactory perception with age has led to the use of taste and flavour enhancement of foods, aiming to improve lik-ing and ultimately consumption by older adults. Although
this approach has been successful in some studies(2), it has
not in others(3). In order for such studies to succeed it may
be important to know the extent of decline in intensity perception for more complex mixtures of tastants within real food systems, as well as to account for the numerous confounding factors within individual perception.
The Downs and Black scores obtained by these studies were low, and in order to judge the abilities of older cohorts and understand effects of ageing, more robust and larger cohort studies are needed. There are potentially a large number of factors beyond age which may differ between young and older adult groups. Longitudinal studies would clarify whether variation between cohorts is due to individuals or the effect of time and larger, more
robust cohort studies maybe more practical at controlling some of these variables.
Acknowledgements
The authors declare no known conflicts of interest. The authors were partly supported by Research into Ageing (Age UK) and/or by Nestec Ltd in related research pro-jects. L. M. conducted the systematic review jointly with V. A. and wrote the manuscript. V. A. jointly conducted the systematic review, carried out the Downs and Blacks scoring of the included papers, carried out the meta-analysis and edited the manuscript. C. W. carried out the Downs and Blacks scoring of the included papers and edited the manuscript. M. G. read, reviewed and improved the manuscript for submission.
References
1. de Jong N, Mulder I, de Graaf C et al. (1999) Impaired
sensory functioning in elders: the relation with its potential
determinants and nutritional intake.J Geront A Biol Sci Med
Sci54, B324–B331.
2. Schiffman SS (1998) Sensory enhancement of foods for the
elderly with monosodium glutamate and flavors. Food Rev
Int14, 321–333.
3. Essed NH, Kleikers S, van Staveren WA et al.(2009) No
effect on intake and liking of soup enhanced with mono-sodium glutamate and celery powder among elderly people
with olfactory and/or gustatory loss.Int J Food Sci Nutr60,
143–154.
4. Downs SH & Black N (1998) The feasibility of creating a checklist for the assessment of the methodological quality both of randomized and non-randomized studies of health
care interventions. J Epidemiol Community Health 52,
377–384.
5. Wardwell L, Chapman-Novakofski K & Brewer MS (2009) Effects of age, gender and chronic obstructive pulmonary
disease on taste acuity.Int J Food Sci Nutr60, 84–97.
6. Yamauchi Y, Endo S & Yoshimura I (2002) A new whole-mouth gustatory test procedure. II. Effects of aging, gender
and smoking.Acta Otolaryngol122, Suppl 546, 49–59.
7. Hyde RJ & Feller RP (1981) Age and sex effects on taste of
sucrose, NaCl, citric acid and caffeine. Neurobiol Aging2,
315–318.
8. Baker KA, Didcock EA, Kemm JRet al. (1983) Effect of
age, sex and illness on salt taste detection thresholds. Age
Ageing12, 159–165.
9. Simpson EEA, Rae G, Parr Het al.(2012) Predictors of taste
acuity in healthy older Europeans.Appetite58, 188–195.
10. Cowart BJ (1989) Relationships between taste and smell
across the adult life span.Ann N Y Acad Sci561, 39–55.
11. Mojet J, Christ-Hazelhof E & Heidema J (2005) Taste per-ception with age: pleasantness and its relationships with threshold sensitivity and supra-threshold intensity of five
taste qualities.Food Quality Preference16, 413–423.
12. Schiffman SS, Sattely-Miller EA, Zimmerman IA et al.
(1994) Taste perception of monosodium glutamate (MSG)
in foods in young and elderly subjects. Physiol Behav 56,
265–275.
13. Easterby-Smith V, Besford J & Heath MR (1994) The effect of age on the recognition thresholds of three sweeteners:
Proceedings
of
the
Nutrition
Society
14. Schiffman SS, Hornack K & Reilly D (1979) Increased
taste thresholds of amino acids with age.Am J Clin Nutr32,
1622–1627.
15. Schiffman SS, Lindley MG, Clark TB et al. (1981)
Mole-cular mechanism of sweet taste: relationship of hydrogen
bonding to taste sensitivity for both young and elderly.
Neu-robiol Aging2, 173–185.
16. Schiffman SS, Crumbliss AL, Warwick ZS et al. (1990)
Thresholds for sodium salts in young and elderly human
subjects: correlation with molar conductivity of anion.Chem
Senses15, 671–678.
17. Schiffman SS, Frey AE, Luboski JAet al. (1991) Taste of
glutamate salts in young and elderly subjects: role of inosine
50-monophosphate and ions.Physiol Behav49, 843–854.
18. Schiffman SS, Gatlin LA, Frey AE et al. (1994) Taste
perception of bitter compounds in young and elderly persons:
relation to lipophilicity of bitter compounds.Neurobiol Aging
15, 743–750.
19. Spitzer ME (1988) Taste acuity in institutionalized and
non-institutionalized elderly men.J Gerontol43, P71–P74.
20. Bales CW, Steinman LC & Freeland-Graves JH (1986) The
effect of age on plasma zinc uptake and taste acuity. Am J
Clin Nutr44, 664–669.
21. Cowart BJ, Yokomukai Y & Beauchamp GK (1994) Bitter taste in aging: compound-specific decline in sensitivity.
Physiol Behav56, 1237–1241.
22. Grzegorczyk PB, Jones SW & Mistretta CM (1979)
Age-related differences in salt taste acuity. J Gerontol 34,
834–840.
23. Mavi A & Ceyhan O (1999) Bitter taste threshold and its relation to number of circumvallate papillae in the elderly.
Aging Clin Exp Res11, 61–63.
24. Stevens JC (1996) Detection of tastes in mixture with other
tastes: issues of masking and aging. Chem Senses 21,
211–221.
25. Stevens JC, Cruz LA, Hoffman JM et al. (1995)
Taste sensitivity and aging: high incidence of decline
revealed by repeated threshold measures. Chem Senses 20,
451–459.
26. Stevens JC, Cruz LA, Marks LEet al.(1998) A multimodal
assessment of sensory thresholds in aging. J Gerontol B,
Psychol Sci Soc Sci53, P263–P272.
27. Wayler AH, Perlmuter LC, Cardello AVet al.(1990) Effects
of age and removable artificial dentition on taste.Spec Care
Dentist10, 107–113.
28. Kaneda H, Maeshima K, Goto N et al. (2000) Decline in
taste and odor discrimination abilities with age, and
rela-tionship between gustation and olfaction. Chem Senses 25,
331–337.
29. Heft MW & Robinson ME (2010) Age differences in
orofa-cial sensory thresholds.J Dent Res89, 1102–1105.
30. Kennedy O, Law C, Methven L et al. (2010) Investigating
age-related changes in taste and affects on sensory
percep-tions of oral nutritional supplements. Age Ageing 39,
733–738.
31. Watanabe M, Fukuoka Y, Hatakeyama Aet al.(2008) Salt
taste perception and salt intake in older people. Geriatr
Gerontol Int8, 62–64.
32. Receputo G, Mazzoleni G, Fazio IDet al.(1996) Study on
the sense of taste in a group of Sicilian centenarians. Arch
Gerontol Geriatr22, Suppl 1, 411–414.
33. Baggio G, Dalla M, Donazzan Set al.(1998) Assessment of
sense of taste in Italian centenarians. Arch Gerontol Geriatr
26, 177–183.
34. Fukunaga A, Uematsu H & Sugimoto K (2005) Influences of
aging on taste perception and oral somatic sensation.J
Ger-ontol A Biol Sci Med Sci60, 109–113.
35. Matsuda T & Doty RL (1995) Regional taste sensitivity to NaCl: relationship to subject age, tongue locus and area of
stimulation.Chem Senses20, 283–290.
36. Hughes G (1969) Changes in taste sensitivity with advancing age.Gerontol Clini11, 224–230.
37. Murphy C, Quinonez C & Nordin S (1995) Reliability and validity of electrogustometry and its application to young and
elderly persons.Chem Senses20, 499–503.
38. Nakazato M, Endo S, Yoshimura Iet al.(2002) Influence of
aging on electrogustometry thresholds.Acta Otolaryngol122,
Suppl 546, 16–26.
39. Chauhan J, Hawrysh ZJ, Ko Cet al.(1987) Taste perception
of salt in young, old, and very old adults.Ann N Y Acad Sci
510, 222–223.
40. Chauhan J & Hawrysh ZJ (1988) Suprathreshold sour taste
intensity and pleasantness perception with age. Physiol
Behav43, 601–607.
41. Chauhan J (1989) Relationships between sour and salt taste
perception and selected subject attributes. J Am Diet Assoc
89, 652–658.
42. Chang Y-F & Ou AS-M (1999) Taste impairment and related
anthropometric factors in aging. Food Sci Agric Chem 1,
257–263.
43. Drewnowski A, Henderson SA, Driscoll Aet al.(1996) Salt
taste perceptions and preferences are unrelated to sodium
consumption in healthy older adults. J Am Diet Assoc 96,
471–474.
44. Mojet J, Heidema J & Christ-Hazelhof E (2003) Taste perception with age: generic or specific losses in
supra-threshold intensities of five taste qualities?Chem Senses28,
397–413.
45. Zallen EM, Hooks LB & O’Brien K (1990) Salt taste
pre-ferences and perceptions of elderly and young adults.J Am
Diet Assoc90, 947–950.
46. Bartoshuk LM, Rifkin B, Marks LE et al.(1986) Taste and
aging.J Gerontol41, 51–57.
47. Kim WY, Hur M, Cho MS et al.(2003) Effect of olfactory
function on nutritional status of Korean elderly women.Nutr
Res23, 723–734.
48. Mueller CA, Pintscher K & Renner B (2011) Clinical test of
gustatory function including umami taste.Ann Otol Rhinol
Laryngol120, 358–362.
49. Nilsson B (1979) Taste acuity of the human palate. III. Studies with taste solutions on subjects in different age
groups.Acta Odontol Scand37, 235–252.
50. Pingel J, Ostwald J, Pau HWet al.(2010) Normative data for
a solution-based taste test. Eur Arch Oto-Rhino-Laryngol
267, 1911–1917.
51. Schiffman SS, Gatlin LA, Sattely-Miller EA et al. (1994)
The effect of sweeteners on bitter taste in young and elderly
subjects.Brain Res Bull35, 189–204.
52. Welge-Lussen A, Dorig P, Wolfensberger Met al.(2011) A
study about the frequency of taste disorders. J Neurol 258,
386–392.
53. Yang L, Wei Y, Yu D et al.(2010) Olfactory and gustatory
function in healthy adult Chinese subjects.Otolaryngol Head
Neck Surg143, 554–560.
54. Mojet J, Christ-Hazelhof E & Heidema J (2001) Taste perception with age: generic or specific losses in threshold
sensitivity to the five basic tastes?Chem Senses26, 845–860.
55. Enns MP, Van TBT & Grinker JA. (1979) Contributions of age, sex and degree of fatness on preferences and magnitude
estimations for sucrose in humans. Physiol Behav 22,
999–1003.
56. DeJong N, DeGraaf C & VanStaveren WA (1996) Effect of sucrose in breakfast items on pleasantness and food intake in
Proceedings
of
the
Nutrition
Society
57. Schiffman SS & Clark TB, 3rd. (1980) Magnitude estimates
of amino acids for young and elderly subjects. Neurobiol
Aging1, 81–91.
58. Weiffenbach JM, Cowart BJ & Baum BJ
(1986) Taste intensity perception in aging. J Gerontol 41,
460–468.
59. Gilmore MM & Murphy C (1989) Aging is associated with increased Weber ratios for caffeine, but not for sucrose.
Percept Psychophys46, 555–559.
60. Murphy C & Gilmore MM (1989) Quality-specific effects of
aging on the human taste system. Percept Psychophys 45,
121–128.
61. Weiffenbach JM, Tylenda CA & Baum BJ (1990) Oral
sensory changes in aging.J Gerontol45, M121–M125.
62. Zandstra EH & de Graaf C (1998) Sensory perception and pleasantness of orange beverages from childhood to old age.
Food Quality Preference9, 5–12.
63. Nordin S, Razani LJ, Markison S et al. (2003)
Age-associated increases in intensity discrimination for taste.Exp
Aging Res29, 371–381.
64. Chauhan J (1989) Pleasantness perception of salt in young
vs. elderly adults.J Am Diet Assoc89, 834–835.
65. Dermiki M, Suwankanit C, Nilkamhaeng S et al. (2011)
Taste enhancement of savoury food aiming to increase
acceptance by an elderly cohort.Proc Nutr Soc70, E177.
66. Stewart-Knox BJ, Simpson EEA, Parr Het al.(2005) Zinc
status and taste acuity in older Europeans: the ZENITH