Theoretical framework for applied climate education: 3. Evaluating applied climate research, development and extension processes and their outcomes in agriculture.
26
0
0
Full text
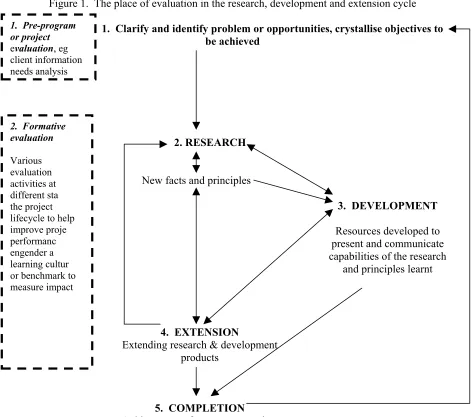
(2) and whether they occur at critical times also impact on agricultural practice. Climate also has a tremendous impact on natural resources as soils can be degraded by high intensity storm rain; river heights can vary, being swollen by floods or turned to dry holes depending on the variability of the climate. Drought events may be as short as a season, or extend to years. Fortunes for farmers, businesses and communities may vary due to direct and indirect influences of climate. In the last decade major effort has been expended in applied climate science in Australia to better understand the causes of our variable climate and forecast this variability to help farmers, communities and food and fibre chains better manage their variable climate. How successful have these efforts been is a valid question? How can applied climate RD&E make a positive difference, how can we measure how efficient and effective that work is – this is one role of evaluation? Evaluating applied climate extension programs has provided useful insights into the impact of this work (George et. al. 1998, 1999a,b, 2000). The principles of Bennett’s hierarchy (Bennett 1976), commonly used to evaluate extension processes, also have application for evaluating R&D processes and activities. Bennett’s hierarchy covers evaluation attributes such as inputs, activities, people involvement, reaction and KASA change, end result and practice change (more detail on all of these are provided in the section Some guidelines for evaluation) which are also common to some degree in all components of RD&E programs. RD&E and its interaction with evaluation - the goal is excellence! Figure 1 depicts research as an iterative process, not a ‘one-way’ path that may achieve, partially achieve or even not achieve its goals or objectives. The pathway from ‘research to client’ has various inputs from RD&E processes. New facts and principles contribute to the direction and end point of research and resources developed and extension may also contribute and enhance research efforts and directions. On this ‘connective’ pathway, for simplicity sake let’s call it a ‘communication’ process, research alone cannot achieve its objectives - the whole is greater than the sum of the parts must hold true for this process. Evaluation activities can provide opportunities for program or project team members to interact with, or learn, the views, needs and suggestions of target audiences, stakeholders and colleagues pre, during or postprogram or project to improve performance, planning, decisions, identify processes that may need changing or prove impact. They can help applied climate researchers, modellers and extension staff identify effective methods to communicate research to a target audience, determine client levels of knowledge and use of climate information, information needs, practices, preferences and likely adoption of research (Keogh et. al. 2000a, b). Evaluations may also be used as a basis for fund allocations and accountability to assess the use of funds (AACM 1997). Scriven (1975) says evaluation design must sometimes consider issues beyond validity and credibility, such as certification and accountability. Ultimately the goal of evaluation is societal benefit. Metaevaluation is a process useful for major evaluation studies to review the evaluation process itself, for example its design, method and process, identify strengths and weakness of the study or recommend how similar future studies might be improved (Sanders 1994; Keogh et. al. 2000b). Useful climate research and information that cannot be understood by a target audience, is untimely or difficult to interpret is unlikely to be used. Only an effective evaluation program is going to identify and provide this information..
(3) Figure 1. The place of evaluation in the research, development and extension cycle 1. Pre-program or project evaluation, eg client information needs analysis. 1. Clarify and identify problem or opportunities, crystallise objectives to be achieved. 2. Formative evaluation Various evaluation activities at different stages in the project lifecycle to help improve project performance, engender a learning culture or benchmark to measure impact at end of project. 2. RESEARCH New facts and principles 3. DEVELOPMENT Resources developed to present and communicate capabilities of the research and principles learnt. 4. EXTENSION Extending research & development products. 5. COMPLETION Achievement of program or project objectives. 3. Post-evaluation: Summative evaluation helps measure impact, success, ideas for new projects, reflection and improvements for the future.. 4. Metaevaluation – ‘evaluates’ theevaluation evaluation, can aid credibility of findings identify ways to improve RD&E and its interaction with processes, excellence is theand goal design of future evaluation studies.. Figure 1 depicts research as an iterative process, not a ‘one-way’ path that may achieve, partly.
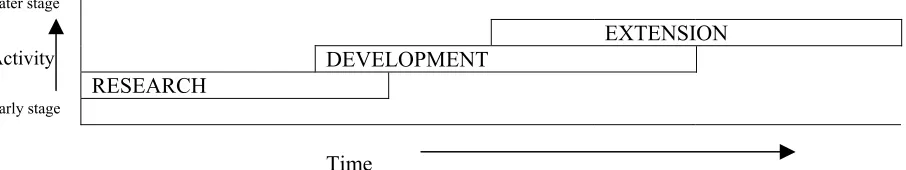
(4) When to evaluate applied climate RD&E? One dilemma in evaluating RD&E is timing, because research, development and extension processes may not occur simultaneously (Figure 2). Figure 2. The relationship between research, development and extension over time. These activities do not occur simultaneously but are staged processes, with research being the primary activity, usually followed by development and then extension. Later stage. EXTENSION Activity. DEVELOPMENT RESEARCH. Early stage. Time Research to understand a climate system may take a number of years and require data for at least a thirtyyear period from numerous locations often around the world. Mechanisms to substantiate data are needed and often support data from oceans and atmospheric research. The period from research to extension may range from 2 to 15 years and so evaluation planning requires long-term vision, flexibility and may be ongoing in nature. Development and extension can only commence once research has results or is almost complete and this may take a number of years. For example, in Australia research of the El Niño Southern Oscillation phenomenon (ENSO) was established in the early 1980’s with McBride and Nicholls (1983) and development of tools for farmers to use, such as Rainman (Clewett et. al. 1994), began in the late 1980’s (Clewett et. al. 1988, 1989, 1992, 1995a,b). Widespread extension of ENSO-based climate information did not occur until August 1989 in Queensland and later in NSW (Conroy and Clewett 1989, George 1998, Clewett et. al. 1997). The period for RD&E has taken, on a conservative estimate, 18 years. There have been numerous Federal and State bodies involved in each of these activities. There has not been one overseer of the whole RD&E process but rather individuals within organisations that have taken it upon themselves to evaluate their programs. Without coordination, evaluation must be seen to be on an ad-hoc basis, which leads to a piecemeal and non-integrated approach. This could be remedied in the future with a more coordinated and integrated evaluation process that begins with planning the evaluation steps at the very same time applied climate RD&E programs are being set up. Even though the evaluation of RD&E programs may be difficult (as described above), the greater societal benefits are believed to outweigh the problems. Evaluation may need to be ongoing due to changes which may occur in the agricultural sector, which could affect producers’ ability to access information. For example, technological advances like the internet and increased capacity to store climate data for specific locations has been a bonus for many farmers but was unavailable until about fifteen years ago. Keogh (2000a,b) reported a decreasing popularity of extension officers and group meetings as methods for accessing decision support information by irrigators and graziers. The wider spread of the internet and farmers’ ability to access up to date climate information and forecasts from remote parts of Australia may have contributed, in part, to this observation. In answer to our question then about when is the most appropriate time for evaluating applied climate RD&E, the answer is simply establish an evaluation plan and ensure evaluation is enacted throughout the process. However, evaluation for evaluation’s sake is not our goal. It has to provide information to make better projects and outcomes. This will be elaborated further in this paper. Terms used in this paper Research is considered diligent and systematic inquiry or investigation into a subject to discover facts or principles, for example discovery of new predictors such as SOI Phases used to produce more accurate forecast systems. Development refers to the process of drawing out the capabilities or possibilities of the.
(5) research to more advanced or effective states, such as in the form of outcomes or outputs like applied climate workshops, computer software, seasonal climate forecasts, publications or web-based information. Extension has traditionally been a service predominantly targeted at farmers to communicate, for broader adoption, research principles and new knowledge and development products and information. The place of evaluation in the RD&E process is diagrammatically represented in Figure 1. RECENT CASE STUDIES Recent applied climate evaluation case studies in Australia Examples of evaluation case studies are useful background information on the topic. They may also be useful as a model to consider for developing other evaluation studies. The following nine studies explored knowledge, understanding, applications of climate information and technology to decisions or likely technology uptake. 1.. Irrigator study in NSW and Queensland. Research on the predictive signal of streamflow using the SOI in the Border Rivers catchment of the Murray-Darling Basin was nearing completion, but would the project’s research be useful to irrigators, did irrigators have sufficient knowledge of climate signals to use them in planning, who do they consult on decisions, what are their information needs and preferences? These were a few of the evaluation questions explored in a mail survey in August 1999 of all 931 regulated irrigators (18.7% response rate) in four catchments of the northern Murray-Darling Basin. The study was an internal context evaluation based on the CIPP model (context, input, process, product) (Madaus et. al. 1983) and elements of Bennett’s hierarchy (Bennett 1976), to gain an understanding of irrigator knowledge and use of climate information, practices, information needs and preferences for accessing decision support information (Keogh et al. 2000a, 2000b, 2002a, 2002b). Results were used to aid development and technology transfer of an information system using climate indices to forecast streamflow and water availability and in design of the project’s extension and communication strategies. A focus group was also formed comprising interested respondents and private consultants who are currently engaged in continuous evaluation of a suite of decision support tools under development (Keogh et. al. 2000a, 2000b, 2002a, 2002b). A snapshot of climate extension in northern NSW and southern Queensland and an indication of likely research uptake in the region also emerged. Examples of findings included 29% of respondents apply the SOI to farm decisions and given advance information on likely water availability up to four months ahead of irrigation season, 73% may change their area decisions and 43% crop type. Amongst other findings, the survey highlighted the high use of consultants by irrigators and as a result private consultants were included in focus groups. The aim of the focus groups was to gain irrigator and private consultant input into: •. Timing & frequency of forecast. •. Format of forecast. •. Which variable to forecast. •. Feedback on FLOWCAST software. Participants at the first focus group meeting advised they preferred probability of pumping days as the forecast instead of volumes. The project team spent a considerable amount of time on this issue and it has subsequently been incorporated into the program. This issue was identified as being important by the survey that found off allocation (high flow) pumping opportunities was in the top five of twenty-two important factors when deciding cropping area. Participants had difficulty understanding one of the graphs used in the FLOWCAST software package. This graph displayed data in a bar chart format. They made comment on the text used to label the bars. This resulted in a change being made to the software program..
(6) An output from the second focus group meeting was a pre-planting forecast for summer crops in 1999. Growers at the focus group meeting requested this be sent to them by faxstream. At the focus group meeting in September 2000 participants reported that the information on streamflow provided to them in 2000 by the project’s extension officer had been very useful and requested it continue. Participants suggested a forecast as early as possible in the year, i.e., when the May SOI phase is known, providing it is stable. If it is not stable then this first forecast for the year would be released in June or July. A second forecast in September/October would serve as a pre-plant forecast which was seen as useful as growers still had time to change some planting and other decisions. Feedback through the focus group process reinforced the findings of the survey that faxstream, mass media and internet download were the preferred methods of forecast dissemination. Irrigators asked whether it is possible to forecast the number of days during irrigation season (OctoberJanuary) streamflow will exceed a certain gauge height at a particular gauging station (say, 5-metre gauge height for MacIntyre River at Goondiwindi). This information would help estimate their pumping opportunity. The project team later discovered this was intended to be used as a forecast of likelihood of overland flow using a rule of thumb. 2.. Grazier study in western Queensland. A study similar to the irrigator study above (Keogh et. al. 2002b) was undertaken in December 2000 with 100 randomly selected graziers (43% sample response rate) in western Queensland. This was a formative, internal evaluation using a mail/phone survey to explore grazier knowledge and use of climate information, practices and preferences to aid project planning and benchmark impact. Findings included 36% of respondents apply the SOI to enterprise decisions, however 92% were unaware ENSO’s predictive signal is stronger for pasture growth than rainfall in this area, suggesting they may be unaware of the potential value of pasture growth forecasts. Results are influencing how climate information is being disseminated to graziers in the region, design of workshop curricula tailored to gaps identified in grazier knowledge and also provide a benchmark against which to measure project impact at end-of-project when the study will be repeated with respondents or another random sample to collect evidence of impact (Keogh et. al. 2002b). 3.. Climate and Agriculture Workshop evaluation in NSW. From May 1997 to September 1998, 136 Climate and Agriculture workshops were held in NSW, involving 1935 participants. Participants were surveyed at the completion of each workshop so the presenter was able to use information to improve content and style of future workshops as well as to assess knowledge and skills change of participants. Learning outcomes were established prior to the workshops being run, with workshops developed around those needs. Analysis of completed surveys of 623 participants from 42 workshop sessions showed the level of skills and knowledge change following these workshops. Telephone surveys of a smaller population was used to determine ‘end results’ and ‘practice change’ as a post workshop evaluation (George et. al. 1998, George et. al. 2000). Suggestions for improving the workshop content and style were implemented. Clients expressed the opinion they were able to make better decisions on such things as sowing rates and timing, fertiliser rate and timing, spraying rates and timing, crop and livestock balance and manipulation, long term planning and forward selling options. Clients also expressed greater confidence in their decision making and also better selective climate information integrating with their farm decision making. 4.. Managing for Climate Workshop evaluation in Queensland. In May 1999, a census of all 204 participants (83% response rate) who attended Managing for Climate Workshops in Queensland from 1997 to early 1999 was conducted by external market research consultants (Colmar Brunton 1999a, 1999b). A telephone survey was used to determine workshop effectiveness and outcomes, areas that might be improved and collect case study information about how participants applied their new knowledge to decision-making. Examples of findings included 89% of respondents found the workshop useful to their business and 70% have used the skills learnt to some extent; and participants.
(7) provided examples of short or long term decisions aided by the new knowledge and skills gained at the workshop (Colmar Brunton 1999a, 1999b). A number of suggestions for improving workshop content and process were identified and subsequently implemented by program staff. 5.. Evaluation of the international course “Applications of Climate Forecasts to Agriculture”. Two internal evaluation studies using written questionnaires were undertaken on the international training course Applications of Climate Forecasts to Agriculture held in Toowoomba, Queensland in February 1999 attended by 21 national and international participants. The first study immediately followed the course (85% response rate) and sought to obtain feedback to assist development of similar future courses, assess knowledge and skills acquired by participants and devise an action plan for knowledge/skills participants would like to develop further (Keogh 1999). A number of recommendations emanated from this evaluation. Eighteen months post-course, an impact evaluation (36% response rate) explored course impact on participant operations, methods and professional collaborations. It also gathered case studies of how participants are using seasonal or climate forecasting, what they plan to do differently, barriers encountered and directions they believe important to the future of climate science research and application for agriculture (Keogh 2001). These studies found the course had a major impact on participant knowledge and skills, work practices, methods and professional collaborations and also ultimately attracted international external funding for continued work. Participants saw a need to intensify communication worldwide to progress regional and international collaborations; monitor for early signs of climate anomalies; increase teamwork and information sharing. Their progress has been impeded by limited access to resources, funding, yield models, key global data sets and tools for analysis. 6.. Australia-wide survey of graziers and pastoral agribusiness. In 1999 an Australia-wide purposive survey of 364 (60% response rate nationally) grazier and pastoral agribusiness managers was undertaken using a written questionnaire in order to: measure the knowledge, attitudes, skills and aspirations of graziers and pastoral agribusiness managers pertaining to the assessment of seasonal conditions, including the use of seasonal climate forecasting; ascertain how pastoralists currently assess seasonal conditions, the decision-support information/tools they access, and how the information is used in making key property management decisions; and provide a sound basis for the development of communication and extension strategies in order to achieve effective and efficient transfer of information and technological outputs of the Aussie GRASS research program (Paull and Hall 1999; Paull and Hall 2000). Detailed results for individual States were published in five reports (Crichton et. al. 1999; Dyer et. al. 1999; Paull and Hall 1999; Roche and Watson 1999; Tynan 1999). Examples of some results include: 37% of respondents use seasonal climate forecasts in decision-making; 96% maintain daily rainfall records for use in important daily and seasonal decision–making; 53% of participants who have used the Aussie GRASS products have found them ‘moderately useful’ to ‘very useful’ (Paull and Hall 2000). Valuable information was also gained on decision-support information needs and convenient methods for access. The feedback provided valuable guidance for the subsequent development of effective communication plans and extension programs in the various pastoral regions of Australia. For example, some key findings used were: our extension program needs to help graziers to make better use of their valuable rainfall records, and other climatic records (75% of respondents did not use long-term climatic records to assist in decisionmaking); graziers are likely to be receptive to training aimed at a better understanding of seasonal climate forecasting, and the use of such information; respondents should generally be receptive to Aussie GRASS extension activities; users of Aussie GRASS products have some problems with interpreting and using information (22%), and information is not detailed enough for some (there are also some reservations about product accuracy and forecasting ability); there appears to be strong support for the concept of Feed Shortage Alerts (70%), and moderate support for the provision of warnings of possible deterioration of pastures (52%) or soil (44%)..
(8) 7.. Evaluation of seasonal climate information by cropping farmers in South Australia. In 2000, a decision support trial with 42 farmers in low rainfall cropping districts in South Australia was evaluated post-sowing using a questionnaire (83% response rate) and workshops, to test the value of providing seasonal climate and crop production risk information to aid decisions affected by seasonal yield variability. It examined how farmers applied this information to decisions (Truscott et. al. 2000). Results included importance rankings by participants of different decision support information. Farmers in the trial generally recognized the high value of early season rainfall as an indicator of final yields in these districts. Since early season rains were good for most of the trial farmers in 2000, most increased crop area and inputs in anticipation of above average yields. The forecast indicators such as the SOI and sea surface temperature patterns gave no strong indication of a likely shift to either a below or above average season in 2000, so this information was of little additional value to most of the farmers. But the vast majority considered that such forecast information would be of much greater value to their decision-making in a season with a late break or marginal soil moisture at sowing. 8.. Assessment of Rainman. In October 2000, marketing students from the University of Southern Queensland completed a report looking at the development of a marketing strategy for Australian Rainman (Moloney et. al. 2000). Rainman is a software tool that analyses rainfall for better management. An Australia-wide survey of 1000 primary producers was undertaken with a 22% response rate. Although the survey was primarily for the purpose of developing a marketing strategy, it also served the purpose of providing useful background information as to who and when clients use or do not use software tools, and what are obstacles in greater uptake of development tools. The major findings of the work included: for awareness of products, field days and practical demonstrations were the most practical option; pamphlets and building relationships with agronomists or other experts or consultants was considered the most effective method of communicating the benefits of the software; and, there was a need to be more targeted in a communication process to ensure there is higher uptake of technology – the latter included the development and implementation of a marketing strategy. These main findings have been considered in the continuing development of Rainman. 9.. Evaluation of reports on seasonal conditions in Queensland. Over the last decade, a monthly Drought Report was prepared by the Queensland Department of Primary Industries (QDPI) at the end of each month, from field reports, and distributed widely by mail. In 1997, the Climate Impacts and Natural Resources group, in the Queensland Department of Natural Resources, commenced the production of a coloured monthly report entitled ‘Summary of Seasonal Conditions in Queensland’ which was mailed to clients early each month. It became obvious that it might be more effective and efficient for the two Departments to produce a single monthly report on seasonal conditions in Queensland, combining the information from field reports, seasonal climate forecasts, satellite imagery, and spatial mapping products from running pasture-growth and crop models. While this seemed like a good idea, a number of questions arose which needed to be considered, for example: • • •. Who are the clients for such information? What information products are valuable to particular groups of clients in running their businesses? How do clients want particular types of information presented?. Recipients of the QDNR and QDPI Seasonal Conditions Reports were invited in 2000 to evaluate the usefulness of these reports, and to comment on a proposed new report format (Day and Paull, 2001). Out of approximately one thousand recipients of either or both reports, thirty people indicated their willingness to participate in the survey, and subsequently completed a mailed survey questionnaire. The main results included: most respondents (85%) considered assessment of seasonal conditions very important or fairly important in their planning or decision-making; all respondents found the information.
(9) presented in existing QDPI/QDNR reports useful to some degree, with 83% regarding the information ‘moderately useful’ or ‘very useful’; most respondents considered the information in the reports to be accurate (71% ‘fairly accurate’ and 25% ‘very accurate’); the new prototype report was generally viewed as an improvement on existing reports, and 85% of respondents rated it as ‘fairly good’ or ‘very good’. The main outcomes resulting from the Project were: many comments supported the new prototype report an attempt to combine the content of existing reports and include additional new information; many suggestions to improve the value of the reports were obtained and acted upon by the development team; and based on feedback from the survey, and in consultation with QDPI (Rural Risk Strategies Unit), further prototype reports were developed. What are some lessons learned from the case studies? Some conclusions that can be drawn from evaluations from all of these case studies are: • Researchers are able to be kept informed as to the needs of clients • The development of resources can be justifiably improved, amended, identified or deleted according to an objective and ongoing process • Extension services can be refined though time to ensure end-users needs are met • There are better ways to obtain and communicate issues about the variable climate and forecasts, analyse implications of the forecast on outcomes of decision options, weigh-up decisions and assess the outcomes. These need to be continually applied. • There may be an ongoing measure of knowledge and skills improvements in clients that demonstrate and quantify how effective and efficient a program is at achieving its objectives and outcomes. SOME GUIDELINES FOR EVALUATION Is evaluating applied climate science programs and projects different from other evaluations? Possibly not, however as this is a new area of research it is too early to make definitive statements about differences. The nature of the scientific data being communicated is largely probabilistic – challenging concepts to communicate. Considering evaluation is just ‘...all too hard…’ should be a least preferred option – we need to get ‘in touch’ with our audiences not ‘out of touch’. Table 1 attempts to provide a starting point to investigate possible evaluation activities for climate RD&E..
(10) Table 1. Stages of the research, development and extension program cycles and suggested methods for evaluating the different stages 1 Identify and reach consensus on program goal(s) and objective(s) aimed for and key evaluation questions considered vital to success(a) 2 Assign a role for research, development and extension to achieve the agreed goal(s) and objective(s) (a) 3 Identify key stakeholders and end users (hereafter called ‘clients’) of research, development and extension services to consult(a) 4.1 Research - diligent and systematic inquiry or 4.2 Development – developing materials in the 4.3 Extension - communicating and disseminating research and development information and products to enable a more investigation into a subject in order to discover form of outcomes and or outputs including sustainable, efficient and effective farming system. Collecting facts or principles Decision Support Systems, machinery, chemicals, computer software, books, writing of evidence of ‘extension’ impact, successes and barriers to communication books and materials for distribution, creating web sites 4.1.1 Clarify role of research in relation to the roles 4.2.1 Clarify role of development in relation to 4.3.1 Clarify role of extension in relation to roles of research and (a) (a) of development and extension roles of research and extension development(a). 4.1.2 Discussions with clients and stakeholders on needs and areas to research(a, f). 4.2.2 Listing of problem(f). What is the problem being investigated? What is the end-point you would like to see? What development tool is proposed to help achieve the end-point?. 4.1.3 Establish title of the study(b,c). 4.2.3 Identify target clients and current levels of knowledge required to understand and apply the research and key technical concepts(a) 4.2.4 Description of appropriate materials to develop(a, b, c, d, e).This is to help make sure the development tool designed is applied and used as designed.. 4.1.4 Literature search(b,c). 4.3.2 Identify underpinning knowledge and skills required by extension officers and end users to facilitate adoption of research(a,. b, c, d, e). 4.3.3 Inputs(a) 4.3.4 Activities(a).
(11) 4.1.5 Establish research objectives that are Specific, Measurable, Achievable, Realistic, and Time framed(f 2). 4.1.6 Establish a theoretical framework which includes research questions to investigate and hypotheses to test(f 2,) 4.1.7 Methodology(f 2, 3). 4.2.5 Identify and trial appropriate material development with end-users. Explore and have clients critique material, identify areas of improvement, barriers to understanding and adoption to improve relevance and understanding (a, b, c, d, e) 4.2.6 Define the pre–requisite and/or underpinning knowledge and skills to enable materials, products and information to be accurately interpreted and applied to decisionmaking (a, b, c) 4.2.7 Interaction of climate variability and climate forecast with intricacies of the target system. This needs to be emphasised(a) This is to help make sure the development tool designed is applied and used as designed.. 4.3.5 People involvement(a). 4.3.6 Reactions(a, b, c). 4.3.7 Assess Knowledge, Attitude, Skills, and Aspirations change of end-user(b, c) 4.3.8 Practice change(c, e) 4.3.9 End result(c, e). 4.1.8 Data collection and result collation(a, b, c, e) 4.1.9 Data analysis(a, b, c) 4.1.10 Discussion and conclusion(a, b, c, d. e, f) 4.1.11 Communication of findings(d) 4.1.12 Identification of new areas/new directions to research in collaboration with decision makers(a, f) 5 Communication of research findings to key stakeholders and end users as well as those involved in ‘development and extension’(a) 6 Analyse end result and practice change (c, e) 7 Measurement of level of achievement and assessing if this has been an acceptable level of achievement or not? (a, b, c, d, e) 8 Communication of results to decision makers and target system and involving a debrief of better ways to work independently and integrated ways for future R, D & E(a, f) 9 Developing the next stage from what has been learned through this process(a, f) Techniques to collect data for the purpose of evaluation which may be obtained by survey or discussion: (a) (b) (c) (d) (e) (f). focus group discussion (eg. LENS method see Spencer 1989) open question techniques (qualitative) closed questions (qualitative and quantitative) ORID questioning (covering observations, reflections, interpretation and decisions) SWOT questioning (covering strengths, weaknesses, opportunities and threats) Participative problem solving based on Kolb’s learning cycle: 1 Exploring (using mind maps and brainstorms) 2 Analysis of problems (using time-line historical analysis, semi-structured interviews, cause and effect discussion, information tabulation and graphs, issue analysis).
(12) 3 4. Deciding solutions (using issue analysis with strategic and tactical planning) Acting (including discussion on choices-chances and consequences, ensuring risk is minimised yet balanced with maximised opportunity). This table shows there is a role for R, D & E to be evaluated separately but ideally it should be undertaken in an integrated way (Dart et. al. 1998, Posavac and Carey 1997). Firstly, a goal and objectives or hypothesis, must be established. Secondly, a clearly defined role for RD & E to play in achieving these objectives. Next, determine how they (RD & E) may integrate with each other in that process and include end-users in that discussion. There is a need to define what is considered to be ‘success’. For example, 70% of people attending workshops have improved their knowledge and skills in better managing their variable climate (this may then lead to other pertinent questions such as why or why not this was achieved). There is a need for assessment as to whether that has been an acceptable level or not. The problem has always been who makes that judgement? Previously the problem has been an ability to just continue with work with no accountability and whether the ultimate objective that was supposed to be achieved has actually been achieved. A third step is the identification of key stakeholders to consult, with a fourth step then being the need for a model that independently and yet collectively integrates evaluation of RD & E along each stage of the process. A fifth step is the need to communicate the results to key stakeholders. It then follows a measure of ‘end result’ and ‘practice change’ is needed. A debriefing which involves people involved in RD & E, to see if the processes have been successful or not, or if there have been problems in that process with either component, or all of them together. Finally, working together with representatives from RD & E, clients and key stakeholders that will help develop the next stage of the process of what is to be achieved..
(13) Resourcing evaluations As a general guide, funding for program evaluations may range from between 0.5 and 3% of total investment; evaluations in the project cycle of the World Bank typically cost between 0.6% and 1% of total investment (AACM 1997). The Australian Centre for International Agricultural Research (ACIAR) allocates 0.7% of its budget to evaluation (Lubulwa 1996). Why is evaluation so difficult? There are many decisions associated with planning and conducting evaluations, such as whether to undertake benefit/cost analyses, evaluate social costs and benefits associated with a research program techniques (Drummond et. al. 1987; AACM 1997) or investigate social, economic and environmental issues and indicators which are likely to require a substantial budget. Should the study be a stand-alone evaluation or one of a suite, and if so how can these studies correlate, interact and collectively measure? Do you need a ‘Rolls Royce’ evaluation or a simple snapshot study; is representative sampling important, is there a need for case studies or will indicative information suffice; what are the trade-offs of these choices; what can you afford; what will be useful? ‘Politics’ are inevitably associated with evaluation and this can often impede and sabotage implementation of evaluations. Project team members may associate evaluation with being ‘personally measured’, scrutinised or judged. There is often a fear negative results will be found, that will mean changes to a work program that some may be reluctant to implement. It is important in evaluation design to factor in plenty of objectivity and consider the welfare of those being evaluated and those evaluating (Sanders 1994). For program or project team members to benefit from new insights and others’ points of view they need a healthy attitude toward learning or there is wasting of resources doing evaluation for improvement. What models can be used to design evaluation? There are over 60 different approaches for designing evaluations (Worthen et. al. 1997). To a large extent, the study and models used will be determined by available resources and key evaluation questions. There are a number of checklists, guidelines, models, approaches and frameworks for designing and reporting on evaluations (Scriven 1975; Patton 1982, 1987; Sanders 1994; Fink 1995; Wissemann 1992,1994; Posavac and Carey 1997; Krueger and Morgan 1998; Woodhill and Robins 1998; Rural Extension Centre 1999; McDonald 1998). Design standards and guidelines for conducting evaluations are specifically documented and discussed in Sanders (1994). The orientation of the evaluation, whether to improve, prove or both, will influence timing and approach. It is important to design the evaluation with decision-making in mind (Luukkonen-Gronow 1987). There is not a lot of value in collecting data just because it is interesting. Involve the project team by exploring their understanding of program or project goals, to identify project activities and factors critical to success that might be monitored, reviewed and evaluated. The internal logic of the program (Dart et. al. 1998) should be explored with staff, stakeholders and end-users. Exploring these factors with project staff, clients and colleagues will help obtain a richer view of what success means to different parties. A literature search of previous evaluation studies locally and overseas is also highly recommended. Rules of thumb and pitfalls likely when evaluating applied climate RD&E Dynamics that can emerge include the temptation to survey or consult only likely early adopters or land/resource-wealthy, rich farmers. Evaluation is for societal benefit and studies representing groups of all producers, irrespective of wealth or size of landholding, should be undertaken. Response rates from smallholding farmers may be lower than other groups, but you cannot assume this will be the case. RD&E can be evaluated separately however an.
(14) integrated approach is preferable. Decisions also need to be made as to whether to evaluate pre, during or post program, or even throughout the whole program. It is important to think through very carefully the evaluation activities believed to improve or prove your work. A few simple rules of thumb when designing evaluations include:• •. • • • • • • • • • • •. •. Allow at least a third of your evaluation project time for planning your evaluation. Develop evaluation research questions, hypotheses or key questions and ask team members, intended end-users, stakeholders and funders their perception of program or project success – what should happen and likely project activities or issues which could be monitored or reviewed to improve achievement of goals and objectives. Investigate the best method and time to collect data. Will random sampling be used or will you survey the whole population? Aim for rigorous design and representative sampling if possible. Consider how the data should be analysed; to whom and how results should be communicated. Do this early in your planning. Consider using other organisation’s performance indicators, such as funding bodies, or develop your own set. Ideally engage three or more different methods and audiences for collecting data to triangulate and cross-check evaluation data (Dart et. al. 1998). Pre-test your survey instrument with a wide audience including a representative and small percentage of those to be surveyed as this is vital to success. A project team with an open mind and good attitude to learning will benefit from or use new information and insights gained in evaluation studies. Ensure you have a good communicative team. Communication of results to stakeholders and discussion amongst researchers, developers and extension specialists will enrich interpretation of your results. Share findings with colleagues working in similar areas as this may assist them in their work. If you involve a broad range of people (stakeholders, team members) in the above activities, this is likely to considerable improve data collection and interpretation. Maintain high integrity in dealing with data and in confidentiality. Be objective, ethical and honest. There are no shortcuts in evaluation, if you want to collect meaningful data – you need good models and to invest time. You might combine existing models or decide to design your own models to answer your key evaluation questions. Prepare and plan for this in time and resources. Understanding the context in which agricultural producers or managers make their decisions is important – and this may change. Current information is important, for example, there may be sudden increases in internet access in remote areas or amongst particular groups of producers which affect extension officers running workshops. Circumstances change and when they do, documenting and incorporating these observations and results into evaluations is valuable.. General steps in designing evaluations based on Bennett’s hierarchy Bennett (1976) outlines a chain of seven events in extension programs 1. Inputs. These relate to the resources required within the program such as people, money, vehicles.. 2. Activities. With inputs there are activities, for example, field days, workshops, publications..
(15) 3. People Involvement. Within such activities there are people who participate in them.. 4. Reactions. Given such involvement there is an emotional response to the activities which they were involved in, like / dislike, enjoyable / unenjoyable etc.. 5. KASA Change. The nature of the above reactions will determine change in knowledge, attitudes, skills and aspirations (KASA).. 6. Practice Change. Practice change refers to the application of changes in knowledge, attitudes, skills and aspirations, to a particular situation. A change in practice, could also mean that an existing practice may be reinforced.. 7. End Results. The attainment of the extension program objectives, eg. 68% of producers now use forecasts and applied climate software and learning tools in making enterprise and business decisions and choices.. While these seven steps represent a general chronological process, there are situations when steps can be left out or repeated, depending on participants’ background, knowledge, attitudes and situation. Survey template and model used in evaluating climate education An example of an evaluation using Bennett’s approach (Bennett 1976) to evaluate climate workshops held in NSW and Queensland is shown in Appendix 1. The model is used for information to improve content and style of future workshops as well as to assess knowledge and skills change of participants, as well as a basis for follow-up assessment of end result and practice change. In this example Queensland Centre for Climate Applications (QCCA) staff costs in conjunction with other resources are the inputs who manage and orchestrate events, in this case a workshop on "applied climate and agriculture". Attendees participate in a number of learning activities associated with applied climate and agriculture research principles. During and post-workshop participants have reactions to their experience which may contribute towards changes in KASA (knowledge skills, attitudes or aspirations). If engendering sufficient confidence and motivation, these changes may lead to practice change and alterations in producer practice, for example application of climate forecasts to farming decisions and, ideally, to a change in situation, and hopefully an improved situation. Appendix 1 shows the questionnaire used in this study of NSW and Queensland participants who have attended workshops. The aims of these evaluation studies were to highlight:• • •. How the workshop presentation and content could be improved Examine skills and knowledge levels of participants Provide a baseline to measure in the efficiency and effectiveness of work with positive social, economic and environmental impacts.. Decisions to improve workshops were adopted following client comments. Other findings of these studies from farming clients highlighted they were able to make better decisions on such things as sowing rates and timing, fertiliser rate and timing, spraying rates and timing, crop and livestock balance and manipulation, long term planning and forward selling options..
(16) Clients also expressed greater confidence in their decision-making and also better selective climate information integrating with their farm decision-making. AN APPROACH TO CONSIDER Approaches for evaluating five events described by Bennett are outlined below Evaluating extension involves assessing people involvement; reactions; KASA change; practice change; and end result. Bennett (1976) considers each stage should be evaluated. This may appear time consuming however careful design considering the different agenda and goals of these events can achieve this. Involving experienced staff and end-users in design and critiquing evaluation instruments can be very worthwhile and may improve the quality and interpretation of information collected and ultimately evaluation results. 1. People involvement: Gathering quantitative data on who is involved and their central characteristics (often referred to as classification data) can be gathered in a simple questionnaire to determine the characteristics of people attending particular workshops and to likely target audiences. 2. Reactions: Essentially the aim is to try to establish how people felt about the workshop, or research or development tool, why they felt this way and how they believe the process of the workshop, or research or development tool could be improved. There are a number of techniques that can be used in a qualitative discussion including ORID and SWOT discussions, focus groups and administration of questionnaires (Spencer 1989):ORID discussion (Spencer 1989) * * * *. Objective Reflective Interpretive Decisional. What happened? How did you feel about that? What did it mean to you? How could it be improved?. SWOT discussion (Spencer 1989) * * * *. Strengths Weaknesses Opportunities Threats/Constraints. What were the strengths of today’s climate workshop? What were its weaknesses? How could the climate workshop be improved? What might threaten/constrain future climate workshops (and how might these constraints be overcome)?. Focus Group discussion This involves posing a number of broad, open-ended questions to workshop participants in a facilitated workshop. Practical tips on conducting focus groups may be found in Krueger and Morgan (1998). Questionnaire The quantitative questionnaire is another means of gathering people’s attitudes towards their experience. A potential limitation of this method is that it does not provide people with the opportunity to make comment outside of the questions asked. To overcome this a mix of open and closed answer questions should be used (quantitative and qualitative). Open questions allow the participant to provide their own answer, while closed questions ask the participant to choose from a selection..
(17) The first part of the questionnaire should determine participant characteristics, followed by questions on their feelings and emotions towards the particular workshop, then questions to determine any KASA change. This questionnaire should complement qualitative discussions, which could be based on any other techniques outlined. Follow-up studies should be undertaken to determine how the practices and information presented in the workshop may have been implemented and how these could have changed the participant’s situation. Timing of these follow-up surveys will vary and for a workshop might range from not less than three months to no more than a few years after the activity. These studies can help assess the success or otherwise of events and collect evidence of effectiveness, relevance, and efficiency of work. Examples of open-ended questions are:What did you think of the applied climate and agriculture workshop? How do you think the applied climate and agriculture workshop could be improved? Examples of closed questions are:For the statements below, please circle the score that best describes your assessment:. The applied climate and agriculture workshop was run in a professional manner. The section on incorporating climate into my work was explained in a professional manner. The exercise conducted on the climate skills audit was easy to follow. Strongly Disagree 1. Slightly Disagree 2. Not sure 3. Slightly Agree 4. Strongly Agree 5. 1. 2. 3. 4. 5. 1. 2. 3. 4. 5. There are a myriad of questions that could be used to explore what people felt and believed about the workshop and its particular components. The message is that both qualitative and quantitative techniques should be used and questionnaires always need to be pre-tested to ensure they are easily understood. 3.. KASA Change. This would have to be the most important part of any evaluation, the central objective of any extension activity is to bring about KASA change within a particular context – change in knowledge, attitude, skills or aspirations. To measure KASA change a questionnaire is usually used..
(18) Some examples of questions may include: For the statements below, please circle the score that best describes your assessment:. Has this workshop improved your skills in applied climate and agriculture (skills) Has this workshop improved your understanding of the terminology used within applied climate and agriculture? (attitude/knowledge) As a result of this workshop, do you feel you understand more about seasonal climate forecasts? (knowledge/skills) As a result of this workshop, do you think that you are now better able to plan for the variable climate? (attitude/aspirations/knowledge /skills) 4.. Strongly Disagree 1. Slightly Disagree 2. Not sure 3. Slightly Agree 4. Strongly Agree 5. 1. 2. 3. 4. 5. 1. 2. 3. 4. 5. 1. 2. 3. 4. 5. End Result and Practice Change. To cover these areas, clients should be surveyed post-RD&E activity using, say, a phone or mail survey or interview. The aim is to assess how changes in KASA may have impacted on participant practices. In this example, it might be to find out if clients used new climate tools or forecasts from research to change their activities, and assess what impact – positive or negative – this has had. It is evaluation of this final outcome that is so important. This evaluation activity may need to be repeated as applying knowledge, skills and information introduced in applied climate RD&E may not be immediate but take any number of years to incorporate based on the individual and uniqueness inherent in each farming system. Examples of open questions that may help evaluate ‘end result’ ‘practice change’ are: How has seasonal climate forecast information helped you to better manage your farm business? Please provide examples of how you have applied your improved climate knowledge and skills to better manage your enterprises and resources? How do you obtain information about the variable climate? What forecasts do you obtain? How frequently do you obtain forecasts? What are the critical times you obtain forecasts? How do you make sure you correctly interpret the forecast(s)? How do you determine the implications of the variable climate and forecasts on outcomes of decision options (eg. simulations, decision tree analyses, gross margin budget analyses…)? How well do you assess the ‘upsides’ and ‘downsides’ of ‘using’ versus ‘not using’ the forecasts?.
(19) In making a decision on your enterprises and resources, how well do you integrate climate information? How could this be improved? How do you evaluate outcomes of decisions, which integrate climate information and forecasts? Assess and explain how you have improved in your knowledge and skills to better cope with the variable climate? Please explain and quantify (in dollar terms), what you consider to be the value to your enterprises and resources, of your better understanding of the variable climate? Examples of participant responses could include: "...I am pleased I did the applied climate workshop - it improved my knowledge and skills and gave me the opportunity to talk about critical issues with others in a great learning environment. It made me make time for an activity that I might otherwise not have done, which would have been to my detriment..." "...the software tool showing how variable our climate is, and the forecast as it relates to my area now has helped me to make decisions for this coming season that I otherwise would have had to make in an ‘uninformed manner’ as I have in the future. This new information helps me to manage my business far better than I have previously…” “… knowing the current conditions on my farm at present, as well as looking at the forecast for my location and my competitors location gives me an edge in my business. To then integrate up to date marketing information, this will help me to know when (and if), to plant, and when (and if) to forward sell. This information is supremely important. By applying this information, I have the potential to gain many thousands of dollars…” “…there are several critical times a year I need to make decisions for my farming decisions that have impact for a considerable period of time. Knowing the climate forecasts from worldwide research and then using the tools developed that help me to analyse the forecast for my location, is a bonus my forefathers never had. I complete budgets on different scenarios, and by having knowledgeable extension staff that I can bounce ideas off with my potential decisions, is what I consider to be sound risk management for my business and resources…” CONCLUSIONS The minimum objectives for any applied climate RD&E to achieve (for agriculture), must be at least: • Enhanced decisions by applying information on climate variability and seasonal climate forecasts • Reduced climate risk exposure in business, agriculture and resource management • Improved knowledge and skills to better cope with the variable climate. It is only with well-considered and executed evaluation studies that we will know whether these objectives are being achieved or not. Useful and credible evaluation studies take substantial planning and effort. They can have the added benefit of building program team skills and contributing to a learning culture (Posavac 1997). Evaluation activities can improve program and project planning and performance and gather evidence of impact. Skill in designing evaluations is not instant or easy. It requires clear, creative thinking, time and substantial consultation with others to develop. Mistakes in design, analysis and interpretation may occur and techniques can improve over time. Like.
(20) exemplary project management, designing sound evaluations takes time, commitment, experience and guidance to achieve. The benefits of evaluating climate RD&E projects will lead to more efficient and effective work, with greater potential for more positive social, environmental and economic impacts. The cost of not seriously implementing evaluation is one that can be ill afforded in the future. ACKNOWLEDGEMENTS A discussion paper by Steve Orr (formerly NSW Agriculture) on evaluating extension using Bennett’s hierarchy is gratefully acknowledged. Comments on the paper were received by Arnold Wissemann, Graeme Hammer, Col Paull, Jeff Clewett, Neil Cliffe and Jim Egan. REFERENCES AACM International Pty. Limited prepared for LWRRDC. (1997). Guidelines for the selection of evaluation techniques to assess R&D Programs, Land & Water Resources Research and Development Corporation, Canberra, April. Bennett, C.F. (1976). Potential Policy Elements for Systemizing Evaluation of Extension Staff Development USDA, Washington. 23 p. Carroll, C., Rohde, K., Millar, G., Dougall, C., Stevens, S., Ritchie, R., and Lewis, S. (2001). Neighbourhood Catchments: a new approach for achieving ownership and change in catchment and stream management. Third Australian Stream Conference. Ed. Rutherford, I., Sheldon, F., Brierley, G., and Kenyon, C. Brisbane 27-29 August, 2001. Vol. 1: 121-126. Clewett, J.F., Young, P. D. and Willcocks, J. R. (1988). Effect of climate on agriculture in Central Queensland: 1 Rainfall variability analysis. In, The Changing Climate and Central Queensland Agriculture (Ed E. R. Anderson). Australian Institute of Agricultural Science, Central Queensland Sub-Branch, Conference Proceedings, Rockhampton, November 1988, pp. 43-52. Clewett, J. F. and McKeon, G. M. (1989). Understanding the Southern Oscillation and its effects on rainfall and pasture growth. Southern Oscillation workshop. Queensland Department of Primary Industries, Emerald, August 1989. Clewett, J.F., Owens, D.T., Clarkson, N.M. and Partridge, I.J. (1992). Rainman: Using El Niño and Australia’s rainfall history for better management today. In "Harnessing Information for a Smarter Agriculture". Proceedings of Australian Institute of Agricultural Science, National Conference, Launceston, Tasmania. Clewett, J.F., Clarkson, N.M., Owens D.T. and Abrecht, D.G. (1994). AUSTRALIAN RAINMAN: Rainfall Information for Better Management. Department of Primary Industries, Brisbane. Clewett, J.F., Kinninmonth, W.R. and White, B.J. (1995 a). Sustainable agriculture: A framework for improving management of climatic risks and opportunities. In, Sustaining the Agricultural Resource Base. 12th Meeting of the Prime Ministers Science and Engineering Council, Canberra, June 1995 Clewett, J., Clarkson, N.M., Partridge, I.J., and Abrecht, D.G. (1995 b). AUSTRALIAN Rainman: Progress and Prospects. Proceedings of LWRRDC Conference ‘Of Droughts and Flooding Rains’ Managing with Climatic Variability Conference. November 1995, Canberra. Occasional Paper CN03/96..
(21) Clewett, J., Cliffe, J., Drosdowski, W., George, D., O’Sullivan, D., Paull, C., Partridge, I., and Saal, R. (1997). Building Knowledge and Skills to use Seasonal Climate Forecasts in Property Management Planning. Paper presented at International Symposium on Applications of Seasonal Climate Forecasting in Agriculture and Natural Ecosystems - the Australian Experience. Brisbane 10-13 November, 1997. In G.L. Hammer, N.Nicholls and C.Mitchell. (eds.) (2000) Applications of Seasonal Climate Forecasting in Agricultural and Natural Ecosystems – the Australian Experience. Kluwer Academic. The Netherlands Clewett, J.F., Thompson, P.J.M., George, D.A., Owens D.T., and Clarkson. N.M. (2000). Seasonal streamflow forecasts to improve management of water resources: 4. Communicating results to improve knowledge and skills of clients in Australia. Edited paper presented at the Proceedings of the 26th National and 3rd International Hydrology and Water Resources Symposium of The Institution of Engineers, Australia. 20-23 November 2000. Sheraton Perth Hotel, Perth, Australia. Collins, B. (1996). Opening address. Managing with Climate Variability Conference. Occasional Paper CV03/96. LWRRDC and RIRDC, Canberra. Colmar Brunton. (1999 a). Quantitative Research, Research to Evaluate the Managing for Climate Workshops, August. Colmar Brunton. (1999 b). Attachment Report, Research to Evaluate the Managing for Climate Workshops, August. Conroy, G. and Clewett, J. F. (1989). Riding the Southern Oscillation See-Saw. Queensland Country Life. Crichton, J., Marvi, H., Tupper, G. and McGufficke, A. (1999). A survey of the assessment of seasonal conditions in pastoral Australia - benchmarking in the Aussie GRASS project, Part 2: New South Wales Report, Queensland Department of Primary Industries, November. Dart, J., Petheram, R.J. and Straw, W. (1998). Review of Evaluation in Agricultural Extension. Rural Industries Research and Development Corporation, Barton, ACT. Day, K.A., and Paull, C.J. (2001). Development and evaluation of reports on seasonal conditions in Queensland, Department of Primary Industries (Qld), Project Series QO01006, February, pp 1-33. Drummond, M.F, Stoddart, G.L and Torrance, G.W. (1987). Methods for the economic evaluation of health care programmes, Oxford University Press, New York. Dyer, R., McMahon, K. and Werth, J. (1999). A survey of the assessment of seasonal conditions in pastoral Australia - benchmarking in the Aussie GRASS project, Part 4: Northern Territory Report, Queensland Department of Primary Industries, November. Fink, A. (1995). How to Report on Surveys, Sage Publications, California. George, D., Buckley, D., and Carberry, P. (1998). A Summary of Evaluations from participant surveys following workshops and information sessions (on the topic of “Agriculture – Coping in a variable Climate” Paper presented at the 12th Australia New Zealand Climate Forum. November 30th –December 2nd, Kingswood College, University of Western Australia, Perth George, D.A., and Brouwer, D. (1999a). Tutorials. In Clewett, J,F., Smith, P.G., Partridge, I.J., George, D.A. and Peacock, A. (1999). Australian Rainman Version 3: An integrated software package of Rainfall Information for Better Management. QDPI..
(22) George, D., Cobon, D., and Bayley, D. (1999b). Developing Climate Education and Agriculture in Australia: Australian “Rainman”, “DroughtPlan”, and other educational resources. Paper presented at the 5th International Conference on School and popular Meteorological and Oceanographic Education. The conference title - Education: Weather, Ocean, Climate Conference. 5th –9th July, 1999. Ballarat and Melbourne, Australia. George, D.A., Clewett, J.F., McBride, J.L., Balasubramanian,T.N., Huda, A.K.S., Geethalakshmi, V., Selvaraju, R., and Mavi. H. (2000). Seasonal Climate and Weather Forecasting: Agricultural Applications. Invited paper to the International Conference on: Managing Natural Resources for Sustainable Agricultural Production in the 21st Century. New Delhi 14th - 18th February 2000. Indian Centre for Agricultural Research (ICAR). Keogh, D.U. (1999). A report on evaluation of the training course Applications of Climate Forecasts to Agriculture sponsored by the International Research Institute for Climate Prediction held in Australia 1-19 February, 1999, Department of Natural Resources, Coorparoo, November. Keogh, D.U., Abawi, G.Y., Dutta, S.C., Crane, A.J., Ritchie, J.W., Harris, T.R. and Wright, C.G. (2000 a). Climate knowledge, information needs and practices of irrigators in the northern Murray-Darling Basin: a context evaluation. Synopsis of Results. Department of Natural Resources, Coorparoo, Queensland. Keogh, D.U., Abawi, G.Y., Dutta, S.C., Crane, A.J., Ritchie, J.W., Harris, T.R. and Wright, C.G. (2000 b). Can evaluation of irrigator practice, climate knowledge, and information needs lead to development of better decision support tools?: a case study in the MurrayDarling Basin. Proceedings of the 3rd International Hydrology and Water Resources Symposium, HYDRO 2000, The Institution of Engineers, Australia. Perth, November 2000, Volume 2: 991-996. Keogh, D.U. (2001). A report on evaluation of the impact of the international training course “Applications of Climate Forecasts to Agriculture” sponsored by the International Research Institute for Climate Prediction held in Australia 1-19 February 1999, Department of Natural Resources and Mines, Coorparoo, Queensland, April. Keogh, D.U., Abawi, G.Y., Dutta, S.C., Crane, A.J., Ritchie, J.W., Harris, T.R. and Wright, C.G. (2002 a). Can evaluation help researchers develop better decision tools and information to aid water management?: A case study of irrigator needs, practices, and climate knowledge in the Murray-Darling Basin. Australian Journal of Experimental Agriculture (in press). Keogh, D.U., Bell, K.L., Park, J.N. and Cobon, D.H. (2002 b). Formative evaluation of climate-based decision support information for graziers in western Queensland. Australian Journal of Experimental Agriculture (in press). Krueger, R.A. and Morgan, D.L. (1998), The Focus Group Kit, Sage Publications, California. Lubulwa, G. (1996) An economic evaluation of the impact of ACIAR-funded agricultural research based in Africa. Poster paper to the Annual Conference of the Australian Agricultural and Resource Economics Society, Melbourne, February. Luukkonen-Gronow, T. (1987). Scientific research evaluation: a review of methods and various contexts of their application, R & D Management, Vol. 17, No. 3, July, 207-221. Madaus, G.F., Scriven, M.S. and Stufflebeam, D.L. (1983). Evaluation models, viewpoints on educational and human services evaluation. Kluwer-Nijhoff Publishing, Boston..
(23) McBride, J.L. and Nicholls, N. (1983). Seasonal relationship between Australian rainfall and the Southern Oscillation. Monthly Weather Review. 111, 1198-2004 McDonald, B., Winston, J., Boomsma, J., (1998), Principles for the design and implementation of Evaluation Target 10, Evaluation News & Comment, Vol 7, No 1, June 1998, Australasian Evaluation Society Moloney, K.C., Bartholomew, K.Y. and Morris, B.L. (2000). Will it Rain Man? A Market Research Strategy Report on the Queensland Centre for Climate Application’s Computer Package Australian Rainman’. Thesis, Faculty of Business, University of Southern Queensland, 300 pp. Patton, M.Q. (1982). Practical Evaluation, Sage Publications, California. Patton, M.Q. (1987). Creative Evaluation, Sage Publications, California. Paull, C. J. and Hall, W. 1999, A survey of the assessment of seasonal conditions in pastoral Australia - benchmarking in the Aussie GRASS project, Part 1: Queensland Report, Queensland Department of Primary Industries, November. Paull, C. J. and Hall, W. (2000). A survey of the assessment of seasonal conditions in pastoral Australia - benchmarking in the Aussie GRASS project, Part 6: National Summary, Queensland Department of Primary Industries, May. Posavac E.J. and Carey R.G. (1997). Program Evaluation Methods and Case Studies, 5th edn., Prentice Hall, New Jersey. Robertson, G. and White, B. (1996). Introduction. Managing with Climate Variability Conference. Occasional Paper CV03/96. LWRRDC and RIRDC, Canberra. Rural Extension Centre. (1999). QM727/REC 68 Evaluation 8-12 March 1999 Toowoomba, University of Queensland, Gatton, Queensland. Roche, J. and Watson, I. (1999). A survey of the assessment of seasonal conditions in pastoral Australia - benchmarking in the Aussie GRASS project, Part 5: Western Australia Report, Queensland Department of Primary Industries, November. Sanders, J.R. (1994). The Program Evaluation Standards: How to Assess Evaluations of Educational Programs, 2nd Edition. Sage Publications, Thousand Oaks. Scriven, M. (1975). Evaluation Bias and Its Control, Paper 4, Occasional Paper Series, University of California, Berkeley. Spencer, L.J. (1989). Winning through participation. Kendall/Hunt Publishing Co. Iowa. Truscott, M.A., Egan, J.P. and Mayfield, A.H. (2000). Climate Risk Management in low rainfall cropping districts of South Australia: 2000 decision support trials, South Australian Research and Development Institute, Adelaide, December. Turban, E. (1995). Decision Support and Expert Systems - Management Support Systems, 4th Edition., Prentice-Hall, Inc., Englewood Cliffs. Tynan, R. (1999). A survey of the assessment of seasonal conditions in pastoral Australia - benchmarking in the Aussie GRASS project, Part 3: South Australia Report, Queensland Department of Primary Industries, November..
(24) White, B. (2000). The importance of climate variability and seasonal forecasting to the Australian economy. In G.L. Hammer, N.Nicholls and C.Mitchell. (eds.) (2000) Applications of Seasonal Climate Forecasting in Agricultural and Natural Ecosystems – the Australian Experience. Kluwer Academic. The Netherlands Wissemann, A. (1992). Three Concepts in Extension Evaluation, Research and Extension Unit, Department of Primary Industries, Brisbane Wissemann, A. (1994). A Compilation of Information on Evaluation Methods, Research and Extension Unit, Department of Primary Industries, Brisbane Woodhill, J. and Robins, L. (1998). Participatory evaluation for Landcare and Catchment Groups: A Guide for Facilitators, Greening Australia Limited, Yarralumla. Worthen, B.R., Sanders, J.R. and Fitzpatrick, J.L. (1997). Program Evaluation: Alternative Approaches and Practical Guidelines, Longman, New York. Worthen, B. R. (1999). Critical challenges that confront the evaluation enterprise, Evaluation Journal of Australasia, 11, 2, 16-35..
(25) APPENDIX 1 Example of an evaluation form for applied climate workshops. QCCA EVALUATION SHEET. Participant Sheet Date : Your Postcode: __ __ __ __ What are three words or messages you recall from the session?. What industries are you involved in (more than one box may be ticked) Fisheries Prime Lambs/Wool Beef/ Dairy cattle. Irrigated crops Broadacre field crops Vegetable crops. Tree crops Vine crops Other: _________________. For the questions below, please circle the score that best describes your assessment and provide comments if you desire where-: 1= Strongly Disagree. 2 = Disagree. 3 = Not sure. The material was clearly presented:. 4 = Agree. 5 = Strongly Agree. 1. 2. 3. 4. 5. 1. 2. 3. 4. 5. How could material presentation be improved?: The session was relevant to me: How could session relevance be improved?: The session was useful to me:. _________________________________________ 1. 2. 3. 4. 5. How could session usefulness be improved?: The session met my needs:. 1. 2. 3. 4. 5. How could the session be improved? Would you recommend this session to a friend or colleague? (circle). Yes. No. Page 1 of 2, please turn over…..
(26) The workshop outcomes are listed below. In your view, did the workshop achieve the following (please circle the appropriate score):. Not very well achieved. Workshop Outcomes. Very well achieved. Achieved. By attending this session, I will be better able to:1. access and interpret climate data. 1. 2. 3. 4. 5. 2. examine and explain the seasonal climate forecast. 1. 2. 3. 4. 5. 3. give examples of how rainfall data could be used for better management of agriculture and resources. 1. 2. 3. 4. 5. 4. apply rainfall data to help solve agriculture and resource management problems. 1. 2. 3. 4. 5. What do you intend to do as a result of this session?. Are there any other comments or suggestions you wish to make about the session?. Your name: Your Address:. Age group (please circle one). Gender (please circle). 16-25. 26-35. Male. 36-45. 46-55. 56-65. 66+. Female. May we use any of these comments for promotion of QCCA sessions? (please circle) Yes / No Thank you for your participation, feedback and comments.. Please return this evaluation sheet to: D. George, QCCA, PO Box 102, Toowoomba, ,Qld 4350 Australia. Or e-mail to [email protected] . Thank you..
(27)
Figure

Related documents
