Title:
Dipeptidyl peptidase-4 inhibitors Mitigates Glycemic Variability in
Metformin based Multiple Daily injected Type 2 Diabetes, a Prospective
Randomized Controlled Trial
Fukumi Yoshikawa
1), ‡, Hiroshi Uchino
1),*, Tomoko Nagashima
1), ‡, Shuki Usui
1)
, Masahiko Miyagi
1), Yasuyo Ando
1)Naoki Kumashiro
1)and Takahisa Hirose
1)
1) Division of Diabetes, Metabolism and Endocrinology, Department of Internal
Medicine, Toho University Graduate School of Medicine, Tokyo, Japan
‡
These authors contributed equally to this work.
Running title:
Metformin/DPP-4 Inhibitor ameliorates GV
*Corresponding author:
Hiroshi Uchino MD PhD
Division of Diabetes, Metabolism and Endocrinology
Department of Internal Medicine
Toho University Graduate School of Medicine
6-11-1 Omori-nishi, Ota-ku
Tokyo, 143-8541 Japan
Phone: +81-3-3762-4151
Fax: +81-3-3765-6488
Email: [email protected]
Acknowledgements:
The authors are especially grateful to the VMAT investigators.
Conflicts of interest
Masahiko Miyagi, Hiroshi Uchino declare that they have no conflict of interest.
Naoki Kumashiro has received research support from, Biomedicalnet,
Tanabe-Mitsubishi, and Welby, and speaker honoraria from Astellas, Eli Lilly,
Novo Nordisk, Sanofi, Tanabe-Mitsubishi, and Takeda. Takahisa Hirose has
received advisory panel from Eli Lilly, Novo Nordisk, and Sanofi; research
support from Astellas, AstraZeneca, Boehringer Ingelheim, Daiichi-Sankyo,
Dainippon-Sumitomo, Eli Lilly, Merck (MSD), Novo Nordisk, Ono, Sanofi,
Takeda, and Tanabe-Mitsubishi; and speaker honoraria from AstraZeneca,
Boehringer Ingelheim, Daiichi-Sankyo, Eli Lilly, Merck (MSD), Novo Nordisk,
Abstract
To cope the high glycemic variability (GV) is crucial in the management of multiple daily
insulin (MDI) in diabetes. We compared the effect of low dose metformin 750mg/d adding
vildagliptin 100mg/d (DPP4+LMET) or the high dose metformin 1500mg/d (HMET), in
type 2 diabetes (T2D) with MDI, evaluating GV by continuous glucose monitoring (CGM).
Single center, open-label, 12 weeks - 2 period crossover design. Twenty T2D with
inadequately controlled (7.0% <HbA1c ≦9.0%) with MDI + LMET were enrolled.
Primary endpoints were GV and hypoglycemia derived from CGM performed after each
12 weeks treatment periods. There was no significant difference in HbA1c, body weight
changes, total daily dose of insulin. DPP4+LMET compared to the HMET, significantly
reduced the calculated GV value, mean (7.15±1.3 vs 7.82±1.6, p<0.05), standard
deviation (1.78±0.55 vs 2.27±1.11, p=0.03), continuous overlapping net glycemic action
(6.44±1.28 vs 7.12±1.69, p<0.05), J-Index (26.7±11.0 vs 34.9±19.8, p<0.05), high blood
glucose index (3.01±1.96 vs. 6.73±4.85, p=0.02), and mean amplitude of glycemic
excursions (4.53±1.35 vs 5.50±2.34, p=0.03). The GV metrics with hypoglycemia and
nocturnal hypoglycemia were not significantly different.
DPP4+LMET decreased GV associated with hyperglycemia. Adding DPP4 inhibitor to
Key Words: glycemic variability, continuous glucose monitoring, dipeptidyl Peptidase-4
Introduction
Multiple daily injection of insulin is the last resort in the context of the diabetes treatment
strategy, both in type 1 and 2 diabetes. However, several criticism has been emerged as,
increasing body weight, high glycemic variability and consequently hypoglycemia. In the
current consensus guidelines stated in American Diabetes Association (1 ) and the
European Association for the Study of Diabetes (2) recommends that continuing
metformin might be an alternative option when insulin is initiated to minimize risk of
increased body weight and insulin dosages. Several previous study of randomized
clinical trials with meta-analyses and trial sequential analyses has been shown that
combination therapy of insulin and metformin were associated with a significant reduction
in HbA1c, weight gain, and insulin dose, all-cause mortality, compared to insulin alone
(3, 4).
There is considerable clinical implication that supports the negative impact on GV in the
development of diabetes complications. Recent publications from“Beyond A1c Writing
Group” (5) warranted that HbA1c has limited accuracy to elucidate the pattern of
glycemic excursions following vulnerability of the individual subjects. According to the
members of decision-making for the “Type 1 Diabetes Outcomes Program”, has been
beyond HbA1c (6). In recent years, GV has been proposed as an additional risk factor
for complications of diabetes independent of hyperglycemia (7). Thus, lowering
glycemic variability is quite important as well as reduced HbA1c in the management of
diabetes. However, there was no evidence of lowering glucose variability by adding
metformin on multiple daily insulin therapy.
Beside chronically elevated glucose, high glycemic variability is associated with
increased frequency of nocturnal hypoglycemia and consequently to hypoglycemic
unawareness (8). There is still extensive debate regarding hypoglycemia as a predictive
risk factor for diabetes macrovascular and cardiovascular complications. In the face of
growing interest in this various synonyms, some studies have reported a connection
between hypoglycemia and not only cardiovascular diabetes complications (9) but also
all-cause mortality despite of glycemic treatment group assignment (10). Although the
potential for a causal relationship has been demonstrated in clinical studies treated with
oral hypoglycemic agents, the evidence from multiple daily insulin injection studies that
hypoglycemia is a major causal contributor to cardiovascular events is limited to date.
We focus on the time range (i.e., nocturnal) and CGM based GV metrics specific to
employed to which adding incretin drugs or metformin.
DPP-4 inhibitors act by enhancing the actions of incretin, which promotes insulin
secretion and suppresses glucagon secretion depending on blood glucose levels (11),
results in improvement of glycemic control without hypoglycemia (12).Oral antidiabetics
studies, which, suggested that the incretin system modulate daily glucose profiles and
variability and might be an option in adjunctive treatment to metformin causing glycemic
control without inducing weight gain and hypoglycemia (13). Insofar, there was no study
comparing GV and the rate of hypoglycemia assessed with CGM in subject using
metformin monotherapy compared to metformin plus DPP-4 inhibitors, in addition to
multiple daily insulin injection type 2 diabetes. Thus, we wish to evaluate the GV, in terms
of multiple CGM parameters, such as standard deviation (SD), mean amplitude of
glucose excursion (MAGE), and continuous overall net glycemic action (CONGA) in
Materials and methods
Subject
Patients were enrolled and randomized between Feb, 2017, and Mar, 2018, given
explanations of this study protocol, and provided informed consent. The study protocol
was approved by Toho University in Tokyo, Japan. The National Clinical Trial registration
in Japan, number is JPRN-UMIN000024663 at 1/11/2016. All the subjects finished the
study until 1/Jul/2018.
Included patients were 20 to 80 years old, diagnosed type 2 diabetes mellitus using
insulin for at least 1 year, and were controlled 7.0% <HbA1c ≦9.0%. Patients were
treated with basal and bolus insulin therapy and metformin 750 mg/d without any other
antidiabetic drugs for 12 weeks before entry (run in period). During that period and until
finished this study, basal and bolus insulin adjusting algorithms, and antidiabetic drugs,
antihypertensive drugs, hypocholesterol drugs, were not changed, by the cause of the
judgment of the physician.
The key exclusions criteria included history of type 1 diabetes or secondary forms of
diabetes, ketoacidosis, coma, myocardial infarction, unstable angina or stroke in the past
renal dysfunction (serum creatinine level ≧2mg/dl) , severe hepatic dysfunction (serum
alanine transaminase or aspartate transaminase≧ 100IU/L), treatment with antidiabetic
agents other than metformin, history of hypersensitivity to any of the ingredients of the
study drugs, and judged to be unsuitable for participation for medical reasons. A
complete study design and included and excluded number were available in the
appendix 1 and 2.
Study design
We conducted this investigator-initiated, single-center, randomized, open-label,
exploratory pilot study with 12weeks - 2 period cross over design. Consisting of a
screening period (-12 to 0 week). We will apply analysis of variance (ANOVA): repeated
measures, within-between interaction, setting an alpha level of 0.05, and approximately
10 participants will provide 89% power to detect a statistical significance. Recruitment
was increased (n=15 in each arms) for both arms and inflated to 30 to counter 66%
attrition rate. Of the 30 patients screened, 10 did not meet the inclusion criteria 20
participate in the trial. Then 20 eligible patients were randomly assigned to HMET (n =
8) or DPP4/LMET (n = 12). The subjects were informed that participation was voluntary,
DPP4/LMET at any time and still get the monetary compensation. The randomization
was conducted independently at a central office using a computer-generated random
allocation sequence table. Allocation concealment was performed by enclosing
assignments in sequentially numbered, opaque, closed envelopes. At first period, 0-12
weeks, patients were randomly allocated to two groups, HMET group which increased
metformin to 1500 mg/d or DPP4+LMET group add vildagliptin 100 mg/d to current
treatment. After 12 weeks treatment, at the second period, 13-24 weeks, HMET group
ordered to receive vildagliptin 100 mg/d and metformin 750 mg/d and DPP4+LMET group
changed to receive metformin 1500mg/d.
Continuous glucose monitoring (CGM) examination, we used Medtronic diabetes CGMs
iPro2 (Medtronic, Northridge, CA, USA), performed on 5 consecutive days on after each
12 weeks treatment period. Registered data from CGMs Digital recorder and the blood
glucose meter were downloaded using CARELINK PRO software (Medtronic, Northridge,
CA, USA).
Measurements
Patients were checked body weight , abdominal circumference, blood pressure, on 0, 12
hours or more on 12 and 24 weeks, measurements were HbA1c, glycated albumin (GA),
fasting plasma glucose (FBG), triglyceride (TG), HDL cholesterol, LDL cholesterol,
plasma C-peptide immunoreactivity (CPR), urinary albumin (U-Alb) and urinary
creatinine (U-Cr).
Glycemic indices based on CGM
After downloading the CGM data, the following values (14) were analyzed using a
computer program, Easy GV © (available free for non-commercial use at
WWW.easygv.co.uk). The Easy GV © is used to calculate the following measures of
glycemic variability;
Metrics of Glycemic variability were as follows;
Standard Deviation (SD):
Represents as a grade of dispersion from average.
Average Glucose Value (Mean)
Continuous overlapping net glycemic action (CONGA):
Represents as the difference between values at different set intervals (the default is 60
Lability Index (LI):
Represents as lability values during past 4weeks.
J-Index:
It indicates glucose variability calculated with Mean GV and SD.
Low BG Index (LBGI) / High BG Index (HBGI):
Represents as a measure of the frequency and extent of the low and high blood glucose.
Glycemic risk assessment diabetes equation (GRADE):
Represents as the risk attributable to hypoglycemia and hyperglycemia.
Mean of daily differences (MODD):
It indicates amount of the difference between values on different days but at the same
time.
Mean amplitude of glycemic excursions (MAGE):
It quantifies the glycemic peaks and nadirs encountered during a day.
Average daily risk range (ADDR):
The process of calculated is analogous to the LBGI/HBGI calculation. It contributes to
the risk of hypoglycemia and hyperglycemia to the transformed point.
M-Value:
Mean absolute glucose (MAG):
It calculates the sum of the differences between successive glucose values divided by
the total time measured in hours.
In addition to using CGM data, we calculated hypoglycemia as area over the curve (AOC)
of glucose < 70 mg/dL during the night (0:00am~6:00am).
Statistical analysis
The research sample was randomly selected from the patients from out-patient clinic of
volunteers who met the criteria for inclusion in the group. The trial had 90% power at a
two-sided alpha level of 0.05 to detect hazard ratios consistent with an expected GV
metrics difference between two groups of 20%, and the GV parameters regarding
hypoglycemia with 20%, respectively. Data are shown as the mean ± standard deviation.
The paired t-test was used to compare values between patients taking different drugs or
Result
A total of the 30 patients were randomized and 20 patients (Male 10, Female 10)
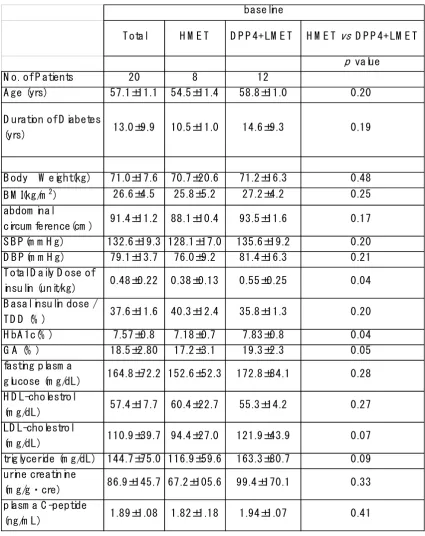
completed. Baseline demographics and clinical characteristics of total and two groups
patients are shown in Table 1, mean age was 57.1 ± 11.1 years and mean duration since
diagnosis was 13.0 ± 9.9 years, body weight was 71.0 ± 17.6 kg, mean body mass index
(BMI) was 26.6 ± 4.5 kg/m2, mean HbA1c was 7.57 ± 0.8 %. Before enrollment in this
study, total daily dose of insulin (TDD) was 0.48 ± 0.22 U/kg, basal insulin percentage
of TDD (%Basal) was 37.6 ± 11.6% . The HbA1c level and TDD of insulin was
significantly higher at DPP4+LMET group. All other parameters were not different,
between two groups.
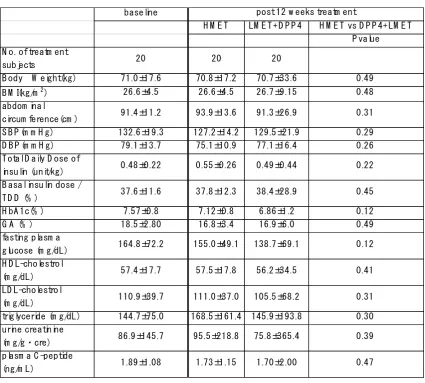
After 12 weeks treatment,the difference between two groups (we analyzed as HMET
treated group, N=20, and DPP4+LMET treated group, N=20) were shown in Table 2 .
There were no differences in physical findings and TDD, basal insulin percentage of TDD,
blood and urine parameter between two groups.
Physical findings
As a result, baseline BW, BMI and other anthropometrics were comparable with both
HMET 25.8 ±4.5 kg/m2; p=0.48, LMET+DPP4 27.2±4.2 kg/m2; p=0.25). Regardless of
treatment assignment, BW, BMI, abdominal circumference and blood pressures were
also comparable in both 12-weeks treatment period.
Insulin Dose
Total daily dose of insulin (TDD) (U/Kg) was not different between baseline and post-12
weeks treatment within both groups (HMET 0.55±0.26; p=0.14, DPP4+LMET 0.49±0.22;
p=0.48). Furthermore, basal / bolus ratio and basal insulin percentage of TDD were
similar between Pre- and Post-treatment in both groups (%Basal: HMET 37.8±14.8;
p=0.44, DPP4+LMET 38.4 ±14.4; p=0.41).
Glycemic control
The HbA1c level was significantly decreased in both groups compared to the
pre-treatment (HMET, 7.57±0.80 to 7.12±0.76; p=0.01, DPP4+LMET, 7.57±0.80 to
6.86±0.62; p<0.01), and were not different between two groups at post 12 weeks
treatment period (p=0.12). Fasting plasma glucose were similar in both groups at the
baseline (HMET 155.0±49.1 mg/dl vs. DPP4+LMET 138.7±34.6 mg/dl; p=0.12), and
Glucose variability and hypoglycemia by CGM data
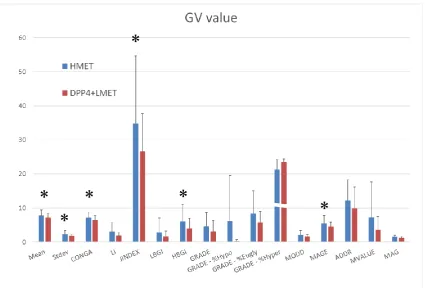
Glucose fluctuation parameters provided from CGM data are shown in Figure 1.
Mean GV (mmol/L) was significantly different between HMET and DPP4+LMET
(7.82±1.60 vs. 7.15±1.30; p=0.04). And, between two groups, DPP4+LMET was
significantly reduced parameters relatively with glycemic variability, SD (2.27±1.11 vs.
1.78±0.55; p=0.03), CONGA (7.12±1.69 vs. 6.44±1.28; p=0.046), J-Index (34.9±19.8 vs.
26.7±11.0; p=0.04), MAGE (5.50±2.34 vs. 4.53±1.35; p=0.03). Moreover, it revealed that
HBGI represents high blood glucose, which the risk of hyperglycemia was significantly
different between two groups (5.50±2.34 vs. 4.53±1.35; p=0.03).
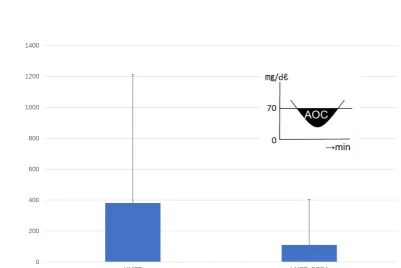
The AOC of glucose < 70 mg/dL at midnight (AOC/night) shown in Figure 2 were more
likely to report the risk of hypoglycemia consequently to reduce the QOL and overall
survival in diabetes with patient with insulin therapy. It tended to be higher in HMET group,
in this context, there was not significantly difference between two groups (381.0±830.4
vs. 109.9±293.5; p=0.08). Including the consecutive and protracted hypoglycemia, low
BG Index (LBGI), glycemic risk assessment diabetes equation (GRADE) - %Hypo and
average daily risk range (ADDR) has implicated as the magnitude of hypoglycemia.
Discussion
We evaluate two additional oral antidiabetic strategy with MDI, low dose metformin with
DPP4 inhibitor and high dose metformin alone in forced insulin titration algorism, with
dynamics of GV amplitude and compared ability to avoid hypoglycemia and labile GV
metrics. Our data demonstrated that a DPP4 inhibitor, add-on to the low dose metformin
with MDI therapy compared to the HMET, allowed us to significantly reduce mean GV,
standard deviation of GV, continuous overlapping net glycemic action, J-Index, high
blood glucose index, and mean amplitude of glycemic excursions, irrelevant to total daily
insulin dose and A1c. These parameters were mainly representative of the GV amplitude
in high glucose components.
Glycemic variability in the treatment with metformin and DPP4-inhibitor
Management of glucose profile, prevention of hyperglycemic exposure and a risk of
hypoglycemia are highly related to GV which had been greatest interest and crucial role
of both in the physiology and pathophysiology of diabetes (15). Subsequent studies
focused on the variability of blood glucose fluctuations as an independent risk factor for
complications of type 2 diabetes (16) and also to the brain cognitive function and quality
characterized to improve A1c and fasting blood glucose, the GV has not been studied
precisely.
DDP-4 inhibitors increase circulating levels of the bioactive, intact glucagon-like
peptide-1 (GLP-peptide-1) and glucose-dependent insulinotropic polypeptide (GIP) by inhibition of the
GLP-1/GIP degrading DDP-4, and therefore improving pancreatic 𝛼- and 𝛽-cell
sensitivity to glucose, leading to suppress glucagon release as a consequence to reduce
GV (18). DDP-4 inhibitors thus complement to the effect of metformin that decreases
hepatic glucose production without improving insulin secretion (19). Insofar as using
DPP4 inhibitor to obese glucose tolerant, glycemic variability showed no significant
differences in the AUC, MAGE, SD of glucose, CV of glucose, and MBG compared to
the placebo (20). To assess the effects of adding DPP4 inhibitor compared to high dose
metformin, excessively advanced stage in type 2 diabetes require MDI, evaluate the
impact of emergent adverse events in MDI. Our study shows treatment with DPP4+
LMET places a high value on preventing the potential consequences of hyperglycemia
and a similar value on the possible side effects of hypoglycemia compared to the HMET.
Avoiding hypoglycemia
accompanied by decreased risk of micro- and macrovascular complications (21), the risk
of hypoglycemia increases with forced strengthen the treatment. In insulin treated type
2 diabetes with cardiovascular disease, hypoglycemic events with a continuous glucose
monitoring glucose concentration <56 mg/dL (3.1 mmol/L) were associated with a
30-fold increased frequency of 24h-Holter electrocardiogram detected of ventricular
tachycardia (22). Underlying this process hypoglycemia has been implicated as the
primary barrier to tighten blood glucose (23). To address these criticisms, we compared
the risk of hypoglycemia between DPP4+LMET and HMET with CGM derived GV metrics
specific to the low glucose value: LBGI, GRADE-%Hypo and ADRR. Despite having
favorable result in the range of hyperglycemia with DPP4+LMET group, there was no
significant difference in neither hypoglycemic parameters between two groups. These
results indicates that the rate and time points in hypoglycemia during the MDI in T2D
with several oral agents, irrelevant to the oral drug properties. Although several studies
have reported that low GV associated with decreased the rate of hypoglycemia (24),
lower GV accompanied with reduced higher blood glucose component were not vast
majority of hypoglycemia. To combat the life-threating hypoglycemia in MDI using several
Metabolic effects
Metformin is a cost effective insulin-sparing oral glucose-lowering agent, and was
positively recognized as an adjunctive drugs to insulin therapy (25). In most of the Asian
countries, lower BMI compared to the North American and European counties, the dose
of metformin adjunct to the insulin therapy was lower with basal dose of ~750 mg/day
versus 1 to 1.5 g/day (26, 27). In a long-term study on the effect of DPP4 inhibitor
(sitagliptin) as add-on to metformin in subjects with inadequate glycemic control without
insulin treatment, sitagliptin (100 mg once daily) was added to metformin alone (>1.5 g
daily) for 24 weeks showed significant reduction in A1C, fasting plasma glucose, and 2-h
postmeal glucose (28).
Insofar as increasing the dose of metformin in HMET, body weight, body mass index,
abdominal circumference, TDD, basal insulin percentage of TDD, A1c, GA, fasting
plasma glucose and lipid parameter were not different compared to LMET-DPP4 group.
Underlying this cross-over study, targeting to evaluate the metabolic difference between
two groups, might not feasible to compare the effect in 12 weeks study period. Although
there was no difference in TDD at the end of 12 weeks study period, between HMET
group and LMET+DPP4 group accompanied by marginally higher TDD at the baseline
potentials to reduce the TDD with adding the DPP4 inhibitor compared to increase the
dose of metformin.
Treatment adverse events
The risk of other severe and non-severe adverse events were not significantly different
between DPP4+LMET and HMET groups during the study periods. Increased the dose
of metformin has been shown to elevate the rate of gastrointestinal disturbances (29, 30).
We therefore attempt the study to include participant already taking low dose metformin
750mg/day to minimize the adverse effect of having increased metformin in the period
of the higher dose 1500mg/day in Japan (31).
Limitation
The weakness of our results were, first, duration of intervention in the trial was relatively
short, and we were unable to explore whether these metabolic effects disappear, persist,
or became more pronounced with time. Secondary, analyses of patient relevant
outcomes were based on very sparse data and the possibility of insufficient significant
results. Thirds, although in patients with type 2 diabetes on multiple daily injection, our
compared to the combination of high dose metformin on metrics in glycemic variability,
standard deviation, J-Index, MAGE, HBGI, these variables are, at best, invalidated
surrogate markers of a potentially reduced risk of microvascular and macrovascular
complications (32, 33).
Conclusion
Addition to multiple insulin injection, DPP4 inhibitor with low dose metformin compared
to substantial high dose metformin monotherapy, decreased glycemic variability
especially in hyperglycemic excursion in type 2 diabetes.
Acknowledgments
No funding support for this study. All authors made significant contributions to study
design, analysis, and interpretation of data, as well as preparing and reviewing the
manuscript.
Previous presentation
Some of the findings from this study were presented at the 77th Scientific Sessions of
Funding
No funding or sponsorship was received for this study. The article processing charges
were funded by the authors.
Authorship
All named authors meet the International Committee of Medical Journal Editors (ICMJE)
criteria for authorship, take responsibility for the integrity of the work as a whole, and
have given their approval for this version to be published.
Disclosures
The authors have no other relevant affiliations or financial involvement with any
organizations or entities with a financial interest in or financial conflict with the subject or
materials discussed in the manuscript apart from those disclosed.
Takahisa Hirose has is on an advisory panel from Eli Lilly, Novo Nordisk, and Sanofi;
research support from Astellas, AstraZeneca, Boehringer Ingelheim, Daiichi-Sankyo,
Dainippon-Sumitomo, Eli Lilly, Kissei, Merck (MSD), Novo Nordisk, Ono, Sanofi, Takeda,
Daiichi-Sankyo, Eli Lilly, Kissei, Merck (MSD), Novo Nordisk, Ono, Sanofi, Takeda, and
Tanabe-Mitsubishi.
Compliance with Ethics Guidelines
All procedures performed in studies involving human participants were in accordance
with the ethical standards of the Ethics Committee of the Toho University Omori Medical
Center Hospital and with the 1964 Helsinki Declaration and its later amendments.
Informed consent was obtained from all individual participants included in the study.
Data Availability
The datasets generated during and/or analyzed during the current study are available in
the University Hospital Medical Information Network-Clinical Trials Registry (UMIN-CTR),
number UMIN000024663.
Contribution Statement
The authors contributed to the present work as follows: FY, HU, TN, and TH contributed
to data curation, formal analysis and methodology, SU and MM to the acquisition of data
drafted the original and revised manuscripts and all authors approved the final approval
References
1) Lifestyle Management: Standards of Medical Care in Diabetes-2018. American
Diabetes Association. Diabetes Care. 2018 Jan; 41(Suppl 1):S38-S50.
2) Khunti K, Ceriello A, Cos X, De Block C. Achievement of guideline targets for
blood pressure, lipid, and glycaemic control in type 2 diabetes: A meta-analysis.
Diabetes Res Clin Pract. 2018 Mar;137:137-148.
3) Vos RC, van Avendonk MJ, Jansen H, Goudswaard AN, van den Donk M,
Gorter K, Kerssen A, Rutten GE. Insulin monotherapy compared with the addition of
oral glucose-lowering agents to insulin for people with type 2 diabetes already on
insulin therapy and inadequate glycaemic control. Cochrane Database Syst Rev. 2016
Sep 18;9:CD006992.
4) Zhang Y, Zhao Z, Wang S, Zhu W, Jiang Y, Sun S, Chen C, Wang K, Mu L,
Cao J, Zhou Y, Gu W, Hong J, Wang W, Ning G. Intensive insulin therapy combined
with metformin is associated with reduction in both glucose variability and nocturnal
hypoglycaemia in patients with type 2 diabetes. Diabetes Metab Res Rev. 2017
Oct;33(7).
5) Beyond A1C Writing Group. Need for Regulatory Change to Incorporate
10.2337/dci18-0010.
6) Agiostratidou G, Anhalt H, Ball D, et al. Standardizing Clinically Meaningful
Outcome Measures Beyond HbA1c for Type 1 Diabetes: A Consensus Report of the
American Association of Clinical Endocrinologists, the American Association of
Diabetes Educators, the American Diabetes Association, the Endocrine Society, JDRF
International, The Leona M. and Harry B. Helmsley Charitable Trust, the Pediatric
Endocrine Society, and the T1D Exchange. Diabetes Care. 2017
Dec;40(12):1622-1630. doi: 10.2337/dc17-1624.
7) Lee S, Lee H, Kim Y, Kim E. Effect of DPP-IV Inhibitors on Glycemic Variability
in Patients with T2DM: A Systematic Review and Meta-Analysis. Sci Rep. 2019 Sep
16;9(1):13296.
8) Gehlaut RR, Dogbey GY, Schwartz FL, Marling CR, Shubrook JH.
Hypoglycemia in Type 2 Diabetes--More Common Than You Think: A Continuous
Glucose Monitoring Study. J Diabetes Sci Technol. 2015 Apr 27;9(5):999-1005.
9) Bedenis R, Price AH, Robertson CM, et al. Association between severe
hypoglycemia, adverse macrovascular events, and inflammation in the Edinburgh Type
2 Diabetes Study. Diabetes Care. 2014 Dec;37(12):3301-8. doi: 10.2337/dc14-0908.
on Cardiovascular Outcomes and Death in the Veterans Affairs Diabetes Trial.
Diabetes Care. 2019 Jan;42(1):157-163. doi: 10.2337/dc18-1144.
11) Bock G, Dalla Man C, Micheletto F, Basu R, Giesler PD, Laugen J, Deacon
CF,
Holst JJ, Toffolo G, Cobelli C, Rizza RA, Vella A. The effect of DPP-4 inhibition with
sitagliptin on incretin secretion and on fasting and postprandial glucose turnover in
subjects with impaired fasting glucose. Clin Endocrinol (Oxf). 2010 Aug;73(2):189-96.
doi: 10.1111/j.1365-2265.2009.03764.x. Epub 2009 Dec 18. PubMed PMID: 20039889;
PubMed Central PMCID: PMC2908732.
12) Campbell JE, Drucker DJ. Islet α cells and glucagon--critical regulators of
energy homeostasis. Nat Rev Endocrinol. 2015 Jun;11(6):329-38.
13) Guerci B, Monnier L, Serusclat P, Petit C, Valensi P, Huet D, Raccah D,
Colette C, Quéré S, Dejager S. Continuous glucose profiles with vildagliptin versus
sitagliptin in add-on to metformin: results from the randomized Optima study. Diabetes
Metab. 2012 Oct;38(4):359-66.
14) Hill NR, Oliver NS, Choudhary P, et al. Normal reference range for mean
tissue glucose and glycemic variability derived from continuous glucose monitoring for
2011;13(9):921-928.
15) Schreiver C, Jacoby U, Watzer B, Thomas A, Haffner D, Fischer DC.
Glycaemic
variability in paediatric patients with type 1 diabetes on continuous subcutaneous
insulin infusion (CSII) or multiple daily injections (MDI): a cross-sectional cohort study.
Clin Endocrinol (Oxf). 2013 Nov;79(5):641-7. doi:10.1111/cen.12093. Epub 2013 Apr
19. PubMed PMID: 23134485.
16) Monnier L, Mas E, Ginet C, Michel F, Villon L, Cristol JP, Colette C. Activation
of oxidative stress by acute glucose fluctuations compared with sustained chronic
hyperglycemia in patients with type 2 diabetes. JAMA. 2006 Apr 12;295(14):1681-7
17) Cox DJ, McCall A, Kovatchev B, Sarwat S, Ilag LL, Tan MH. Effects of blood
glucose rate of changes on perceived mood and cognitive symptoms in insulin-treated
type 2 diabetes. Diabetes Care. 2007 Aug;30(8):2001-2.
18) Wu T, Little TJ, Bound MJ, Borg M, Zhang X, Deacon CF, Horowitz M, Jones
KL, Rayner CK. A Protein Preload Enhances the Glucose-Lowering Efficacy of
Vildagliptin in Type 2 Diabetes. Diabetes Care. 2016 Apr;39(4):511-7
19) Green BD, Irwin N, Duffy NA, Gault VA, O'harte FP, Flatt PR. Inhibition of
glucagon-like peptide-1. Eur J Pharmacol. 2006 Oct 10;547(1-3):192-9
20) González-Heredia T, Hernández-Corona DM, González-Ortiz M,
Martínez-Abundis E. Effect of Linagliptin Versus Metformin on Glycemic Variability in Patients
with Impaired Glucose Tolerance. Diabetes Technol Ther. 2017 Aug;19(8):471-475
21) Diabetes Control and Complications Trial Research Group, Nathan DM,
Genuth S, Lachin J, Cleary P, Crofford O, Davis M, Rand L, Siebert C. The effect of
intensive treatment of diabetes on the development and progression of long-term
complications in insulin-dependent diabetes mellitus. N Engl J Med. 1993 Sep
30;329(14):977-86.
22) Pistrosch F, Ganz X, Bornstein SR, Birkenfeld AL, Henkel E, Hanefeld M. Risk
of and risk factors for hypoglycemia and associated arrhythmias in patients with type 2
diabetes and cardiovascular disease: a cohort study under real-world conditions. Acta
Diabetol. 2015 Oct;52(5):889-95.
23) Cryer PE. Glycemic goals in diabetes: trade-off between glycemic control and
iatrogenic hypoglycemia. Diabetes. 2014 Jul;63(7):2188-95
24) Gómez AM, Henao DC, Imitola Madero A, Taboada LB, Cruz V, Robledo
Gómez MA, Rondón M, Muñoz-Velandia O, García-Jaramillo M, León Vargas FM.
to Identify Patients at Risk of Hypoglycemia. Diabetes Technol Ther. 2019
Aug;21(8):430-439.
25) Cheng Y, Briarava M, Lai M, Wang X, Tu B, Cheng N, Gong J, Yuan Y, Pilati P,
Mocellin S. Pancreaticojejunostomy versus pancreaticogastrostomy reconstruction for
the prevention of postoperative pancreatic fistula following pancreaticoduodenectomy.
Cochrane Database Syst Rev. 2017 Sep 12;9:CD012257
26) Yang W, Zhu L, Meng B, Liu Y, Wang W, Ye S, Sun L, Miao H, Guo L, Wang Z,
Lv X, Li Q, Ji Q, Zhao W, Yang G. Subject-driven titration of biphasic insulin aspart 30
twice daily is non-inferior to investigator-driven titration in Chinese patients with type 2
diabetes inadequately controlled with premixed human insulin: A randomized,
open-label, parallel-group, multicenter trial. J Diabetes Investig. 2016 Jan;7(1):85-93
27) Aroda VR, Rosenstock J, Wysham C, Unger J, Bellido D, González-Gálvez G,
Takami A, Guo H, Niemoeller E, Souhami E, Bergenstal RM; LixiLan-L Trial
Investigators. Efficacy and Safety of LixiLan, a Titratable Fixed-Ratio Combination of
Insulin Glargine Plus Lixisenatide in Type 2 Diabetes Inadequately Controlled on Basal
Insulin and Metformin: The LixiLan-L Randomized Trial. Diabetes Care. 2016
Nov;39(11):1972-1980
Group. Efficacy and safety of the dipeptidyl peptidase-4 inhibitor sitagliptin added to
ongoing metformin therapy in patients with type 2 diabetes inadequately controlled with
metformin alone. Diabetes Care. 2006 Dec;29(12):2638-43
29) Pratley RE, Aroda VR, Lingvay I, Lüdemann J, Andreassen C, Navarria A,
Viljoen A; SUSTAIN 7 investigators. Semaglutide versus dulaglutide once weekly in
patients with type 2 diabetes (SUSTAIN 7): a randomised, open-label, phase 3b trial.
Lancet Diabetes Endocrinol. 2018 Apr;6(4):275-286
30) Ji LN, Pan CY, Lu JM, Li H, Zhu DL, Li Q, Li QF, Peng YD, Tian HM, Yao C,
Zhao ZG, Wang L, Wang BH; VISION Study Group. Efficacy and safety of combination
therapy with vildagliptin and metformin versus metformin uptitration in Chinese patients
with type 2 diabetes inadequately controlled with metformin monotherapy: a
randomized, open-label, prospective study (VISION). Diabetes Obes Metab. 2016
Aug;18(8):775-82
31) Aroda VR, Rosenstock J, Wysham C, Unger J, Bellido D, González-Gálvez G,
Takami A, Guo H, Niemoeller E, Souhami E, Bergenstal RM; LixiLan-L Trial
Investigators. Efficacy and Safety of LixiLan, a Titratable Fixed-Ratio Combination of
Insulin Glargine Plus Lixisenatide in Type 2 Diabetes Inadequately Controlled on Basal
Nov;39(11):1972-1980
32) Lachin JM, Bebu I, Bergenstal RM, Pop-Busui R, Service FJ, Zinman B,
Nathan DM; DCCT/EDIC Research Group. Association of Glycemic Variability in Type 1
Diabetes With Progression of Microvascular Outcomes in the Diabetes Control and
Complications Trial. Diabetes Care. 2017 Jun;40(6):777-783
33) Virk SA, Donaghue KC, Cho YH, Benitez-Aguirre P, Hing S, Pryke A, Chan A,
Craig ME. Association Between HbA1c Variability and Risk of Microvascular
Complications in Adolescents With Type 1 Diabetes. J Clin Endocrinol Metab. 2016
Figure Legends
Fig. 1 Glycemic variability (GV) based on CGM results
HMET group (Gray) and LMET+DPP4 group (purple) columns shows the result
of the CGM analysis. Standard Deviation (SD), Average Glucose Value (Mean),
Continuous overlapping net glycemic action (CONGA), Lability Index (LI),
J-Index, Low BG Index (LBGI) / High BG Index (HBGI), Glycemic risk assessment
diabetes equation (GRADE),
Mean of daily differences (MODD), Mean amplitude of glycemic excursions
(MAGE), Average daily risk range (ADDR), Mean absolute glucose (MAG). *
P
value from the two-sided test with a normal 5% significance level.
Fig. 2 Nocturnal hypoglycemia
(blood glucose < 70mg/dL, 0:00am~6:00am) based on CGM data.
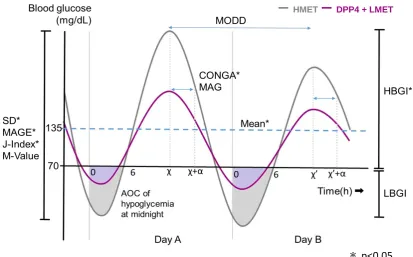
Fig. 3 Summary of the GV metrics
Standard Deviation (SD): It shows a grade of dispersion from average. Average
Glucose Value (Mean) Continuous overlapping net glycemic action (CONGA): It
was the SD of the glycemic differences recorded between a specific point on
the CGM profile and a point n hours previously. Lability Index (LI): It shows
lability values during past 4weeks. J-Index: It indicates glucose variability
calculated with Mean GV and SD. Low BG Index (LBGI) / High BG Index
(HBGI): these were parameters accounted for the frequency and amplitude of
hyperglycemic and hypoglycemic events. Glycemic risk assessment diabetes
equation (GRADE): It shows the risk attributable to hypoglycemia and
hyperglycemia.
absolute differences between glycemic gaps observed during the same time
interval on 2 consecutive days, as an expression of the “between-day” glucose
variability. Mean amplitude of glycemic excursions (MAGE): It was calculated as
the arithmetic mean of the difference between consecutive glycemic peak and
nadirs. Only considering change in glycemic values of more than 1 SD. Average
daily risk range (ADDR): The process of calculated is analogous to the
LBGI/HBGI calculation. It contributes to the risk of hypoglycemia and
hyperglycemia to the transformed point. M-Value: It used to quantify post
prandial blood glucose variation. Mean absolute glucose (MAG): It was
calculated the sum of the differences between successive glucose values
divided by the total time measured in hours.
*P
value from the two-sided test
with a normal 5% significance level.
*
*
*
*
*
*
Fig 2.
0 200 400 600 800 1000 1200 1400
HMET LMET+DPP4
AOC/nig
ht
(mg/dl
Fig 3.
ー
HMETー
DPP4 + LMETTable 1
T otal H M E T D P P 4+ LM E T H M E T vs D P P 4+ LM E T
p value
N o. of P atients 20 8 12
A ge (yrs) 57.1±11.1 54.5±11.4 58.8±11.0 0.20
D uration of D iabetes
(yrs) 13.0±9.9 10.5±11.0 14.6±9.3 0.19
B ody W eight(kg) 71.0±17.6 70.7±20.6 71.2±16.3 0.48
B M I(kg/m2) 26.6±4.5 25.8±5.2 27.2±4.2 0.25
abdom inal
circum ference(cm ) 91.4±11.2 88.1±10.4 93.5±11.6 0.17
S B P (m m H g) 132.6±19.3 128.1±17.0 135.6±19.2 0.20
D B P (m m H g) 79.1±13.7 76.0±9.2 81.4±16.3 0.21
T otal D aily D ose of
insulin (unit/kg) 0.48±0.22 0.38±0.13 0.55±0.25 0.04
B asal insulin dose /
T D D (% ) 37.6±11.6 40.3±12.4 35.8±11.3 0.20
H bA 1c(% ) 7.57±0.8 7.18±0.7 7.83±0.8 0.04
G A (% ) 18.5±2.80 17.2±3.1 19.3±2.3 0.05
fasting plasm a
glucose (m g/dL) 164.8±72.2 152.6±52.3 172.8±84.1 0.28
H D L-cholestrol
(m g/dL) 57.4±17.7 60.4±22.7 55.3±14.2 0.27
LD L-cholestrol
(m g/dL) 110.9±39.7 94.4±27.0 121.9±43.9 0.07
triglyceride (m g/dL) 144.7±75.0 116.9±59.6 163.3±80.7 0.09
urine creatinine
(m g/g・cre) 86.9±145.7 67.2±105.6 99.4±170.1 0.33
plasm a C -peptide
(ng/m L) 1.89±1.08 1.82±1.18 1.94±1.07 0.41
Table 2
baseline
H M E T LM E T + D P P 4 H M E T vs D P P 4+ LM E T P value N o. of treatm ent
subjects 20 20 20
B ody W eight(kg) 71.0±17.6 70.8±17.2 70.7±33.6 0.49
B M I(kg/m2) 26.6±4.5 26.6±4.5 26.7±9.15 0.48
abdom inal
circum ference(cm ) 91.4±11.2 93.9±13.6 91.3±26.9 0.31 S B P (m m H g) 132.6±19.3 127.2±14.2 129.5±21.9 0.29 D B P (m m H g) 79.1±13.7 75.1±10.9 77.1±16.4 0.26 T otal D aily D ose of
insulin (unit/kg) 0.48±0.22 0.55±0.26 0.49±0.44 0.22 B asal insulin dose /
T D D (% ) 37.6±11.6 37.8±12.3 38.4±28.9 0.45 H bA 1c(% ) 7.57±0.8 7.12±0.8 6.86±1.2 0.12
G A (% ) 18.5±2.80 16.8±3.4 16.9±6.0 0.49
fasting plasm a
glucose (m g/dL) 164.8±72.2 155.0±49.1 138.7±69.1 0.12 H D L-cholestrol
(m g/dL) 57.4±17.7 57.5±17.8 56.2±34.5 0.41 LD L-cholestrol
(m g/dL) 110.9±39.7 111.0±37.0 105.5±68.2 0.31 triglyceride (m g/dL) 144.7±75.0 168.5±161.4 145.9±193.8 0.30 urine creatinine
(m g/g・cre) 86.9±145.7 95.5±218.8 75.8±365.4 0.39
plasm a C -peptide