1
Determination of the Content of Mercury in Vitamin and Mineral Dietary
Supplements
Barbara Brodziak-Dopierała1,*, Agnieszka Fischer1, Patrycja Derkacz2, Jerzy Stojko1
1 Medical University of Silesia, School of Pharmacy with the Division of Laboratory Medicine,
Department of Toxicology and Bioanalysis, 4 Jagiellonska Str. 41-200 Sosnowiec, Poland
2 Hospital Pharmacy, Cancer Center and Institute Oncology, 7A Więźniów Oświęcimia Str.
44-101 Gliwice, Poland
* Correspondence: bbrodziak@sum.edu.pl; Tel.: +48-323641633
Abstract: Dietary supplements are more and more often used to increase daily intake
of essential vitamins and minerals. These preparations are classified as special category of foods
and are subject to food law, not pharmaceutical regulations. As a result the requirements to
dietary supplements are much less restrictive than to medications. Also simple and inexpensive
procedure of registration causes that the number of dietary supplements is widely spread every
year. On every manufacturing phases of dietary supplements, there is a risk of contamination.
One of the pollutions might be mercury which is classified as heavy metal. Its inorganic
compounds damage kidneys and liver and methylmercury is easily absorbed from
gastrointestinal system. Methylmercury is distributed in all tissues, also in nervous system. The
aim of study was to determine the level of mercury in multivitamins and multiminerals
preparations and to analyze the results. The study included 22 dietary supplements containing
vitamins and minerals available on Polish market. Mercury was analyzed with atomic
absorption spectrometry using AMA 254. The concentrations of Hg was 0.22–5.85 µg/kg (the
average content was 2.40 µg/kg). The highest average mercury content was 4.51 µg/kg, whereas
the lowest one was 0.31 µg/kg. The results was also analyzed in individual groups depending
on main component and indication for use as well as pharmaceutical formulation. Also
according to manufacturer’s recommendation, the dose of mercury taken with a single medicine
was estimated for time of a day, a week, a month, 3 months and also a year. The findings were
compared to limits defined in regulations of European Union and PTWI set by JECFA to assess
the health risk. The results presented in this study proved that the amount of mercury in tested
dietary supplements is much lower than the value of valid regulations. Analyzed supplements
as long as they are used with the recommendation of manufacturer, do not pose a threat to
human health.
2 Keywords: vitamin and mineral dietary supplements; mercury
1. Introduction
There has been a growing interest in dietary supplements among consumers for the last
several years. Their widespread availability and producers’ extensive marketing activities make
the supplement market in Poland grow very dynamically and their consumption increases
significantly. Agents that contain vitamins and minerals are recommended as an easy way to
supplement vital ingredients in the daily diet, and eliminate the effects of their deficiency [1].
According to food law, dietary supplements are food products and to be able to put them
into sale, a manufacturer is only required to submit a notification to the Chief Sanitary
Inspectorate [2, 3]. Thus, there is insufficient control of these products and risks of many side
effects that may occur in consumers [4]. Dietary supplements are not tested for interactions
with drugs and food, and are not observed when it comes to controlling possible side effects
[4-6].
Dietary supplements can be a potential source of mercury, among others, introduced into
the body with food, especially since in recent years there has been observed an increase in the
consumption of drugs and dietary supplements in developed countries such as the US, Canada
and Europe. This is related to low prices, easy accessibility, and the conviction that there are
no side effects in comparison with medicines [7, 8]. One of the major sources of toxic heavy
metals in complementary medicines products is deliberate introduction of some of the metals
including As, Hg, and Pb as therapeutic ingredients in Ayurvedic medicines [9]
Mercury in dietary supplements can come from various sources: contaminated raw
materials, reagents used in production, equipment and packaging [10]. In regulation No
629/2008 of 2 July 2008 by the EC Commission, the maximum acceptable levels for certain
pollutants (lead, cadmium, mercury) in food products related to the exposure of persons using
dietary supplements were set. Due to the detection of the above-mentioned heavy metals in
some food products, the maximum permissible levels of these heavy metals were set. For
mercury, the maximum level of its content in a dietary supplement available in trade is 0.10
mg/kg [11].
Mercury is one of the most toxic elements for humans, animals, plants and aquatic
organisms. It has mutagenic and teratogenic properties, and can accumulate in the human body
[12]. Toxic effects of mercury at the cellular level involve induction of oxidative stress and
mitochondrial activity dysfunctions. As a consequence, there is an increase in the concentration
of hydrogen peroxide, a decrease in the glutathione pool in mitochondria, an increase in lipid,
3
metallothionein, displacing zinc, copper and other trace elements, and also competes with
selenium, which causes a decrease in the activity of metalloenzymes. Moreover, the
mercury-selen complex limits the activity of the glutathione peroxidase enzyme, which participates in
the conversion of hydrogen peroxide into water, where selenium acts as a cofactor [16, 17].
The number of published work on the content of mercury in herbal dietary supplements is not too big [18-20]
The aim of the manuscript was to determine the content of mercury in vitamin and mineral
dietary supplements. An analysis of the results obtained depending on the main component and
an indication for the use of specific groups of dietary supplements and on the pharmaceutical
form in which it is available on the market was made. Additionally, daily mercury intake at the
maximum recommended doses during one day, one month, 3 months and one year was
determined. The data obtained was compared to the maximum permissible mercury content in
dietary supplements. The study included 22 dietary supplements containing vitamins and
minerals. Tab. 1 includes information about the tested preparations, their form, composition
and declared effects.
2. Materials and methods
The study included 22 dietary supplements containing vitamins and minerals available on
Polish market Tab. 1. The supplement were hand-powdered in a mortar. Then, they were
weighed and analysed using the AMA 254 atomic absorption spectrometer. Approximately 20
mg of powdered dietary supplement was weighed for each analysis and labelled. The device
was suitably cleaned in air and deionized water prior to each analysis and blank tests were
made.
Table 1. Composition and Action of Tested Vitamin and Mineral Supplements.
No. Ingredients Indication
1 vitamin: C
minerals: Zn, Se
supporting normal immune system function
2
vitamins: C, niacin, E, pantothenic acid, B6, riboflavin, thiamine, A, folic acid, K, D, B12
minerals : Ca, Mg, Fe, Zn, Mn, Cu, J, Se, Cr, Mo
dietary supplementation of vitamins and minerals for woman with menopause symptoms
3 vitamins : B6, pantothenic acid
minerals : Mg
designed for adult burden with mental activity and people aged 60 and over
4
vitamins: C, niacin, E, pantothenic acid, B6, riboflavin, thiamine, A, biotin, B12
minerals : Fe, Zn
skin, hair and nails regeneration
5 vitamins: niacin, B6, folic acid, E minerals: Ca
reduction of menopause symptoms, helps maintain weight, maintenance of normal bones function
6
vitamins: A, C, D, E, riboflavin, thiamine, niacin, B6, pantothenic acid, folic acid, B12, biotin
minerals: Ca, Fe, J, Mg, Zn, Mn, K, P, Se, Cr, Mo
vitamins and minerals supplement designed for active people
7 vitamin: D3
minerals: Ca, Mg, Zn
4
Markings were made using the AMA 254 device. AMA 254 is an atomic absorption
spectrometer that is designed to mark total mercury, regardless of the form in which mercury
occurs. Mercury is easily released from its compounds (organic and inorganic) by being
converted to an atomic form. This makes mercury marking simple and fast, and it is not
necessary to use an atomic absorption spectrometer with a hydride generator attachment.
Another advantage is that the pyrolytic mineralization process takes place inside the device and
it is not necessary to use the mineralizer for mercury marking. 8
vitamins: niacin, E, biotin, riboflavin, B6, thiamine, A, folic acid, D, B12
minerals: Zn, Mn, Cu, J, Se, Mo, Cr
ensures optimal intake of vitamins in minerals especially in period of increased demand, convalescence, autumn and winter time, intensive physical and mental activity
9
vitamins: E, riboflavin, tiamina, B6, niacin, folic acid, pantothenic acid, B12, C, A
minerals: Ca, Mg, Zn, Fe, Se, J
dietary supplementation of vitamins and minerals in period of increased demand, intensive physical and mental activity
10
vitamins: C, E, B6, folic acid , thiamine, riboflavin, B12, D, niacin, biotin, pantothenic acid
minerals: Fe, Zn, Mg, Ca, Cu, Mn, J
ensure optimal intake of immune system boosting ingredients
11
minerals: Zn, Cu ensure optimal daily intake of calcium, especially with
skin problems resulting from hyperactivity of sebaceous glands
12
vitamins: E, thiamine, riboflavin, B6, B12, C, biotin, niacin, pantothenic acid folic acid
minerals: Fe, Zn, J
supports keeping a good health and normal immune system function
13 vitamin: B6
minerals: Mg
supporting normal nervous system and muscles function, reducing physical fatigue
14
vitamins: C, niacin, E pantothenic acid, B6, riboflavin, thiamine, folic acid, K, D, B12
minerals: Ca, P, Mg, Fe, Zn, Mn, Cu, J, Cr, Se, Mo
supplementation of daily diet in vitamins and minerals in period of increased demand and physical fatigue
15
vitamins: C, riboflavin, niacin, E, pantothenic acid, B6, thiamine, A folic acid, biotin, D3, B12,K
minerals: Mo, Cr, J, Zn, Cu, Se, Mg, Mn, Ca, P, Fe
supplementation daily diet in vitamins and minerals
16
vitamins: thiamine, riboflavin, B6, C, E, PP, pantothenic acid, biotin, folic acid, A, D3 minerals: Fe, Zn, Mn, Cr, Cu, Mg, Se
supporting in period of physical fatigue, convalescence, supplementation deficiency of vitamins and minerals connected with inappropriate diet, abnormal absorption or increasing demand
17
vitamins: A, D, E, C, riboflavin thiamine , niacin, B6 folic acid, B12 biotin ,pantothenic acid
minerals: Ca, Mg, K, Zn, Fe, Mn, Cu, J, Se others: lutein, hyaluronic acid
dedicated for elderly people to help maintain proper daily intake of vitamins and minerals
18
vitamins: A, D, E, K, thiamine, riboflavin, niacin, pantothenic acid , B6, B12, C, biotin
minerals: Zn, I, Mg, Cu, Se, Fe
others: panax ginseng root extract, maca root extract
designed for active people, helps maintain natural immunity and vitality
19
vitamins: riboflavin , C, E minerals: Fe
maintaining proper condition of mucous membrane and red blood cells, keeping healthy skin, ensure proper metabolism of iron
20
vitamins: folic acid ,thiamine, riboflavin, B6, B12, niacin, B5, pantothenic acid, C, D
minerals: Mo, Cu, Se
helps safeguard daily intake of nutrients during pregnancy and postnatal period
21 vitamin: B6
minerals : Mg
reduction of tiredness and fatigue, contribute to the normal functioning of nervous system
22
vitamin: C minerals: Zn
5
Mercury measurement using this device consists of three stages:
• First, the solid or liquid sample is dried and then burned in a stream of oxygen
• In the second stage, released mercury vapours pass through the catalytic column and are
collected by the amalgamator (a small glass tube containing gold-coated ceramic material).
After collecting all of the mercury from the released gases, the amalgamer is heated to about
900°C, and mercury vapour is released to the detection system. In case of mercury-low
matrices, it is possible to concentrate it more.
• At the third stage (detection), mercury vapour is segregated into two parts in a device
called a cuvette. One part of the cuvette supplies a mercury carrier gas sample to an optical
pathway conducive to low mercury concentration analysis, and the other part supplies gas to
the optical pathway and is optimized for high mercury concentrations. This dual cuvette system
allows the device to extend the dynamic range for analysis results at different mercury
concentrations. The cuvette is set on the pathway of a typical atomic absorption spectrometer.
The spectrometer has a mercury lamp that emits light at a wavelength of 253.7 nm and a silicon
UV diode as a detector for mercury quantification [21].
This method uses the radiation absorption phenomenon by free mercury atoms in a basic state.
It consists in the fact that free mercury atoms absorb the radiation emitted by the mercury lamp
the hollow cathode of which is made of mercury. As a result, the initial intensity of radiation
emitted by the mercury lamp is reduced, and it is recorded by the spectrometer. The magnitude
of this reduction is proportional to the number of mercury atoms in released pairs of this
element.
The marking limit is: 0.003 ng of mercury in the marked sample. Medical or technical
oxygen that provides better combustion characteristics and guarantees repeatability of the
device is the carrier gas and the oxidizer.
The device is controlled by an external PC with advanced software (calibration curves,
statistical analysis of results, process control with display of a current signal) running on
Windows®.
The correctness of the applied method was determined using reference material
INCT-MPH-2 Polish Herbs Mixture, in which the mercury-certified content was 0.018 ± 0.002 mg/kg.
The content of mercury obtained from 5 repetitions was 0.019 ± 0.0004 mg/kg, and the recovery
value was 105.6%.
2.1. Statistical analysis
The statistical analysis of the results obtained was made using Microsoft Excel and
6
investigate the normality of mercury content distribution of the tested herbal supplements. For
this purpose, the Shapiro-Wilk (W) test was used. The mercury content distribution deviated
from a normal one (p>0.05), and was right-side developed. Non-parametric tests were used for
subsequent analyses. The values of arithmetic mean, standard deviation, change range, variation
coefficient, and median were used to develop and describe the results. Statistical variability
between particular groups was based on the ANOVA rang Kruskal-Wallis test for multiple
samples, and for equality between the two groups, the U Mann-Whitney test.
3. Results
The average mercury content in the tested dietary supplements was 2.40 μg/kg. In 9
preparations the content was above this value, while in 13 it was below. Preparations in which
the content of mercury was at a level that is close to the average value of all tested samples is
preparation No. 5 with a result of 2.40 μg/kg and preparations No. 21 and 13 with an average content of mercury of 2.31 μg/kg and 2.32 μg/kg. The highest average content of mercury was
determined in preparation No. 11, it was 4.51 μg/kg. However, the lowest content of this
element, 0.31 μg/kg, was found in preparation No. 12 – Tab. 2. The tested dietary supplements
were divided into 10 groups, depending on the indication for use and the content of the main
component.
Table 2. Statistical Analysis of the Content of Mercury in Vitamin and Mineral Supplements.
No. arithmetic mean standard deviation range
1 1.47 0.28 1.15- 1.63
2 2.13 0.04 2.09-2.16
3 1.63 0.23 1.37-1.79
4 1.34 0.14 1.24-1.50
5 2.40 0.15 2.23-2.51
6 1.00 0.04 0.96-1.04
7 0.99 0.06 0.93-1.04
8 3.46 0.08 3.41-3.55
9 4.03 0.21 3.81-4.24
10 3.32 0.36 2.93-3.62
11 4.51 1.07 3.42-5.49
12 0.31 0.15 0.22-0.49
13 2.32 0.11 2.20-2.43
14 1.46 0.07 1.38-1.52
15 2.0 0.66 1.45-2.81
16 0.36 0.02 0.34-0.38
7
18 3.48 0.09 3.42-3.58
19 4.20 0.90 3.37-5.85
20 3.93 0.73 3.30-4.98
21 2.31 0.34 1.99-2.75
22 2.74 0.05 2.69-2.79
whole 2.40 1.33 0.22-5.85
The highest average content of mercury of 4.51 μg/kg was determined in the group of
preparations supplementing the diet with copper and zinc, intended for skin problems resulting
from an excessive activity of sebaceous glands. A high content of mercury - 4.20 μg/kg was
also found in the group of preparations containing iron. In the group of folic acid supplements,
the content of mercury was 3.93 μg/kg. The lowest content of mercury of 0.99 μg/kg was found
in the group of preparations containing calcium and vitamin D3, and preparations supporting
the functioning of the skeletal system – Tab. 3. The content of mercury that is close to the
average content was found in the following groups of supplements: for menopausal women,
containing vitamin C, and in preparations with magnesium and vitamin B6.
Table 3. Statistical Analysis of the Content of Mercury in Vitamin and Mineral Dietary Supplements Depending on the Main Component and Indication for Use [μg/kg].
No. Main ingredient/indication arithmetic
mean
standard
deviation range
coefficient variability [%]
1 vitamins C/
supporting immune system 2.51 0.85 1.15-3.62 34
2 hop cones extract/
reduction of menopause symptoms 2.25 0.17 2.09-2.51 8
3 biotin, cysteinę/
hair, skin and nails regeneration 1.34 0.14 1.24-1.50 10
4
magnesium, vitamin B6/ supporting normal nervous system and muscles function, decreasing physical fatigue
2.11 0.40 1.37-2.75 19
5 calcium, vitamin D3/
maintenance of normal bones function 0.99 0.06 0.93-1.04 6
6
multivitamin supplements/ ensure optimal daily intake of vitamins and
minerals
2.01 1.52 0.22-4.24 75
7
zinc, copper/
skin problems resulting from hyperactivity of sebaceous glands
4.51 1.07 3.42-5.49 24
8
senior multivitamin supplements/ supplementation deficiencies in elderly people’s
diet
1.53 0.68 0.85-2.81 44
9
iron/
maintaining proper condition of mucous membrane and red blood cells
4.20 0.90 3.37-5.85 21
10
folic acid/
supplementation daily intake of nutrients during pregnancy and postnatal period
8
The Kruskal-Wallis ANOVA test showed the significance of differences between the
occurrence of mercury in individual groups, depending on the use and the main component, the
significance level was p < 0.05.
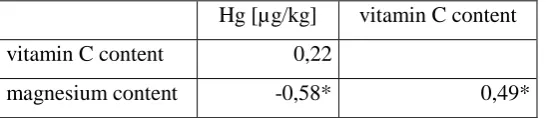
With the information on the content of magnesium and vitamin C in most of the tested
supplements, an analysis of the co-occurrence between the content of Mg, vitamin C and Hg
was made – Tab. 4. In the tested group of vitamin and mineral supplements, statistically
significant correlations occurred between the content of mercury and magnesium (-0.58) and
the content of magnesium and vitamin C (0.49).
Table 4. Spearman's Correlation Analysis.
Hg [µg/kg] vitamin C content
vitamin C content 0,22
magnesium content -0,58* 0,49*
* correlation coefficient statistically significant at p < 0,05
In terms of their pharmaceutical form, the tested dietary supplements were tablets, coated
tablets, drops and capsules. The highest content of mercury was found in coated tablets - 3.59
μg/kg, and the lowest in drops - 0.83 μg/kg.
The significance of differences between the co-occurrence of mercury depending on the
drug form was shown using the Kruskal-Wallis ANOVA test. Statistically significant
differences (p=0.005) in the content of mercury occurred between the following: drop-coated
tablet, drop-tablet, capsule-tablet, capsule-coated tablet, tablet-coated tablet – Tab. 5.
Table 5. Statistical Analysis of the Content of Mercury in Vitamin and Mineral Dietary Supplements
Depending on their Pharmaceutical Forms [μg/kg].
Pharmaceutical forms arithmetic
mean
standard
deviation range
coefficient variability [%]
tablet 2,33 0,34-5,49 1,18 51
coated tablet 3,59 1,45-5,85 1,12 31
drop-tablet 0,83 0,22-1,50 0,58 70
capsule 1,30 0,85-1,79 0,36 28
4. Discussion
Dietary supplements are a specific type of food that is subject to food law. Unlike
9
fact that the qualitative and quantitative compositions are required, there is no need to conduct
tests to confirm this information. All legal requirements for both the launching, labelling and
testing of dietary supplements are much less restrictive than for medicines, or they are simply
not specified [2].
There are many factors that make up the increase in consumption of dietary supplements
in many countries. First, as food products, supplements are widely available, which results from
legal regulations in force. More and more often, their use is considered by consumers as
necessary for the proper functioning of the body and health [5]. Advertising also plays an
important role. According to a report by the Supreme Audit Office, in 2015, every fourth
advertisement concerned health and medicinal products of which 62% were trade messages
with dietary supplements [22].
Among numerous groups of dietary supplements, the largest one is vitamin and mineral
dietary supplements. According to a report by the European Commission, the total value of the
dietary supplements market in 2005 was estimated at EUR 5 billion, and half of this value
concerned vitamin and mineral dietary supplements. The data shows that the Polish supplement
market grew by 219% in the years 1997-2005, which is the highest result among the EU
Member States [5, 23, 24].
Vitamin and mineral supplements that are easily available on the Polish market were selected
for the study. The conducted analysis of the content of mercury in these preparations did not
indicate any risk to human health. The determined concentrations of mercury were much lower
than the maximum permissible level of the content of mercury specified in the EC Commission
Regulation that amounted to 100 μg/kg [11, 22]. Additionally, to assess the safety of people
using dietary supplements, the PTWI index was used which is used to assess the uptake of
heavy metals with food in a given period. The European Food Safety Agency (EFSA) defines
PTWI, i.e. provisional tolerable weekly intake, as a defined amount of substance that can be
consumed within a week with food or water throughout life without significant adverse health
effects. The PTWI index is usually given in units of a given substance per kilogram of body
weight, and refers to chemicals that do not show immediate toxic effects and are not quickly
removed from the body. These include heavy metals such as mercury, arsenic, cadmium and
lead, which after a certain time accumulate in the body [25, 26]. The calculated PTWI indices
that determine the provisional tolerated weekly intake were lower than the values established
by the Expert Committee on Food Additives FAO/WHO (JECFA). Taking a formulation with
the highest determined content of mercury in accordance with the maximum recommended
10 Table 6. The average mercury content in the recommended daily portion and in the monthly, 3-month and annual treatment.
No. daily max dosage
average mercury content in 1 tablet
[µg]
daily intake [µg]
monthly intake [µg]
annual intake [µg]
1 2 0.00044 0.00088 0.0265 0.32
2 1 0.00064 0.00064 0.0192 0.23
3 1 0.00049 0.00049 0.0147 0.18
4 2 0.00040 0.00080 0.0241 0.29
5 1 0.00072 0.00072 0.0216 0.26
6 1 0.00030 0.00030 0.0090 0.11
7 1 0.00030 0.00030 0.0089 0.11
8 2 0.00104 0.00208 0.0623 0.76
9 1 0.00121 0.00121 0.0363 0.44
10 1 0.00100 0.00100 0.0299 0.36
11 3 0.00135 0.00406 0.1218 1.48
12 1 0.00009 0.00009 0.0028 0.03
13 1 0.00070 0.00070 0.0209 0.25
14 1 0.00044 0.00044 0.0131 0.16
15 1 0.00060 0.00060 0.0180 0.22
16 1 0.00011 0.00011 0.0032 0.04
17 1 0.00032 0.00032 0.0095 0.11
18 1 0.00104 0.00104 0.0313 0.38
19 1 0.00126 0.00126 0.0378 0.46
20 1 0.00118 0.00118 0.0354 0.43
21 1 0.00069 0.00069 0.0208 0.25
22 2 0.00082 0.00164 0.0493 0.60
Based on the results of the content of mercury obtained in the studied food supplements,
the content of this element in 1 tablet of the preparation was calculated. Using the information
on the maximum recommended portion placed by the manufacturer on the packaging of a
dietary supplement, the amount of mercury absorbed with this preparation during the day was
calculated. Additionally, the dose of mercury taken during the use of a given vitamin and
mineral supplement for 1 month, 3 months, and a year was calculated.
The greatest amount of mercury in one tablet that amounted to 0.00135 μg was determined in
preparation No. 11. When taking 3 tablets per day, which is the maximum dose recommended
by the manufacturer, 0.00406 μg of mercury per day will be delivered. The content of mercury
consumed during a monthly treatment is 0.1218 μg, whereas in a 3-month treatment it is 0.365
μg of mercury. The use of supplement No. 11 for one year equals to delivering 1.48 μg of Hg
to the body. The smallest amount of mercury in one tablet was in preparations No. 12 – 0.0009
11
serving, which is equal to one tablet. The monthly portion of preparation No. 12 contains 0.0028
μg of mercury and No. 16 - 0.0032 μg, and the annual dose - 0.03 μg and 0.04 μg, respectively.
As a result of analysing the collected samples of dietary supplements, it was shown that the
average content of mercury was 2.40 μg/kg. The lowest concentration of this element was 0.22 μg/kg, whereas the highest was 5.85 μg/kg. A higher content of mercury was obtained in the
studies carried out by Kowalski and Frankowski [7]. The range of mercury concentration in the
analysed dietary supplements available on the Polish market was 0.9-16.7 μg/kg, and the
average value was 5.9 μg/kg. The highest concentrations were obtained in groups of
supplements that contained micro- and macro-elements, as well as vitamins. The highest
content of mercury amounting to 16.7 μg/kg was determined in a preparation containing vitamin
C and rutin that supports the immune system [7]. In the studies by Kowalski and Frankowski
[7], the highest content of mercury was 3.7 ng of Hg in one tablet, whereas in our studies the
highest average content of Hg in one tablet was 1.4 ng of Hg. The amount of mercury taken
during the week was 207.2 ng of Hg/week [7], while in our study it was several times smaller
and amounted to 28 ng of Hg/week.
According to Socha et al. [27], the average content of mercury in supplements was
comparable to the obtained value and was 5.36 μg/kg. The range of Hg concentrations was
higher and amounted to 0.10-47.99 μg/kg. None of the tested preparations exceeded the
permissible content of mercury in food supplements. In the group of supplements that support
immunity, the concentration of this element was 9.62 μg/kg, whereas in our studies, the
concentration of mercury in this type of supplements was 2.51 μg/kg. What is more, a high
content of mercury amounting to 3.25 μg/kg was obtained in hair, skin and nails strengthening
preparations when compared to our studies - 1.34 μg/kg. The highest dose of mercury associated
with the use of a given product as recommended by the manufacturers was equal to 0.25% of
PTWI, and for the tested supplements it was 0.01% of PTWI.
The content of mercury in preparations containing calcium amounting to 0.99 μg/kg is similar
to the value of 1.52 μg/kg obtained in the study by Levine et al. [28]. According to Avula et al.
[29], from among 35 dietary supplements tested, only 2 of them contained mercury in the
amount of 0.2 μg of Hg/daily dose and 2.6 μg of Hg/daily dose. In the obtained results, the average amount of mercury in the daily portion was 0.00093 μg of Hg.
A higher content of mercury was determined in vitamin and mineral dietary supplements
in Lebanon in studies carried out by Korfali et al. [30]. The average concentration of mercury
was 80 μg/kg, and the range was from 10 up to 550 μg/kg. The obtained values did not exceed
12
In the studies that included 35 supplements available on the Croatian market [31], 14 of which
contained vitamins and minerals, the content of mercury in the range of 2-120 μg/kg was
determined.
The presence of mercury was also detected in Mexican dietary supplements in studies by
Garcia-Rico et al. [32], where the content of mercury ranged from 240 up to 850 μg/kg.
Despite the fact that the mercury concentrations in the studied vitamin and mineral supplements
were low and did not exceed the applicable standards, activities to control the concentration of
this element should be continued. Mercury shows high toxicity, even in low concentrations, its
presence in the environment is a threat to all living organisms [7]. Moreover, consumers often
experience the phenomenon of taking several dietary supplements simultaneously over a long
period of time, which increases the number of sources of potential exposure to mercury and the
risk of its accumulation. According to the applicable law, manufacturers are not obliged to
present the results of tests that would confirm that there is no contamination in a given product,
only randomly selected products are examined by the State Sanitary Inspection in this respect.
The lack of specific requirements in terms of ensuring a proper quality of dietary supplements
results in an increased risk of contamination of these substances and is dangerous to human
health. Due to the growing popularity of dietary supplements, including vitamin and mineral
products, which are increasingly used to supplement the daily diet with essential nutrients, the
quality of these products needs to be controlled at all stages, both at the initial stages of
production and in the final products [33, 34].
5. Conclusions
The content of mercury in the studied dietary supplements averaged 2.40 μg/kg, ranging from
0.22-5.85 μg/kg.
The highest content of mercury was found in a product supplementing zinc and copper (4.51
μg/kg), whereas the lowest in the vitamin and mineral preparation (0.31 μg/kg).
The analysis of supplements in terms of the main component and indications for use showed
the lowest content of mercury in supplements containing calcium and vitamin D3. Significant
statistical differences in the occurrence of mercury were found, depending on the indication for
use and the main component.
Using the correlation analysis, the existence of statistically significant interdependencies
between mercury and magnesium of an antagonistic nature were found.
There were differences in the content of mercury, depending on the pharmaceutical form of the
13
The determined content of mercury does not exceed the standards specified in the EC
Commission Regulation, and the PTWI indicator set by JECFA. The consumption of the
maximum recommended portions of the tested products is safe in the respect of mercury.
Acknowledgments: This work was financed by the Medical University of Silesia in Katowice (contract No. KNW-640-2-1-063/18).
Conflicts of Interest: The authors declare no conflict of interest.
References
[1] Szewczyk, P. Dopuszczanie do obrotu suplementów diety. Najwyższa Izba Kontroli
LLO.430.002. Nr ewid. 195/2016/P/16/078/LLO, 2016.
https://www.nik.gov.pl/plik/id,13031,vp,15443.pdf
[2] Bojarowicz, H.; Dźwigulska, P. Suplementy diety. Część I. Suplementy diety a leki – porównanie wymagań prawnych. Hygeia Public Health 2012, 47, 427-432. http://www.h-ph.pl/pdf/hyg-2012/hyg-2012-4-427.pdf
[3] Gęsiak, K.; Kondrat, M.; Stefańczyk-Kaczmarzyk, J. Prawo suplementów diety. Wolters Kluwer Warszawa 2012, 16-27.
[4] Krejpcio, Z.; Skwarek, K.; Hyżyk, A. Ocena powszechności spożycia suplementów diety. Probl. Hig. Epidemiol. 2011, 92, 935-938.
[5] Krasnowska, G.; Sikora, T. Suplementy diety a bezpieczeństwo konsumenta. Żywność. Nauka.
Technologia. Jakość.2011, 4, 5-23
[6] Zasady wprowadzania po raz pierwszy do obrotu suplementu diety, środków spożywczych specjalnego przeznaczenia żywieniowego oraz żywności wzbogaconej https://suplementy.gis.gov.pl/ (accessed on 15 March 2018)
[7] Kowalski, A.; Frankowski, M. Levels and potential health risks of mercury in prescription, non-prescription medicines and dietary supplements in Poland. Regul. Toxicol. Pharmacol. 2015, 73, 396-400
[8] Genuis, S.; Schwalfenberg, G.; Siy, A. Toxic element contamination of natural health products and pharmaceutical preparations. Plos One2012, 7, 1-12.
[9] Bolan, S.; Kunhikrishnan, A.; Seshadri, B.; Choppala, G.; Naidu, R.; Bolan, N.S.; Ok, Y.S.;
Zhang, M.; Li, C.G.; Li, F.; Noller, B.; Kirkham, M.B. Sources, distribution, bioavailability, toxicity, and risk assessment of heavy metal(loid)s in complementary medicines. Environ. Int.
2017, 108, 103-118. doi: 10.1016/j.envint.2017.08.005.
[10] Moret, S.; Prevarin, A.; Tubaro, F. Levels of creatine, organic contaminations and heavy metals in creatine dietary supplements. Food Chem. 2011, 126, 1232-1238.
[11] WHO (World Health Organization). Mercury and health, 2013. Available online: http://www.who.int/mediacentre/factsheets/fs361/en/ (accessed on 13 March 2018)
[12] Abernethy, D.R.; DeStefano, A.; Cecil, T. Metal impurities in food and drugs. Pharm. Res. 2010, 27, 750-755.
[13] Genchi, G.; Sinicropi, M.; Carocci, A. Mercury exposure and heart diseases. Int. J. Environ. Res. Public Health2017, 14, 74.
14
[15] Wu, X.; Cobbina, S.J.; Mao, G.; Xu, H.; Zhang, Z.; Yang, L. A review of toxicity and
mechanisms of individual and mixtures of heavy metals in the environment. Environ. Sci.
Pollut. Res. 2016, 23, 8244–8259. DOI 10.1007/s11356-016-6333-x
[16] Syversen, T.; Kaur, P. The toxicology of mercury and its compound. J. Trace Elem. Med. Biol.2012, 26, 215-226
[17] Bernhoft, R. Mercury toxicity and treatment: A review of the literature. J Environ Public Health 2012, 460508. doi: 10.1155/2012/460508.
[18] Kim, M.; Lee, Y.; Park, K. Vitamin and mineral supplement use among korean adults: Baseline data from the trace element study of korean adults in Yeungnam area. Nutrients 2018, 10, 50. doi: 10.3390/nu10010050
[19] Park, J.H.; Hwang, M.S.; Ko, A. Total mercury concentrations in the general Korean population, 2008-2011. Regul. Toxicol. Pharmacol. 2014; 70, 681-686.
[20] Barrella, M.V.; Heringer, O.A.; Cardoso, P.M.M.; Pimentel, E.F., Scherer, R.; Lenz, D.; Endringer, D.C. Metals content in herbal supplements. Biol. Trace Elem. Res.2017, 175, 488-494. doi: 10.1007/s12011-016-0776-2.
[21] Różycka, K.; Rolka, G. Zastosowanie techniki ASA do oznaczania rtęci na przykładzie badań surowców używanych w przemyśle materiałów budowlanych. Instytut Ceramiki i Materiałów Budowlanych. 2015,21, 58-66.
[22] Raport Najwyższej Izby Kontroli. Informacja o wynikach kontroli. Dopuszczenie do obrotu suplementów diety. 2017. (accessed on 14 March 2018)
[23] Commission staff working document „Characteristics and perspectives of the market for food supplements containing substances other than vitamins and minerals” – Bruksela, 5.12.2008
SEC(2008) 2976 (accessed on 15 March 2018)
[24] Raport PMR. Rynek suplementów diety w Polsce w 2015. Prognozy rozwoju na lata 2015-2020. (accessed on 15 March 2018)
[25] https://www.efsa.europa.eu/en/glossary-taxonomy-terms (accessed on 15 March 2018)
[26] Herrman, J.L.; Younes, M. Background to the ADI/ TDI/ PWTI. Regular. Toxicol. Pharmacol.
1999, 30, 109-113
[27] Socha, K.; Michalska-Mosiej, M. Zawartość rtęci w suplementach diety. Probl. Hig. Epidemiol.
2013, 94, 645-647
[28] Levine, K.; Levine, M.; Weber, F. Determination of mercury in an assortment of dietary supplements using an inexpensive combustion atomic absorption spectrometry technique. J. Anal. Methods Chem.2005, 4, 211-216.
[29] Avula, B.; Wang, Y.H. Inorganic elemental compositions of commercial multivitamin/mineral dietary supplements: Application of collision/reaction cell inductively coupled-mass spectroscopy. Food Chem. 2011, 127, 54-62.
[30] Korfali, S.I.; Hawi, T. Evaluation of heavy metals content in dietary supplements in Lebanon.
Chem. Cent. J.2013, 7, 10.
[31] Tumir, H.; Bosnir, J. Monitoring of metal and metalloid content of dietary supplements on the Croatian market. Food Control2010, 21, 885-889.
[32] García-Rico, L.; Leyva-Perez, J.; Jara-Marini, M.E. Content and daily intake of copper, zinc, lead, cadmium and mercury from dietary supplements in Mecixo. Food Chem. Toxicol.2007, 45, 1599-1605
[33] TNS Raport „Świadome samoleczenie w Polsce – http://www.lekiczysuplementy.pl 2014” z badania przeprowadzonego na zlecenie platformy edukacyjno-informacyjnej http://www.lekiczysuplementy.pl (accessed on 15 March 2018)