Cultural differences in environmental
valuation
Andersen, M.D
1., Kerr, G.N
2. & Lambert, S
31
maiki.anderson@lincolnuni.ac.nz
2
geoffrey.kerr@lincolnuni.ac.nz
3
lambers2@lincolnuni.zc.nz
Paper presented at the 2012 NZARES Conference
Tahuna Conference Centre – Nelson, New Zealand. August 30-31, 2012
Cultural differences in environmental valuation
Andersen, M.D., Kerr, G.N. and Lambert, S
Department of Environmental Management, Lincoln University, PO Box 84, Lincoln 7647, Canterbury, New Zealand; E-Mails: maiki.andersen@lincolnuni.ac.nz,
Geoffrey.Kerr@lincoln.ac.nz, lambers2@lincoln.ac.nz
Abstract
The application of stated preference non-market valuation approaches in settings where there are strong cultural differences in environmental perspectives potentially misrepresent strengths of preferences for different groups. This paper reports on a study that measured strength of affiliation with traditional Māori identity, strength of connection with nature, and monetary measures of value derived from a choice experiment. The relationships between these three measures are explored to test the alignment of Māori identity with connection to nature, and to test the dependence of monetary valuation on cultural identity and connection with nature. The tests are applied in the context of a case study addressing water management in the Waikato Region.
Keywords: cultural valuation, environmental valuation, choice modelling, cultural identity, water preservation, Māori values, connectedness to nature
1.
Introduction
The use of freshwater resources in New Zealand is fast becoming a highly contested issue, fuelled by conflicting values regarding the allocation, misuse and degradation of these resources and the surrounding land. This is not only between users of the resource, but those who hold non-use values such as existence values, bequest values of preservation for future generations, and option values of knowing the resource is still available. The joint management agreement of the Waikato River is a recent example of where these conflicting values have been recognised and efforts are now being made to account for all of these in the future management of the River (Steenstra, 2009). The Ministry for the Environment (2004) state that this demand for water use will increase if current patterns are followed. Thus, there are pressures to increase the use of water resources for economic purposes, and to conserve the state of the resource for social and cultural wellbeing.
comparison with the land owner’s income gained from an intensive dairy farm? Or, the enjoyment from recreational activities compared with the value of ecosystems within a water body?
The Resource Management Act 1991 (s5-8) states a number of specific provisions for Māori cultural and spiritual values towards natural resources including; the cultural and traditional relationships of Māori and water bodies, waahi tapu and other taonga, their kaitiaki responsibilities and the principles of the Treaty of Waitangi. Despite these provisions and other legislative policies, Awatere (2008), Bennett (2005) and Townsend et al. (2004) suggest there is limited identification, measurement and accounting for these values in practice, due to the lack of measurement tools. On the other hand, the extent of subscription to traditional Māori values has been questioned by Meredith (1998), who pointed out the significant urban shift that has resulted in reduced tribal identity.
This paper aims to determine whether there is a significant difference between Māori and non-Māori values towards water resources. To investigate this matter;
Values were calculated for both groups using choice modelling.
A cultural identity scale was developed to examine diversity of values within the Māori population.
A connectedness to nature scale was applied to measure environmental identity and its effect on the values held by individuals.
The impact of Māori ethnicity, cultural identity and connectedness to nature on values revealed in the choice model were compared.
The paper is organised as follows. The remainder of this section provides an overview of the different techniques and applications to measure values, and provides background into the debate of measuring indigenous values. Section 2 outlines and describes the methodology. Section 3 provides results. Section 4 discusses implications of these results. Lastly, Section 5 finishes with concluding comments.
1.1. Measuring Value
Traditional Māori beliefs, like the beliefs of many Indigenous cultures, are centred around the view that Māori are an intrinsic part of the natural world. Water holds both spiritual non-use, and use significance for Māori. The natural environment sustains and protects all living things, and in turn Māori people have a kaitiaki (spiritual guardian) responsibility to respect and sustain the environment (Awatere, 2008). Tipa and Teirney (2006) have developed a cultural health index (CHI) for streams and waterways, incorporating techniques inclusive of the holistic principles that govern Māori management of natural resources. CHI was developed to aid participation in resource management processes and highlight strong Māori values. However, it does not provide a common measure that enables comparison of Māori values to those of non-Māori.
theoretically capable of measuring all aspects of environmental value, there is debate over their validity and appropriate use in regards to indigenous cultures. Awatere (2005a, 2008) questioned the application of neoclassical economic valuation to indigenous values that are often considered to be intangible and/or sacred, and should not be subjected to monetary reductionism, ideas supported by Steenstra (2009) and Venn and Quiggin (2007). This is not to say that these Māori values cannot be measured using these techniques, but, in accordance with Adamowicz et al. (1998), potential problems need to be accounted for in the survey design. Cultural groups may share similarities, but they are unlikely to be homogenous (Adamowicz et al. 1998). While some may hold strong or even intangible values towards natural resources, this is unlikely to hold true for all. Therefore, it is important to consider heterogeneity within the Māori population.
1.2. Measuring Environmental Identity
While the values held by an individual can be formed as a result of cultural background, they can similarly be affected by adopted beliefs, worldviews and ideologies, independent of culture. The environmental movement which began in earnest in the 1970s (Dunlap et al., 2000) is generally centred around bio-centric and eco-centric benefits to the water resource itself (De Steiguer, 2006). Consequently “non-use” values such as ecology, conservation, existence and bequest values tend to take a higher level of importance over recreational and economic values. This environmental worldview developed out of western society and is based on western concepts; however, in regards to the approach to environmental issues, there has been recognition of the similarities between this worldview and indigenous worldviews (Groenfeldt, 2003).
A number of different techniques are available to measure environmentalism, environmental worldviews, environmental concern and environmental identity. The New Ecological Paradigm (NEP) scale is a commonly used measure of environmental worldview (Dunlap & Van Liere, 1978), along with Weigel and Weigel’s (1978) Environmental Concern Scale and Blaikie’s (1992) Ecological World View Scale. These are generally in the form of attitudinal questions that can be compared to calculated stated preference values. The Connectedness to Nature Scale (CNS), developed by Mayer and Frantz (2004), measures emotional connection to nature, which is a concept similar to the Maori traditional worldview in which humans are a part of nature. For this reason it has the potential to resonate well with both Māori and non-Māori.
1.3. Measuring Cultural Identity
There is a wide scope of people who identify as Māori, yet have very different levels of immersion in cultural life and practices (Awatere, 2005b). As Awatere (2005a) suggests, many ethnic Māori live a predominantly Pākehā (New Zealand European) life. This heterogeneity within Māoridom may have important implications, both for acceptance of environmental valuation and the estimates of values measured by it.
connection to the natural world, which is of interest in this study. Awatere (2008) used an adaption of this measure on the basis that knowledge of the values and principles of Māori resource management should be incorporated when assessing environmental issues. Awatere’s identity scale included indicators regarding kaitiakitanga (spiritual guardianship), mahinga kai (traditional food gathering sites) and traditional restoration practices. A further scale, the Multi-dimensional Model of Māori Identity and Cultural Engagement (MMMICE), developed by Houkamau and Sibley (2010) includes components of spirituality and beliefs that were not incorporated in the previous two scales, addressing the essence of ‘being’ Māori.
Awatere (2010) found little evidence to confirm a relationship between cultural identity and concern for the environment. He concluded that a person’s cultural identity should not be reduced to a single number, and suggested that caution is necessary in relying on these scales. Franceško et al. (2005) used a similar scale to measure European identity, finding that identity is not an unchanging state or number that can apply to numerous situations, but a process that develops and transforms. For this reason they used cluster analysis to identify groups, where respondents differ significantly between groups, but are broadly similar within groups. Clusters were used as criteria for classification of different levels of identity (Franceško et al., 2005). This technique could be applied to Māori identity scales in an attempt to apply Awatere’s suggestions.
2.
Methodology
Data was obtained from a sample of students enrolled at Waikato University in the first semester of 2012. Participants were recruited to the online survey by email, the social networking site Facebook, and faculty newsletters. This particular case study population was chosen because of the high proportion of Māori students1. Limiting the population to university students reduced diversity of a number of socio-demographic characteristics, such as age2, income and education.
Feedback interviews were conducted after the initial development of scales and identification of possible attributes for the choice experiments, to test the acceptance of these measures and the general attitudes and values of a small selection of the sample population. Participants in the feedback group consisted of 13 University of Waikato students, both Māori and non-Māori, who were not invited to participate in the final survey.
2.1. Survey design
The Māori Cultural Identity (MCI) scale used in this study was developed from the Te Hoe Nuku Roa scale (1996), the adaption of this scale by Awatere (2008), and the Multi-dimensional Model of Māori Identity and Cultural Engagement (MMMICE) (Houkamau & Sibley, 2010).
The MCI, displayed in Appendix 1, assesses four dimensions; (1) racial identity and Māori relationships (Q1, Q2 and Q6), (2) active engagement in cultural practices (Q4, Q5 and Q7), (3) subscription to Māori beliefs, values and spirituality (Q3, Q8, Q9 and Q10), and (4) self-identity and evaluation of individual membership (Q11 and Q12). Dimensions 1 and 2 were
1 18% of the total student population, which is significantly above the national average of 9% (Ministry of
Education, 2011)
2 85% of university students in New Zealand are within the age range of 18-39 years (Ministry of Education,
well covered in Te Hoe Nuku Roa’s MCI. Awatere incorporated some aspects of dimension 3 with beliefs regarding natural resources, while Houkamau and Sibley highlight the importance of dimension 4, particularly self-identity. Although this scale has not been tested elsewhere, the pre-existing scales were unable to capture many of the complex dimensions of Māori identity in relation to natural resources. In order to test the adapted scale, Māori participants in the feedback interviews were asked to critically evaluate it, resulting in the removal of one of the original questions and rewording other questions for improved clarity.
The Connectedness to Nature Scale (CNS) developed by Mayer and Frantz (2004) was used to measure environmental identity of respondents and their emotive connection with nature. This scale, consisting of 14 questions, required respondents to answer on a 5-point Likert scale, ranging from strongly agree to strongly disagree (Appendix 2). Feedback interviewees were satisfied with the scale, despite concerns of vagueness raised by colleagues.
Choice experiment attributes and their corresponding levels were chosen based on an extensive review of literature, identifying features of water resources most important to both Māori and non-Māori, and in consideration of relevant issues in the Waikato region. Harmsworth and Warmenhoven (2002), in their development of Māori community goals for enhancing ecosystem health, and Tipa and Tierney (2006), in their development of the CHI, outlined a number of attributes that were important to Māori. Similarly, important attributes to non-Māori were selected based on Kerr and Sharp’s (2003) study of community mitigation preferences and Kerr and Swaffield’s (2007) extensive review of attributes used in choice modelling. Recurring attributes included; water clarity, water quality, water safety, wildlife habitat, ecosystem abundance and diversity, river flow and levels, riverbank condition, riverbank vegetation, access, recreation, water use, and surrounding land use. In consideration of the potential problems with asking Māori to put a money value on water, alternative cost numeraires considered were the number of local jobs (Marsh, 2010) and change to the regional economy (Mallawaarachchi et al., 2001; Rolfe et al., 2000).
Choice model attributes were posed to participants in the feedback interviews. Participants tended to be concerned with water quality from a safety and use view, i.e. whether it was safe to drink, swim in, or fish in. River flow and level were of less concern, consistent with the low priority given to this issue in the region in comparison to urgent problems with water quality (Waikato Regional Council, 2011). The resulting attributes and levels are shown in Appendix 3. All attributes were characterised by three levels, aside from water clarity which had only two levels. Visual aids were used to ensure respondents could unambiguously interpret the choice options available to them.
The choice sets were identified using Ngene experimental design software. The design consisted of three alternatives and six generic variables. Parameters for the design were chosen based on the value estimates for each attribute obtained from the feedback interviews. Because all alternatives were unlabelled and no status quo alternative was used, there was no need for alternative specific constants. Feedback interviews highlighted the different weighting from respondents on improvements in the environmental attributes from one level to another, which were non-linear for riparian vegetation, water quality and water clarity, so these three variables were dummy-coded.
2.2. Data Analysis
Response rates for this study were very low, possibly due to the timing of participant recruitment close to the exam period. Over 1000 students were directly emailed and more were targeted via social networking site Facebook and faculty newsletters. Only 102 people completed the survey, with 23 of those respondents identifying as Māori.
The responses from the CNS scale were added to give each individual a score indicative of their connection with nature. Those with scores less than 26 were classified as High CNS scores, reflective of a stronger connection to the natural world. Cluster analysis was carried out using the Statistical Package for Social Sciences (SPSS) to classify Māori respondents into groups of similar identity based on their responses to the MCI questions (Table 1). Data was first classified using Ward’s method and squared Euclidean distance to identify the optimal number of clusters. Steps in the difference between coefficients in the agglomeration schedule suggested two, four, or seven clusters would be adequate. The option of seven or four clusters could immediately be dismissed. With only 23 Maori respondents some groups would contain only four or fewer members.
K-means cluster analysis was performed with two clusters. The observed significance in one way ANOVAs indicated that all variables aside from question five were significant, thus this question was removed from the classification. The characteristics of the two clusters are described in Table 1.
Table 1 - Cluster groups from the MCI scale
Choice analysis was carried out using NLogit 4.0 to test for differences between Māori and non-Māori values, the differences in CNS scores and individual preferences, and the difference between the different MCI clusters and individual preferences. To estimate utility function parameters and their impacts, a combined approach was taken. Attributes for riparian vegetation, water quality and water clarity are effects coded to account for non linear effects in attribute levels (Hensher et al, 2005). Initially, the MNL was applied. In order to investigate respondent heterogeneity and its underlying drivers, the Latent Class Model (LCM) and the Random Parameters Logit (RPL) model were used. The LCM allocates respondents into classes based on similarity of preferences and evaluates the effect of covariates on class allocation. RPL examines preference heterogeneity around the population mean parameter estimate and the influence of covariates on this heterogeneity (Hensher et al., 2005).
3.
Results
The sample of 102 Waikato University students was comprised of 65% females, and 35% males, of which 63% identified as New Zealand European and 23% Māori. Approximately half of the respondents had resided in the Waikato region for over five years. The age range
Cluster Identifier Description
1 Strong MCI Strong Māori cultural relationships, beliefs and self identity. Moderate participation in Māori cultural practices
was consistent with the previously stated Ministry of Education (2011) national average3, with the majority of the sample between 18 and 23 years old, and 86% of the sample under 40 years of age. Over half of the students were completing a bachelor’s degree; the next most popular degree was a master’s (24% of the sample).The Faculty of Science and Engineering was the largest contributor, supplying 37% of the sample, followed by Waikato Management School (19%), the Faculty of Arts and Social Sciences (17%), and the Faculty of Law (14%).
Separate MNL models were estimated for non-Māori and Māori respondents, which were compared to a pooled model. The pooled model (Model 1, Table 2) resulted in utility coefficients for all parameters that were significant to the 1% level. A log-likelihood test was used to evaluate whether the overall preferences in the two ethnically separated models were significantly different. The log-likelihood test statistic (3.2996) is distributed chi-squared with 9 degrees of freedom. It is not statistically significant (p=0.9512), indicating that the separate models do not offer a superior fit.
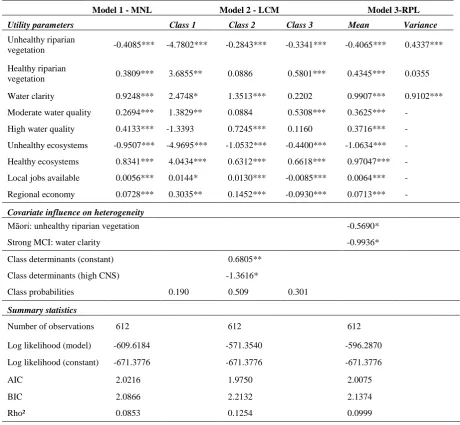
Table 2 - Discrete Choice Modelling estimates
Model 1 - MNL Model 2 - LCM Model 3-RPL
Utility parameters Class 1 Class 2 Class 3 Mean Variance
Unhealthy riparian
vegetation -0.4085*** -4.7802*** -0.2843*** -0.3341*** -0.4065*** 0.4337***
Healthy riparian
vegetation 0.3809*** 3.6855** 0.0886 0.5801*** 0.4345*** 0.0355
Water clarity 0.9248*** 2.4748* 1.3513*** 0.2202 0.9907*** 0.9102*** Moderate water quality 0.2694*** 1.3829** 0.0884 0.5308*** 0.3625*** -
High water quality 0.4133*** -1.3393 0.7245*** 0.1160 0.3716*** - Unhealthy ecosystems -0.9507*** -4.9695*** -1.0532*** -0.4400*** -1.0634*** -
Healthy ecosystems 0.8341*** 4.0434*** 0.6312*** 0.6618*** 0.97047*** - Local jobs available 0.0056*** 0.0144* 0.0130*** -0.0085*** 0.0064*** -
Regional economy 0.0728*** 0.3035** 0.1452*** -0.0930*** 0.0713*** -
Covariate influence on heterogeneity
Māori: unhealthy riparian vegetation -0.5690*
Strong MCI: water clarity -0.9936*
Class determinants (constant) 0.6805**
Class determinants (high CNS) -1.3616*
Class probabilities 0.190 0.509 0.301
Summary statistics
Number of observations 612 612 612
Log likelihood (model) -609.6184 -571.3540 -596.2870
Log likelihood (constant) -671.3776 -671.3776 -671.3776
AIC 2.0216 1.9750 2.0075
BIC 2.0866 2.2132 2.1374
Rho² 0.0853 0.1254 0.0999
Notes: *,** and *** indicate statistical significance at the 10%, 5%, and 1% level
Latent Class Models with two, three and four classes were explored. A three class model was selected as the base for continued analysis due to superior significance of parameter coefficients, a lower Akaike information criterion (AIC) statistic and higher McFadden’s adjusted R2 values. The three class model (Model 2, Table 2) is characterised by 23 out of 27 parameter estimates significant at least to 10%. Class one is not significantly concerned with high water quality, class two is not significantly concerned with healthy riparian vegetation and moderate water quality, and class three is not significantly concerned with water clarity or high water quality. The only statistically significant determinant of class membership was high CNS, which decreased probability of membership in class 2.
The RPL model (Model 3, Table 2) was applied to test the presence of heterogeneity around the mean of parameter estimates on the basis of measured covariates. In determining the best model fit and significance, only the variables for unhealthy riparian vegetation, healthy riparian vegetation and water clarity were treated as random parameters. Māori ethnicity was found to have a significant influence on the heterogeneity around the mean for unhealthy riparian vegetation. Similarly, strong MCI has a significant influence on water clarity.
4.
Discussion
The limited correlation between Māori and variance in the estimated choice models suggest that Māori ethnicity has little influence on choice behaviour. Based on this observation there is no significant difference between Māori and non-Māori respondents in this study. This is not a surprising outcome with similar studies looking and cultural valuation in New Zealand, by Awatere (2008) and Lambert et al. (1992), coming to the same conclusion. This study does not reflect a representative sample of the population and cannot be extrapolated in any way. However, these findings support the notion that in a situation where Māori and non-Māori are similarly educated, and integrated into an urban western society, there may be little difference between the values of the two populations. It should be noted that carrying out a similar study on a small rural community in the North Island where strong tribal ties are retained could produce very different results (Panelli & Tipa, 2007).
Based on the results from this study, there was no evidence of a positive correlation between stronger affinity with nature, as reflected in the CNS scores, and higher preference for environmental attributes in the choice experiments. The CNS score demonstrated only a weak correlation with choice behaviour of respondents in class two of the LCM, and this relationship indicated people with a higher CNS were less likely to be assigned to that class. Looking at the response to the CNS scale, there were a large number of respondents scoring in the middle range. This may indicate indifference to the scale, neither agreeing nor disagreeing with the questions asked. As a result the scale may have only picked up those have a very strong affinity to nature and those who felt none, or little affinity. While comparisons and tests with the high CNS group should have avoiding this problem, with only 18 out of the 102 total respondents assigned to this group, it is a small sample to work with in making statistically significant comparisons.
possible that with a larger sample of Māori, three of four clusters would have been statistically feasible, allowing for a group that exhibited full immersion in all dimensions of the Cultural Identity Scale. Similarly a larger Māori sample could have aided. Similarly, with the LCM, 50% of the sample assigned to class one, with 20% and 30% in the other two classes. With only 23 Māori respondents is it possible that these smaller classes had very few Māori which inhibited any significant relationship to be calculated.
5.
Conclusion
References
Adamowicz, W., Beckley, T., MacDonald, D. H., Just, L., Luckert, M., Murray, E., & Phillips, W. (1998). In search of forest resource values of indigenous peoples: Are nonmarket valuation techniques applicable? [Article]. Society & Natural Resources, 11(1), 51-66.
Awatere, S. (2005a). Can non-market valuation measure indigenous knowledge? Paper presented at the meeting of the Australian Agricultural and Resource Economics Annual Conference, Coffs Harbour, Australia.
Awatere, S. (2005b, 26-27 August, 2005). The influence of cultural identity on willingness to pay values in contingent valuation surveysNew Zealand Agricultural and Resource Economics Society. Symposium conducted at the meeting of the 2005 NZARES Conference, Nelson, New Zealand.
Awatere, S. (2008). The Price of Mauri: Exploring the validity of Welfare Economics when seeking to measure Matauranga Maori (PhD). University of Waikato, Hamilton, New Zealand.
Awatere, S. (2010). What Is the Degree of Matauranga Maori Expressed through Measures of Ethnicity? AlterNative: An International Journal of Indigenous Peoples, 6(1), 1-14.
Bennett, J. (2005). Australasian environmental economics: contributions, conflicts and ‘cop outs’. Australian Journal of Agricultural and Resource Economics, 49(3), 243-261.
Bennett, J., Dumsday, R., Howell, G., Lloyd, C., Sturgess, N., & Van Raalte, L. (2008). The economic value of improved environmental health in Victorian rivers. The Australian Journal of Environmental Management, 15, 138-148.
Blaikie, N. W. H. (1992). The Nature and Origins of Ecological World Views: An Australian Study. Social Science Quarterly, 73(1), 144-165.
De Steiguer, J. E. (2006). The origins of modern environmental thought. Tuscon: University of Arizona Press.
Dunlap, R. E., & Van Liere, K. D. (1978). The new environmental paradigm: a proposed instrument and preliminary results. Journal of Environmental Education, 9(4), 10-19.
Dunlap, R. E., Van Liere, K. D., Mertig, A. G., & Jones, R. E. (2000). New trends in measuring environmental attitudes: measuring endorsement of the new ecological paradigm: a revised NEP scale. Journal of Social Issues, 56(3), 425-442.
Franceško, M., Kodžopeljić, J. S., & Mihić, V. (2005). European identity in Serbia and Montenegro. Psihologija, 38(2), 149-165.
Groenfeldt, D. (2003). The future of indigenous values: cultural relativism in the face of economic development. Futures, 35(9), 917-929.
Hensher, D. A., Rose, J. M., & Greene, W. H. (2005). Applied choice analysis: a primer: Cambridge University Press.
Houkamau, C. A., & Sibley, C. G. (2010). The Multi-Dimensional Model of Maori Identity and Cultural Engagement. New Zealand Journal of Psychology, 39, 8–28.
Kerr, G. N., & Sharp, B. M. H. (2003). Community mitigation preferences: a choice modelling study of Auckland streams (256). Canterbury, New Zealand: Lincoln University: Agribusiness and Economics Research Unit.
Kerr, G. N., & Swaffield, S. R. (2007). Amenity Values of Spring Fed Streams and Rivers in Canterbury, New Zealand: A Methodological Exploration (289). Canterbury, New Zealand Agribusiness and Economics Research Unit: Lincoln University.
Lambert, R., Saunders, L., & Williams, T. (1992). Cultural sensitivity of the contingent valuation method (41). Canterbury, New Zealand: Lincoln University: Centre for Resource Management.
Mallawaarachchi, T., Blamey, R. K., Morrison, M. D., Johnson, A. K., & Bennett, J. W. (2001). Community values for environmental protection in a cane farming catchment in Northern Australia: A choice modelling study. Journal of Environmental
Management 62(3), 301-316.
Marsh, D. (2010). Water Resources Management in New Zealand: Jobs or Algal Blooms Symposium conducted at the meeting of the New Zealand Association of Economists, Auckland.
Mayer, F. S., & Frantz, C. M. (2004). The connectedness to nature scale: A measure of individuals' feeling in community with nature. Journal of Environmental Psychology, 24(4), 503-515.
Meredith, P. (1998). Seeing the “Maori Subject”: Some Discussion Points. In A. Mikaere & S. Milroy (Eds.), Ki te ao mārama: tenth anniversary hui-ātau: conference proceedings (pp. 36–45). Hamilton: Maori Law Society.
Ministry for the Environment. (2004). Water Programme of Action: Water Allocation and Use (561). Wellington, New Zealand: Ministry for the Environment.
Ministry of Education. (2011). Provider-based Equivalent Full-time Students: Domestic Equivalent full-time student units (EFTS) by ethnic group, age group, gender and sub-sector 2010 [Education Counts: Tertiary statistical database].
http://www.educationcounts.govt.nz/statistics/tertiary_education/participation
Panelli, R., & Tipa, G. (2007). Placing well-being: a Maori case study of cultural and environmental specificity. EcoHealth, 4(4), 445-460.
Rolfe, J., Blamey, R., & Bennett, J. (2000). Valuing the preservation of rangelands: Tree clearing in the desert uplands region of Queensland. The Rangeland Journal, 22(2), 205-219.
Australia; and the Colorado River, USA. Symposium conducted at the meeting of the Australian Agricultural and Resource Economics Society, 2009 Conference (53rd), Cairns, Australia.
Stevenson, B. (2004). Te Hoe Nuku Roa: A measure of Maori cultural identity. He Pukenga Korero, 8(1), 37-45.
Te Hoe Nuku Roa (Ed.). (1996). Mäori profiles: an integrated approach to policy and planning. Palmerston North: Massey University.
Tipa, G., & Teirney, L. D. (2006). A Cultural Health Index for Streams and Waterways: A tool for nationwide use (710). Wellington, New Zealand: Ministry for the
Environment.
Townsend, C. R., Tipa, G., Teirney, L. D., & Niyogi, D. K. (2004). Development of a tool to facilitate participation of Maori in the management of stream and river health.
EcoHealth, 1(2), 184-195.
Venn, T. J., & Quiggin, J. (2007). Accommodating indigenous cultural heritage values in resource assessment: Cape York Peninsula and the Murray-Darling Basin, Australia. Ecological Economics, 61(2-3), 334-344.
Waikato Regional Council. (2011). One Waikato Many Communities: 2010/11 Annual Report. Hamilton; New Zealand: Waikato Regional Council.
Weigel, R., & Weigel, J. (1978). Environmental concern: The development of a measure. Environment and Behavior, 10(1), 3-15.
Appendicies
Appendix 1 - Adapted Māori Cultural Identity (MCI) Scale
Strongly agree
Agree Neutral Disagree Strongly disagree
1. I have an in depth knowledge of my Māori ancestry (Whakapapa)
⃝ ⃝ ⃝ ⃝ ⃝
2. My involvement with my whānau plays a very
large part in my life ⃝ ⃝ ⃝ ⃝ ⃝
3. I support the reclamation and retention of Māori land
⃝ ⃝ ⃝ ⃝ ⃝
4. I am fluent in Te Reo Māori ⃝ ⃝ ⃝ ⃝ ⃝
5. I often gather, hunt and collect kai for myself,
my whānau, or my friends ⃝ ⃝ ⃝ ⃝ ⃝
6. Most of my friends and contacts are Māori ⃝ ⃝ ⃝ ⃝ ⃝
7. I frequently visit Marae ⃝ ⃝ ⃝ ⃝ ⃝
8. Māori values such as Manaakitanga, Whanaungatanga, Kaitiakitanga and Rangatiritanga are important to me and influence how I live my own life
⃝ ⃝ ⃝ ⃝ ⃝
9. I believe that as Māori, we are interconnected with the land, with each other and with our ancestors
⃝ ⃝ ⃝ ⃝ ⃝
10. Tapu, taonga and mauri are fundamental to my beliefs
⃝ ⃝ ⃝ ⃝ ⃝
11. My ancestry and my identity as Māori are very
important to me ⃝ ⃝ ⃝ ⃝ ⃝
12. I try to involve myself in Māori culture whenever I get the opportunity
Appendix 2 - Connectedness to Nature Scale (CNS) developed by Mayer and Frantz (2004)
Strongly agree
Agree Neutral Disagree Strongly disagree
1. I often feel a sense of oneness with the natural world
⃝ ⃝ ⃝ ⃝ ⃝
2. I think of the natural world as a community to which I belong
⃝ ⃝ ⃝ ⃝ ⃝
3. I recognise and appreciate the intelligence of other living organisms
⃝ ⃝ ⃝ ⃝ ⃝
4. I often feel disconnected from nature ⃝ ⃝ ⃝ ⃝ ⃝
5. When I think of my life, I imagine myself to be a part of a larger cyclical process of living
⃝ ⃝ ⃝ ⃝ ⃝
6. I often feel a kinship with animals and plants ⃝ ⃝ ⃝ ⃝ ⃝
7. I feel as though I belong to the earth as equally as it belongs to me
⃝ ⃝ ⃝ ⃝ ⃝
8. I have a deep understanding of how my actions affect the natural world
⃝ ⃝ ⃝ ⃝ ⃝
9. I often feel a part of the web of life ⃝ ⃝ ⃝ ⃝ ⃝
10. I feel that all inhabitants of Earth, human, and
nonhuman, share a common ‘life force’ ⃝ ⃝ ⃝ ⃝ ⃝
11. Like a tree can be a part of a forest, I feel embedded within the broader natural world
⃝ ⃝ ⃝ ⃝ ⃝
12. When I think of my place on Earth, I consider myself to be a top member of a hierarchy that exists in nature
⃝ ⃝ ⃝ ⃝ ⃝
13. I often feel like I am only a small part of the natural world around me, and that I am no more important than the grass on the ground or the birds in the trees
⃝ ⃝ ⃝ ⃝ ⃝
14. My personal welfare is independent of the welfare of the natural world
Appendix 3 – Choice model attributes and levels
Riverbank vegetation
1. Unhealthy Riverbank Vegetation
Little to no vegetation on the riverbank. Sparse woody trees, dominated by exotic grass
2. Moderately Healthy Riverbank Vegetation
Moderate cover of vegetation scattered on the riverbank. A range of exotic and native grasses and woody vegetation
3. Healthy Riverbank Vegetation Abundant and dense cover of vegetation on the riverbank. A diverse range of native grasses, shrubs and woody vegetation
Water clarity
1. Poor Water Clarity You can see less than 1m underwater
2. Good Water Clarity You can see more than 4m underwater
Water quality
1. Low Water Quality Unsafe for drinking, swimming or fishing
2. Moderate Water Quality Safe for fishing and swimming, unsafe for drinking
3. High Water Quality Safe for fishing, swimming and drinking
Ecosystem Health
1. Unhealthy Ecosystem Few large fish, shellfish, birds, and aquatic plants. Small eels may still be present and algal blooms are possible
2. Moderately Healthy Ecosystem
Some species of fish, shellfish, birds and aquatic plants are present in moderate abundance. Small fish and eels are present. Hard to find shellfish
3. Healthy Ecosystem Abundant and diverse species of fish, shellfish, birds and aquatic plants. No risk of algae
Jobs
1. 50 Fewer Jobs Available There are fewer local jobs available in the area
2. No Change The total number of jobs in the region is unaffected
3. 50 More Jobs Available There are more local jobs available in the area
Loss of income to the region
1. $5 Million Increase Growth of the regional economy by $5 million per year
2. No Change The regional economy is unaffected