University of Pennsylvania
ScholarlyCommons
Publicly Accessible Penn Dissertations
1-1-2014
Not All Types of Delay are Equal: Postsecondary
Delay in the U.S. and Taking a Gap Year
Nina DePena Hoe
University of Pennsylvania, [email protected]
Follow this and additional works at:http://repository.upenn.edu/edissertations
Part of theHigher Education Administration Commons,Higher Education and Teaching Commons, and theInternational Relations Commons
This paper is posted at ScholarlyCommons.http://repository.upenn.edu/edissertations/1313 For more information, please [email protected].
Recommended Citation
Hoe, Nina DePena, "Not All Types of Delay are Equal: Postsecondary Delay in the U.S. and Taking a Gap Year" (2014).Publicly Accessible Penn Dissertations. 1313.
Not All Types of Delay are Equal: Postsecondary Delay in the U.S. and
Taking a Gap Year
Abstract
Postsecondary delay in the U.S. is a topic that has generated interest in the field of higher education in recent decades. Seventeen percent of U.S. students under the age of 24 who began their postsecondary education in 2004 delayed their entrance for some period of time. At the national level, studies have indicated that students who delay are not only at a disadvantage in terms of their pre-college experiences, including lower
socioeconomic status and lower levels of academic preparation and achievement, but also are less likely to enroll in a baccalaureate granting institution and complete a bachelor's degree. Another vein of higher education research, supplemented by promotion from popular media, has reported a host of positive effects associated with delaying specifically for a "gap year," or an intentional, one-year delay for the purpose of personal growth and learning, including travel, work and/or service work. Although gap year students have been reported to come from privileged backgrounds, this type of delay has been associated with higher academic performance and increased maturity in college. Consequently, there remains a significant disconnect in the literature that would explain how the reported positive effects of delaying college specifically for a gap year co-occur with negative effects found to be associated with delaying postsecondary education in general, observed on a national level.
This dissertation is comprised of three papers that focus on different aspects of postsecondary delay in the U.S. The first paper utilizes a large-scale national data set to describe the delay practices of students in the U.S., paying particular attention to the reasons students choose to delay and how different types of students delay for different reasons. This paper also identifies students' pre-college characteristics that predict delay choice. Findings show that there is considerable variation in student characteristics associated with different delay reasons. The second paper uses propensity score matching to create matched samples of students who delay for different reasons and immediate enrollers, to examine how the effects of delaying vary by students' reasons for delaying. The results indicate that when all other factors are equal, delaying for travel as compared to delaying but not for travel has a positive effect on students' academic outcomes and measures of civic
engagement six years after starting postsecondary education. Specifically addressing the finding that travel has a positive effect during a delay, the third paper offers findings from interviews of students participating in gap year programs in Ecuador in order to examine the nature of their experiences.
This study contributes to existing literature and the field of higher education by disaggregating postsecondary delay in the U.S. and examining the students and outcomes associated with delaying for different reasons. In addition, this study expands existing frameworks for understanding both the delay and gap year choice processes and how delay and specifically gap year experiences may serve in supporting, student success, overall well-being and development.
Degree Type
Dissertation
Degree Name
Doctor of Philosophy (PhD)
Graduate Group
Education
First Advisor
Janine T. Remillard
Keywords
bridge year, delay, gap year, Global Citizen Year, higher education, postsecondary delay
Subject Categories
Education | Higher Education Administration | Higher Education and Teaching | International Relations
NOT ALL TYPES OF DELAY ARE EQUAL:
POSTSECONDARY DELAY IN THE U.S. AND TAKING A GAP YEAR
Nina DePena Hoe
A DISSERTATION
in
Education
Presented to the Faculties of the University of Pennsylvania
in
Partial Fulfillment of the Requirements for the
Degree of Doctor of Philosophy
2014
Supervisor of Dissertation:
_________________________________________ Janine T. Remillard, Associate Professor of Education
Graduate Group Chairperson:
_________________________________________ Stanton E. F. Wortham, Professor of Education
Dissertation Committee:
Janine T. Remillard, Associate Professor of Education
Laura W. Perna, Professor of Education
NOT ALL TYPES OF DELAY ARE EQUAL: POSTSECONDARY DELAY IN THE
U.S. AND TAKING A GAP YEAR
COPYRIGHT
2014
iii
DEDICATION
This work is dedicated to my parents, Barbara and Bob Hoe, who always supported my
iv
ACKNOWLEDGEMENTS
Getting to this point feels like nothing shy of a miracle. I feel incredibly fortunate
to have received so much support along the way from many wonderful people.
Talar, you are the best graduate school best friend anyone could ask for. Above all
– thank you for the laughs and answering calls and emails of desperation at all the right
times. We met on the very first day of it all… and little did I know. We did this all
together – from co-writing papers in ECS, first-year exams, comps, proposals, our
dissertations and all of the great things in between; I can’t express how much having you
as a partner at every step has meant. For your phenomenal editing skills, advising
capabilities, dedoosing habits, humor, rationality, generosity, and your attempt to keep
me on-time and on-task – I am forever grateful. I look forward to continuing this
relationship throughout our personal and professional lives.
Edith, your generosity overwhelms me. I am forever indebted to the time and
energy (and mole) you gave to me during this process. You are going to be the best
professor and advisor in the world – I have learned so much from you. Paper 2, we did
together. And Rachel, my first academic friend – thank you for always being a source of
truly valued feedback and advice, and for giving me confidence in my work – no matter
where we happen to be around the globe.
Mom, Dad, Victoria and Anna – what a truly amazing family you are, and I would
not be at this point without your dailysupport. Through this process, you have endured
thousands of hours of phone calls, and have done everything from listening to my ideas
and struggles, to giving me feedback and carefully editing chapters. Thank you for your
v always believing in me. I am eternally grateful for you all. I also want to remember
Grammy Alice, who inspired my love for learning, stories, and hard work.
I am thankful for my wonderful friends here in Philadelphia who provided me
with much needed comic relief and delicious meals over the past few years – Amanda,
our Thursday run-dinners are the best tradition; Jesse – thank you for walks, runs and
hours of coffee shop support time even when you didn’t have work to do; and Sofia – my
hslp, gym buddy, and chef – I cannot imagine daily life without you; IES crew and
endless entertainment from Jamey DOONE, Claire, and Jess; and others who have been
so important during the past years – Kate, my ski, bike, and cook partner; Luke, my
secretary; Emily, my dissertation buddy; Eduardo, my work coach; Katie, Matt, and all
others from my starting cohort. I’m also grateful for my wonderful friends outside of
Philadelphia that have all played a part in getting me to this point. – Julia and Kate,
Linny, Cacy; and Colorado friends, for the adventures and hospitality – Bre, Polly,
Emmy, Melissa, Molly, Kat, and Stoney. And, Greg, you were instrumental in this entire
process. Also, I am appreciative of the faculty and students at the University of Colorado
– Boulder who welcomed me into their academic community last year, and to my dear
Aunt Kathleen who provided the best dissertation writing retreat imaginable.
Janine, thank you for taking me under your wing when I was a master’s student,
and supporting me through the evolution of my work over the past five years. I have
learned so much from you on many levels. Laura, I am grateful that you agreed to be on
my committee, and particularly for your perspectives, your lightning-fast email
responses, and for pushing me to make my papers better. Matthew, thank you for
vi very appreciative of other professors and GSE staff, without whom I would not be here –
Henry May, Becka, Lorna, Aislinn, Ameena, Rand, and Zach for years of computer and
data help. The presence of and my access to the secure data room also contributed
significantly to my productivity during this process – so thank you, Becka and NCES.
For the content of this dissertation, I am indebted to the leaders in the Gap/Bridge
Year world who allowed me to learn from their passions, ideas, goals and programs in
general. The inspiration for this work stemmed from a serendipitous connection made
through meeting with my first IES speaker, Jonah Rockoff, who connected with Abby
Falik, the Founder and CEO of Global Citizen Year. I am grateful to Abby and Shannah
and all others at Global Citizen Year, as well as Brad, Shawn, and Jo at Youth
International who allowed me to spend time with your groups in Ecuador, become part of
your teams, and think through so many important questions and issues with you all. And
to Ethan Knight and Bob Clagett who generously shared their time and ideas, and helped
me find direction.
And finally, the research reported here is supported by the Institute of Education
Sciences, U.S. Department of Education, through Grant #R305B090015 to the University
of Pennsylvania. The opinions expressed are those of the authors and do not represent the
vii
ABSTRACT
NOT ALL TYPES OF DELAY ARE EQUAL:
POSTSECONDARY DELAY IN THE U.S. AND TAKING A GAP YEAR
Nina DePena Hoe
Janine T. Remillard
Postsecondary delay in the U.S. is a topic that has generated interest in the field of
higher education in recent decades. Seventeen percent of U.S. students under the age of
24 who began their postsecondary education in 2004 delayed their entrance for some
period of time. At the national level, studies have indicated that students who delay are
not only at a disadvantage in terms of their pre-college experiences, including lower
socioeconomic status and lower levels of academic preparation and achievement, but also
are less likely to enroll in a baccalaureate granting institution and complete a bachelor’s
degree. Another vein of higher education research, supplemented by promotion from
popular media, has reported a host of positive effects associated with delaying
specifically for a “gap year,” or an intentional, one-year delay for the purpose of personal
growth and learning, including travel, work and/or service work. Although gap year
students have been reported to come from privileged backgrounds, this type of delay has
been associated with higher academic performance and increased maturity in college.
Consequently, there remains a significant disconnect in the literature that would explain
how the reported positive effects of delaying college specifically for a gap year co-occur
with negative effects found to be associated with delaying postsecondary education in
viii This dissertation is comprised of three papers that focus on different aspects of
postsecondary delay in the U.S. The first paper utilizes a large-scale national data set to
describe the delay practices of students in the U.S., paying particular attention to the
reasons students choose to delay and how different types of students delay for different
reasons. This paper also identifies students’ pre-college characteristics that predict delay
choice. Findings show that there is considerable variation in student characteristics
associated with different delay reasons. The second paper uses propensity score matching
to create matched samples of students who delay for different reasons and immediate
enrollers, to examine how the effects of delaying vary by students’ reasons for delaying.
The results indicate that when all other factors are equal, delaying for travel as compared
to delaying but not for travel has a positive effect on students’ academic outcomes and
measures of civic engagement six years after starting postsecondary education.
Specifically addressing the finding that travel has a positive effect during a delay, the
third paper offers findings from interviews of students participating in gap year programs
in Ecuador in order to examine the nature of their experiences.
This study contributes to existing literature and the field of higher education by
disaggregating postsecondary delay in the U.S. and examining the students and outcomes
associated with delaying for different reasons. In addition, this study expands existing
frameworks for understanding both the delay and gap year choice processes and how
delay and specifically gap year experiences may serve in supporting, student success,
ix
Table of Contents
ACKNOWLEDGEMENTS ... iv
ABSTRACT ... vii
INTRODUCTION TO DISSERTATION ... 1
Problem Statement... 1
Contributions to the Field ... 3
Theoretical Foundations ... 4
Research Questions and Methodology ... 4
PAPER #1 – DIFFERENTIATED DELAY: DESCRIPTIONS AND PREDICTORS OF DELAYING POSTSECONDARY EDUCATION FOR DIFFERENT REASONS ... 7
Introduction ... 7
Statement of Purpose ... 9
Guiding Frameworks ... 9
Literature Review ... 14
Postsecondary Delay at the National Level ... 15
Gap Year Experiences... 18
Summary ... 19
Research Methodology and Design ... 20
The Data ... 21
Variables ... 25
Missing Data ... 27
x
Limitations ... 31
Findings ... 32
Research Question 1: The Empirical Characteristics of Postsecondary Delay Practices ... 32
Research Question 2: Characteristics of Students Based and Delay Practices ... 35
Research Question 3: Predictors of Postsecondary Delay ... 46
Summary of Findings ... 52
Discussion... 54
Areas for Future Research ... 55
PAPER #2 – NOT ALL TYPES OF DELAY ARE EQUAL: VARIABILITY IN THE EFFECTS OF DELAYING POSTSECONDARY ... 58
Introduction ... 58
Statement of Purpose ... 60
Guiding Frameworks ... 60
Theoretical Framework ... 61
Conceptual Framework ... 63
Literature Review ... 64
Postsecondary Delay at the National Level ... 65
Gap Year Experiences... 69
Summary ... 70
Research Methodology and Design ... 71
The Data ... 71
xi
Analytic Methods: Propensity Score Matching ... 81
Limitations ... 95
Findings ... 97
Research Question 1: The Effects of Delay on First-year Enrollment Choices and Educational Expectations ... 98
Research Question 2: The Effects of Delay on Academic Performance, Educational Satisfaction, and Civic Engagement ... 100
Summary of Findings ... 111
Discussion... 113
The Academic Effects of Delay ... 113
Delay Reasons ... 116
Identifying “Gap Year” Delayers ... 118
Delay Decision Timing ... 119
Additional Limitations... 119
Recommendations for Postsecondary Practices ... 120
Areas for Further Research ... 122
PAPER #3 – WHAT’S IN A GAP?: WHY AMERICAN YOUTH PARTICIPATE IN A GAP YEAR AND HOW THEY BENEFIT AS INDIVIDUALS ... 124
Introduction ... 124
Statement of Purpose ... 127
Gap Year Activities and Experiences ... 128
xii
Student College Choice... 129
Pre-College Experiences ... 134
Conceptual Framework ... 139
Review of the Literature ... 140
Gap Year Participants ... 141
Motivations for Taking a Gap Year ... 141
Benefits of a Gap Year ... 143
Critiques of Gap Years... 149
Summary and Shortcomings in the Literature ... 150
Methodology ... 151
Sources of Data ... 151
Data Collection ... 155
Design Rationale ... 156
Methods of Analysis ... 157
Limitations ... 159
Findings ... 160
Research Question 1: The Gap Year Choice Process ... 160
Research Question 2: Gap Year Experiences ... 169
Research Questions 3 and 4: Effects of Gap Year Experiences ... 176
Discussion... 191
Contributions to Existing Frameworks ... 191
Additional Contributions ... 193
xiii
Implications for Gap Year Delay Practices ... 196
Areas for Further Research ... 197
CONCLUSION TO THREE PAPER DISSERTATION ... 199
Primary Conclusions ... 199
Delayers Are Different From Immediate Enrollers ... 200
Not All Types of Delay are Equal... 201
Delaying for Travel is Precipitated by and Leads to Gains in Particular Attitudes, Behaviors, and Forms of Capital ... 203
Limitations ... 205
Contributions of this Study ... 208
Recommendations for Future Research ... 210
Recommendations for Postsecondary Delay Practices ... 213
Appendix A ... 217
Appendix B ... 220
Appendix C ... 221
Appendix D ... 223
Appendix E ... 224
Appendix F ... 225
xiv
List of Tables
Table 1. Unweighted and Weighted Sample Counts for Selection Criteria and
Resultant Analytic Samples ... 24
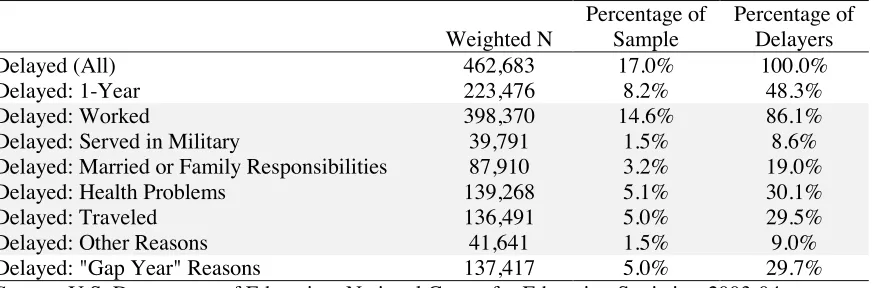
Table 2. Distribution of Delayers by Reason Among 2003-2004 First-Time- Beginners ... 33
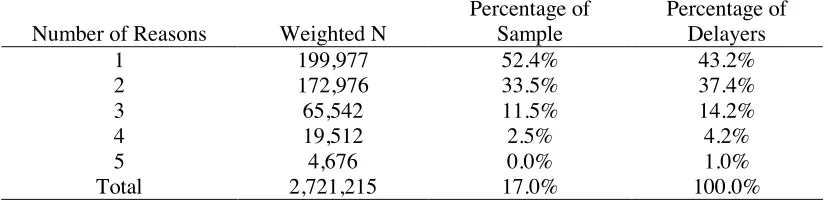
Table 3. Number of Reasons Indicated for Delaying Among 2003-2004 First-Time-Beginners ... 34
Table 4. Most Common Delayer Profiles Among 2003-2004 First-Time-Beginners .... 34
Table 5. Average Number of Years Spent Delaying for 2003-04 FTBs Younger Than 24 ... 37
Table 6. Characteristics of Students Based on Delay Behavior... 40
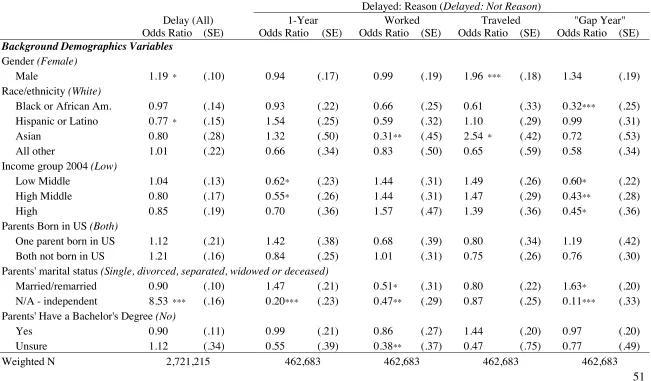
Table 7. Predictors of Delaying as Compared to Not Delaying and Among Delayers, Predictors of Delaying for Different Reasons (Weighted) ... 50
Table 8. Unweighted and Weighted Sample Counts for Selection Criteria and Resultant Analytic Samples ... 75
Table 9. Distribution of Sample Along Delay Characteristics ... 82
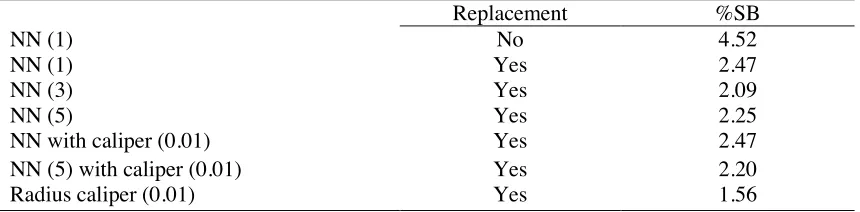
Table 10. Exploring Matching Methods to Improve Balance. ... 88
Table 11. Caliper Radius (.01) Matching Statistics for All Match Pairs ... 90
Table 12. Odds Ratios from Propensity Score Matching and Logistic Regression to Predict First-Year Enrollment Choices ... 106
xv Table 14. Coefficients Odds Ratios from Pre-College and Enrollment Characteristic
Propensity Score Matching and Logistic Regression to Predict Academic
Outcomes ... 108
Table 15. Odds Ratios from Pre-College Characteristic Propensity Score Matching and Logistic Regression to Predict Educational Satisfaction and Civic Engagement Outcomes ... 109
Table 16. Odds Ratios from Pre-College and Enrollment Characteristic Propensity Score Matching and Logistic Regression to Predict Educational Satisfaction and Civic Engagement Outcomes ... 110
Table 17. Sample Characteristics ... 155
Table 18. Participant Reported Reasons For Taking a Gap Year ... 161
Table 19. Intended Gap Year Program Experiences ... 170
Table 20. Participant Reported Experiences Had During a Gap Year ... 171
xvi
List of Figures
Figure 1. Expanding Perna’s (2006) Conceptual Model for Student College Choice ... 14
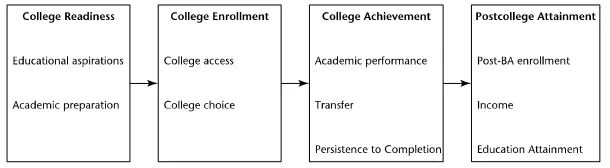
Figure 2. Perna and Thomas’s (2008) “Transitions and Indicators of Student Success” . 61
Figure 3. Kernal Density Plot of Propensity Scores of Delayers (Treated) and Immediate
Enrollers (Non-treated) for the Entire Sample ... 91
Figure 4. Kernal Density Plot of Propensity Scores of Delayers (Treated) and Immediate
Enrollers (Untreated) for the Matched Sample (Weighted) ... 92
Figure 5. Expanding college choice in Perna's (2006) proposed conceptual model. ... 134
1
INTRODUCTION TO DISSERTATION
The implications of delaying postsecondary education have generated substantial
interest in the field of higher education in recent decades. Postsecondary enrollment
behavior as well as success (Adelman, 2006; Bozick & DeLuca, 2005). “Gap years” (a
specific type of postsecondary delay) have also generated interest among popular media
sources, academic scholars, and prestigious institutions. In particular, the potential
contributions of a gap year to college readiness and college success are often promoted
(Bull, 2006; O'Shea, 2013). In this dissertation, I define a gap year1 as an intentional,
one-year delay of postsecondary education for the purpose of personal growth and
learning, often including travel, work and/or service. The three papers that follow tease
apart some of the more nuanced aspects of delay occurring at the national level, and draw
attention to the unique experiences and effects of gap years that question the more widely
accepted understandings about postsecondary delay in general.
Problem Statement
At the national level, postsecondary delay in general has been fairly well
monitored. Studies that utilize nationally representative data have consistently found that
students who delay are from lower income backgrounds and have lower levels of
academic preparation and achievement when compared to their peers who enroll
immediately (Carroll, 1989; Goldrick-Rab, 2010; Horn, Forrest-Cataldi, & Sikora, 2005).
For these populations, delaying has been associated with a lower likelihood of entering a
four-year, degree granting institution and with decreased chances of bachelor’s degree
1
2 attainment (Adelman, 2006; Bozick & DeLuca, 2005).
On the other hand, gap year-specific delay trends and outcomes have been
monitored to a lesser extent. In large part due to the ambiguity of the definition and the
relatively small proportion of individuals participating, there is presently no source of
data in the U.S. that has captured the population of gap year participants or their
outcomes. Also, of the existing peer-reviewed studies, which are limited to approximately
ten single-program or institution studies, only one focuses on U.S. students, and few have
included sample sizes of greater than 30 (O'Shea, 2011b; Spenader, 2011). As far as
research findings, gap year participants in the U.K. and Australia have been reported to
be predominantly white, females, without disabilities, from middle-class backgrounds
who attended private secondary schools (Birch & Miller, 2007; Horn et al., 2005; Jones,
2004; King, 2011; Martin, 2010). The outcomes associated with gap year delays are also
different from those for delay in general. Academic scholars and media sources have
identified positive effects associated with gap year participation related to language
development, personal growth, and college and career attainment (Birch & Miller, 2007;
King, 2011; Knight, 2014; Martin, 2010; O'Shea, 2011b; Stehlik, 2010).
Some studies have suggested that students’ backgrounds and high school
academic characteristics (Bourdieu, 1973; Lareau, 2011) may be driving factors in the
observed differences in delay effects across student groups (Goldrick-Rab, 2010). There
is concern that students from higher income backgrounds may have access to delay
activities that contribute to positive effects, which are not available to those from lower
income backgrounds. Another possibility is that particular delay activities have little
3 students’ pre college experiences. Either way, delay may thereby be understood as a form
of social and cultural reproduction, where low-income students see negative outcomes
after a delay, while middle- and high-income students experience positive outcomes.
However, at the present time, these relationships are not well understood.
Contributions to the Field
Examining the larger picture of postsecondary delay practices in the U.S., there is
significant variation in findings related to the characteristics of students who delay and
the associated outcomes. This study is motivated by five primary gaps in the literature
that would help to explain these disparities. First, no attention has been paid to the myriad
of reasons for which students delay. Second, all previous national studies have examined
delay as a uniform phenomenon and treated all delayers as a homogenous group.
Consequently, there is no understanding of how different types of students delay for
different reasons. Third, no studies have examined how delay outcomes vary with respect
to the reason for the delay. Fourth, prior research has not examined gap year delays in
relationship to delay, broadly. Finally, it is unclear how particular elements of delay
experiences reported by participants, the media, and researchers to be positive may be
operating to benefit students academically, personally, or in any other ways. As a result,
delay overall may be preemptively or unjustifiably characterized negatively due to this
lack of differentiation.
As college counselors, mentors, parents, and teachers think about how to best
guide students in making choices about if and how to delay, a comprehensive
understanding of the effects of delaying for different reasons is critical. Each year, U.S.
4 National data show that approximately 30% of entering postsecondary students delay for
some period of time (BPS:04/09). In addition, as the effects of delaying become better
understood, there is an emerging need to identify the types of students that are more
likely to delay for different reasons, as well as the student characteristics that predict
different delay choices.
Theoretical Foundations
This dissertation’s three papers investigate two distinct processes: student delay
choice and student success in the context of delay experiences. Several established
conceptual frameworks guide these studies. In particular, to understand the choice to
delay and participate in a gap year, this study draws on Perna’s (2006) proposed
conceptual model of student college choice. Second, this study draws on Kuh’s (2006)
and Perna and Thomas’s (2008) theories of student success that connect pre-college
experiences to post-college outcomes in examining the implications of gap year
experiences for youth as they move forward in their lives, particularly into college. While
these models were conceptualized for college choice and success without delay in mind,
the findings from this study contribute to these conceptualizations, suggesting ways in
which they may need to be expanded when considering delay.
Research Questions and Methodology
This dissertation questions the assumption that all delay is the same and that the
group of delaying students is homogenous and distinctly different from their peers who
enroll immediately. Multiple sources of data and methods of analysis are employed
across these three papers. The first two papers utilize nationally representative data from
5 National Center for Education Statistics (NCES) of the Department of Education to
disaggregate postsecondary delay practices by delay reason. A joint goal of the first two
papers is to identify the group of students taking a “gap year” within the national sample.
The first two papers make comparisons between different types of delayers and
immediate enrollers, as well as among different types of delayers (including those
hypothesized to be delaying for a “gap year”). The first paper uses descriptive statistics,
cross-tabulations, chi-square tests, and linear regression to describe delay practices and
the student characteristics associated with different types of delay. Additionally, logistic
regression models are used to identify the student characteristics that predict delaying for
different reasons.
The second paper uses propensity score matching to create matched samples of
delayers and immediate enrollers. Based on the propensity scores, linear, logistic, and
multinomial logistic regressions are used to estimate the causal effects of delaying for
different reasons on students’ enrollment choices and educational expectations, as well as
on measures of academic performance, educational satisfaction, and civic engagement.
Students’ enrollment choices and academic performance outcomes were chosen because
they are common indicators of “student success” (Perna & Thomas, 2008), while the
other indicators were selected to address some of the reported effects of gap year
experiences (Haigler & Nelson, 2013; O'Shea, 2013).
The third paper is an attempt to better understand findings from the first two
papers regarding the positive effects of travel-related delay, as compared to other types of
delay, on measures of academic performance and civic engagement. Here, gap year
6 paper takes a qualitative, and specifically phenomenological approach to understanding
the reasons American youth choose to take a gap year, the participant-reported effects of
taking a gap year, and the critical elements of gap year and travel-related delay that
contribute to positive experiences. This study uses data from semi-structured, in-depth
interviews and focus groups, as well as survey responses of a total of 42 gap year
participants and staff members in three different international gap year programs
operating in Ecuador during the fall of 2013. The purpose of the third paper is to describe
the gap year choice process, gap year experiences, and identify valuable elements of gap
year experiences that may be replicated in other settings in order to provide advantageous
opportunities for a broader group of youth.
The three papers that comprise this dissertation speak to various elements of
postsecondary delay in the U.S. that are presently unexplored and disconnected. No other
identified study examined delay with respect to reason, or situated gap year delay in the
larger delay context. The collective papers here are meant to serve as a resource for
multiple constituents. Primarily, findings from this study can inform students, parents,
and college advisors with respect to decisions related to college enrollment timing.
Second, for those involved in making decisions about and structuring delay experiences
(e.g., youth support services and program directors), the identification of particular
activities that are linked to positive outcomes will help to these opportunities more
accessible to a diverse group of students. Finally, within the academic research
community, this dissertation contributes to and expands existing frameworks for
7
PAPER #1 – DIFFERENTIATED DELAY: DESCRIPTIONS AND PREDICTORS
OF DELAYING POSTSECONDARY EDUCATION FOR DIFFERENT REASONS
Introduction
Postsecondary delay in the United States is a topic that has generated interest in
the field of higher education in recent decades. Postsecondary delay has been identified
as a critical factor in predicting postsecondary enrollment behavior as well as success
(Adelman, 2006; Bozick & DeLuca, 2005). While there is some variation annually, my
analyses of the Beginning Postsecondary Students Longitudinal Study (BPS:04/09) from
the National Center for Education Statistics (NCES) of the Department of Education
show that within the last decade, approximately 30% of entering postsecondary students,
and 20% of those under the age of 24, delayed their entrance for some period of time.
Over the past 25 years, there have been several efforts to identify and describe the
characteristics of students who delay their postsecondary education (Carroll, 1989; Horn
et al., 2005). Additionally, a handful of studies have examined postsecondary enrollment
patterns and academic outcomes associated with delaying (Adelman, 2006; Bozick &
DeLuca, 2005). Studies that utilize nationally representative data have consistently found
that students who delay are from lower income backgrounds and have lower levels of
academic preparation and achievement when compared to their peers who enroll
immediately (Carroll, 1989; Goldrick-Rab, 2010; Horn et al., 2005). Delaying has also
been associated with a lower likelihood of entering a four-year, degree granting
institution and with decreased chances of bachelor’s degree attainment (Adelman, 2006;
Bozick & DeLuca, 2005). However, in all of these studies, delay has been examined as a
8 been paid to the myriad of reasons for which students delay or how different types of
students may be delaying in different ways.
Another vein of higher education research has focused on a specific group of
students delaying for a gap year, and the positive effects associated with this particular
type of delay (Martin, 2010; O'Shea, 2011; Spenader, 2011). Defined here, a gap year is a
one-year delay of postsecondary education for the purpose of personal growth and
learning, often including travel, work and/or service. The topic of a gap year has
generated substantial interest among popular media sources, academic scholars, and
prestigious institutions in the U.S. in recent years. Although no empirical study has
examined the population of gap year takers, they have been described as a fairly
homogenous group, with middle-class, white females over represented (Birch & Miller,
2007; Goldrick-Rab & Han, 2011; King, 2011a; Martin, 2010). Several peer-reviewed
studies focusing on students in the U.K. and Australia have shown that students who have
taken a gap year experience a host of personal benefits (Coetzee & Bester, 2009; Heath,
2007; King, 2011; O'Shea, 2011b), higher levels of motivation after their gap year
(Martin, 2010) and higher academic performance in college (Birch & Miller, 2007).
Despite these studies, there has been no examination of how students differ based
on their reasons for delaying, and in particular, how “gap year” delayers compare to other
types of delayers. Further, there remains a disconnect in the literature that would explain
how the reported positive effects of delaying college specifically for a gap year co-occur
with negative effects of delaying postsecondary education. To address this knowledge
gap, this study examines different student groups and the variety of ways in which they
9
Statement of Purpose
This study has several distinct purposes and areas of contribution. This study
examines the assumption that all delay is the same and that the group of delaying students
is homogenous. Disaggregating national postsecondary delay practices by delay reason,
three central deficits in the current understanding of delay are addressed. To begin, this
study presents an overview of postsecondary delay practices in the U.S. with a national
sample of students beginning postsecondary education for the first time in 2003-04.
Second, this study describes students by the reason for their delay, based upon their
pre-college characteristics including demographics, family background and measures of
academic preparation and achievement. Finally, this study identifies the pre-college
characteristics that predict delay, and specifically different types of delay. An additional
goal of this study is to identify the group of students taking a “gap year” within the
national sample. This study contributes to existing literature on postsecondary delay by
exploring variation in delay practices and provides a critical foundation for a more
detailed examination of the effects associated with delaying for different reasons, which
is the topic of the next paper in this dissertation.
Guiding Frameworks
This study tests the applicability of Perna’s (2006) proposed conceptual model for
student college choice in examining the choice to delay entrance to postsecondary
education for different reasons. College student decision has been examined by a variety
of scholars, drawing mainly from economic and social theory. From the economic
perspective, Becker’s (1993) theory of human capital assumes that choices or investments
10 “education and training are the most important investments in human capital” (p. 17).
Scholars have utilized this theory to posit that students, along with their parents,
undertake a cost-benefit analysis when making the college choice (Manski & Wise,
1983). The short- and long-term benefits of higher education to both individuals and
society are widely publicized and promoted (Baum, Ma, & Payea, 2010; Becker, 1993;
Perna, 2005). Short-term benefits include the academic, social, and cultural experiences
of college, such as learning for enjoyment, participating in events, and increasing social
status as well as lower initial unemployment rates (Perna, 2005). Over the longer-term,
college graduates can expect to see significantly higher earnings, full-time year-round
work, comprehensive health insurance, pension plans, and greater civic participation
(Baum et al., 2010; Bourdieu, 1986). Economists have consistently shown a jump in
earnings with attainment of a bachelor’s degree (Baum et al., 2010) Education has also
been shown to have positive effects on health, civic engagement, and appreciation of
culture (Becker, 1993). The costs associated with college enrollment include the
monetary aspects of tuition and fees, as well as the loss of earnings and leisure time
associated with time spent enrolled in postsecondary education (Bourdieu, 1986; Perna,
2005). Economic theory views college choice as a result of weighing of these costs and
benefits.
Sociological theory, and specifically Bourdieu’s (1986) theory of cultural and
social capital, argues that one’s background characteristics contribute to one’s agency in
the decision-making process. Social capital is defined as “the aggregate of the actual or
potential resources which are linked to possession of a durable network of more or less
11 to membership in a group” (Bourdieu, 1986, p. 51). Bourdieu (1986) argues that various
forms of capital can be exchanged to acquire other forms of capital and used to one’s
benefit. Thus, social capital is the relationships, connections and social networks that
allow individuals to gain access to cultural and economic capital. Cultural capital is
divided into three types: embodied, objectified, and institutional. Bourdieu (1996) defines
embodied cultural capital as the “long-lasting dispositions of the mind or body” or “the
work of acquisition is work on oneself (self-improvement).” Physical goods or
possessions such as “pictures, books, dictionaries, instruments, machines, etc.,” are
examples of objectified cultural capital. Finally, institutional capital is akin to academic
credentials and institutional reputation and recognition (Bourdieu, 1986). Drawing
heavily on this framework, Lareau (2011) showed that social class is significantly related
to the choices that parents make with respect to raising their children and determining
their educational trajectories. Specifically, she found that middle-class families were able
to leverage both financial and knowledge-based resources in order to make institutional
and enrollment decisions about high school and college in distinctly different ways from
working-class families (Lareau, 2011).
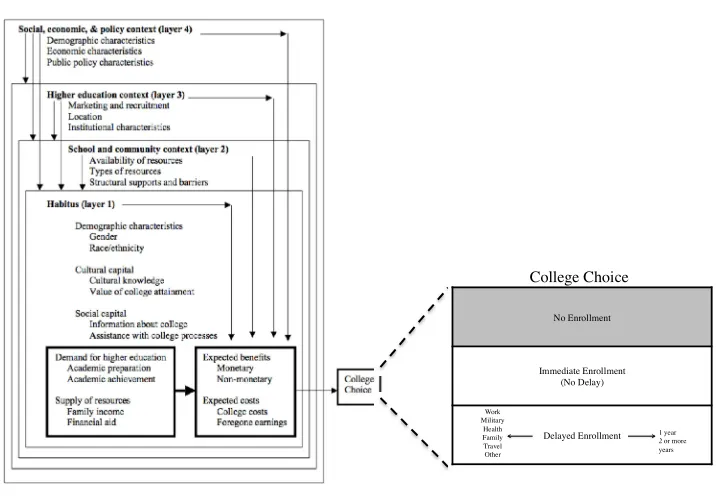
In her proposed conceptual model of student college choice, Perna (2006) (see
Figure 1) argues that individually, both the economic and social theories lack in their
ability to fully explain both the cost-benefit analysis undertaken by students in the
college-choice process and the ways in which social and cultural factors influence
individuals’ considerations of criteria for making this decision. For this reason, her model
integrates both perspectives, and serves as a framework for understanding differences in
12 upbringings. Perna (2006) argues that the college choice process is situated within four
contextual layers: (1) the social, economic, and policy context, (2) the higher education
context, (3) the school and community context, and (4) the habitus. This nested model’s
inward orientation specifies that each of outer layers influences each of the successive
inner layers, which all contribute to college choice.
At its core, individuals’ college choice is informed by students’ habitus
(Bourdieu, 1986), which Perna (2006) defines as, “an individual’s internalized system of
thoughts, beliefs, and perceptions that are acquired from the immediate environment” (p.
113). She argues that the habitus also “conditions an individual’s college-related
expectations, attitudes, and aspirations” (Perna, 2006, p. 113). The habitus is related to
individuals’ demographic characteristics and forms of cultural and social capital
(Bourdieu, 1986; Coleman, 1988; Lareau, 2011), their human capital, in terms of
academic preparation and achievement, and economic capital in terms family income and
financial aid. These elements, along with the outer three contextual layers, directly
influence the final cost-benefit analysis. Perna’s (2006) model posits that students’
college-related decisions are deeply informed by their habitus; students with different
thoughts, beliefs, and perceptions about college and its cost and benefits will make
decisions differently from one another.
In the second layer of Perna’s (2006) proposed model, the school and community
context comprises the types and availability of resources at the students’ sending school
as well as the structural supports and barriers. Drawing on McDonough’s (1997) theory
13 “institutional agents,” the school and community context suppose that social relationships
and structures inform student college choice both positively and negatively.
The higher education context makes up the third layer, encompassing specific
institutional characteristics and location, as well as the institutions’ marketing and
recruitment strategies. Finally, the social, economic, and policy context frame the entire
process and include the demographic, economic, and public policy characteristics of the
state and national in which students live (Perna, 2006). All of these contexts and variables
comprise, what I refer to as, students’ “pre-college” characteristics (also see Kuh, 2006).
College choice has typically been understood as a decision of whether or not to
enroll, and then subsequently, a decision about where and how to enroll (e.g., full- or
part-time, at a four- or two-year, public or private institution). Focusing specifically on
the first decision of whether and when to enroll, Rowan-Kenyon (2007) tested and
confirmed the application of Perna’s (2006) model to understand students’ decisions to
not enroll, enroll immediately, or delay enrollment. She concluded that Perna’s (2006)
model was appropriate for understanding student delay timing.
This study explores a conceptual model that expands Perna’s (2006) model to
understand how students’ pre-college characteristics are related to the choice of
enrollment timing, and specifically the choice to delay for different reasons. Figure 1
displays this proposed expansion of Perna’s (2006) conceptual model for student college
choice, where college choice includes no enrollment, immediate enrollment, and delayed
enrollment for different reasons and lengths of time. While these delayers also partake in
the decision of how and where to enroll, this study focuses specifically on the choice to
14
Figure 1. Expanding Perna’s (2006) Conceptual Model for Student College Choice
Literature Review
At the national level, a considerable amount is known about the characteristics of
students who delay postsecondary education and how they differ from students who enter
immediately, both in terms of their background characteristics as well as their enrollment
practices and rates of degree completion. Although not as comprehensive, there is also a
basic understanding of the types of students who participate in a gap year and outcomes
associated with their participation. However, generally these areas of research have
drawn seemingly contradictory conclusions about the types of students who delay and the
effects of delaying. Furthermore, it remains unclear as to how gap year delayers compare
and contrast with students who delay for other reasons. This section describes the major College Choice
No Enrollment
Immediate Enrollment (No Delay)
Delayed Enrollment Work
Military Health Family Travel Other
15 findings related to postsecondary delay and gap year experiences to date, and identifies
areas in need of deeper exploration.
Postsecondary Delay at the National Level
At the present time, studies related to postsecondary delay have focused on a few
key issues. Primarily, all studies have attempted to inventory the population of students
delaying as compared to their non-delaying counterparts within their respective data sets
(Adelman, 2006; Bozick & DeLuca, 2005; Carroll, 1989; Goldrick-Rab & Han, 2011;
Hearn, 1992; Horn et al., 2005; Niu & Tienda, 2013; Rowan-Kenyon, 2007). Second,
questions about the role of delay length have been raised in order to identify how student
characteristics and eventual associated outcomes vary by delay length (Horn et al., 2005;
Rowan-Kenyon, 2007). Additionally, scholars have examined the relationships between
delay and both enrollment patterns (Niu & Tienda, 2013) and college completion
(Adelman, 2006; Bozick & DeLuca, 2005). The following subsections describe findings
across these issues.
Delaying students. Using the High School and Beyond (HS&B) data set of
students who graduated from high school in 1980, Carroll (1989) and Hearn (1992) were
among the first scholars to research postsecondary delay practices in the U.S. Their
studies drew similar conclusions and set the foundation for future studies exploring
related issues using more current datasets. Ultimately, studies have found that students
who delayed their postsecondary education were more likely to be male, Black, from
lower income backgrounds and to have lower levels of academic credentials and
educational aspirations (Carroll, 1989; Hearn, 1992). These observed trends have
16 Additional research findings demonstrate that delay is also associated with having family
responsibilities, lower levels of parental education, lower levels of academic preparation,
achievement, and aspirations (Goldrick-Rab, 2010; Horn et al., 2005), as well as lower
levels of social and cultural capital as measured by several family- and school-based
indicators (Rowan-Kenyon, 2007).
Length of delay. A number of studies have examined the length of time that
students delay (Horn et al., 2005; Niu & Tienda, 2013). Based on analyses of the
BPS:96/01 data, Horn et al. (2005) described that approximately 9% delayed for one year
or less, 7% delayed 2-4 years, 12% delayed 5-9 years, and the remaining 12% delayed ten
or more years. Niu and Tienda (2013) reported that among Texas graduating seniors in
2002, 10% delayed for one year or less, and 4% delayed 2-4 years. Because the structure
of these samples is not consistent (one is a cross-sectional study and the other is a cohort
study), making comparisons across studies does not make sense.
Enrollment patterns. Studies have also shown differences in the enrollment
patterns of delayers compared to immediate enrollers. Consistently, descriptive analyses
have demonstrated that as compared to immediate enrollers, a smaller proportion of
delayers attend four-year institutions (Bozick & DeLuca, 2005; Niu & Tienda, 2013) or
enroll full-time (Horn et al., 2005). The fact that delayers have been shown to enter
two-year institutions (instead to a four-two-year institution) as well as enroll part-time (instead of
full-time) has been particularly concerning to some scholars since, as these behaviors and
choices are known risk factors to degree persistence and graduation (Kuh, Kinzie, &
17
Postsecondary outcomes related to delay. Understanding the characteristics of
delaying students has been particularly pertinent when considering effects of delaying on
postsecondary outcomes. Several studies have addressed the issue of degree completion
(Adelman, 2006; Bozick & DeLuca, 2005; Carroll, 1989). In general, these studies have
shown that delaying is associated with lower odds of bachelor’s degree completion,
although with some variation in the effect size (Adelman, 2006; Bozick & DeLuca, 2005;
Carroll, 1989). These studies have attempted to both identify the negative outcomes
associated with delaying as well as the types of students most likely to delay.
Conclusions and areas for expansion. The research presented above exploring
students who delay (Carroll, 1989; Horn et al., 2005), the role of delay length (Horn et
al., 2005; Niu & Tienda, 2013), and enrollment patterns of delayers (Bozick & DeLuca,
2005) point to several key trends with respect to the relationship between delayers and
immediate enrollers. First, postsecondary delay is associated with being male, of minority
status, of low socioeconomic status, and having family responsibilities. And, as compared
to immediate enrollers, delayers have lower levels of parental education, and lower levels
of both academic credentials and educational aspirations. Second, students are delaying
for a variety of lengths of time, but a delay of one year appears to be most common.
Third, delaying is associated with attending less selective institutions as compared to
immediately enrolling (Bozick & DeLuca, 2005; Niu & Tienda, 2013). And fourth,
college completion rates are lower among students who delay.
One major shortcoming of the studies reviewed here has been their inability to
disaggregate and describe delayers based on the reasons for their delay, which assumes
18 understanding of delayers, delay practices, and related outcomes in the U.S., an
exploration of how student characteristics, including enrollment patterns, vary with
respect to the different reasons that students delay, is needed.
Gap Year Experiences
Although there have been few empirical studies undertaken to examine U.S. gap
year participants and their experiences, studies in the U.K. and Australia report that gap
year participants are predominantly white, disability-free, and females from middle-class
backgrounds who have attended private schools (Horn et al., 2005; Jones, 2004; King,
2011; Martin, 2010). In terms of the personal characteristics of gap year takers, studies in
Australia have shown that as students, they tend to be less motivated than their peers who
enroll immediately (as measured by lower scores on the “Motivation and Engagement
Scale (MES-HS) for high schoolers). Additionally, they have been reported to have more
post-school uncertainty and lower levels of high school achievement than those who
enroll immediately (Birch & Miller, 2007; Haigler & Nelson, 2005; Martin, 2010;
O'Shea, 2011b; Stehlik, 2010).
Prior studies have identified a variety of reasons students elect to take a gap year,
including: personal, educational, career-related, and financial (Haigler & Nelson, 2005;
O'Shea, 2011a; Stehlik, 2010). Several studies reported academic burnout and the need
for an academic break as driving factors for gap year participation (Haigler, 2012; Lyons,
Hanley, Wearing, & Neil, 2012; O'Shea, 2011a). Self-exploration, personal growth, and
development with respect to maturity and independence were also commonly reported
19 Although there have been few empirical studies undertaken to examine gap year
experiences for U.S. students, it is generally believed that taking a gap year is a positive
and beneficial endeavor. U.K. foreign Secretary, Jack Straw, has publically promoted gap
year practices, arguing that, “Taking a gap year is a great opportunity for young people to
broaden their horizons, making them more mature and responsible citizens. Our society
can only benefit from travel which promotes character, confidence, decision-making
skills” (as cited in Simpson, 2005, p. 453). In terms of research, anecdotal evidence as
well as some peer-reviewed studies have identified positive effects associated with
participation relating to personal growth (“Bridge Year Program,” n.d.; Martin, 2010),
language development (Clagett, 2012; Lyons et al., 2012; Simpson, 2005; Spenader,
2011), global citizenship (Heath, 2007; King, 2011), and college and career attainment
for students in the U.K. and Australia (Birch & Miller, 2007; King, 2011; Martin, 2010;
O'Shea, 2011b; Stehlik, 2010). Across the nation many colleges and universities,
including Harvard and Princeton, have begun to embrace the idea of a gap year,
supporting the notion that gap year experiences are beneficial to both students and their
future postsecondary institutions.
Summary
Synthesis of literature exploring student characteristics and the effects associated
with delaying in general as well as for a gap year in particular, have resulted in some
clear discrepancies with respect to the characteristics of students who delay and the
impacts of delaying on college academic outcomes. In general, studies that examined
delay in general view delay as a threat to degree completion (Adelman, 2006; Bozick &
20 many personal and academic benefits to participants (Martin, 2010; O'Shea, 2013). Also,
gap year participants have been described quite differently from the more general
delaying students. These findings confirm a need for a more nuanced understanding of
delay that might connect these areas of research. Based on the fact that gap year delayers
appear to be different from the larger group of delaying students, there is reason to
believe there are a variety of reasons for which individuals delay and myriad outcomes
associated with delay type. In order to develop a comprehensive understanding of
delaying students and their related outcomes, it is essential to examine students and their
characteristics across delay reasons. This study attempts to address the current gaps in our
understanding of postsecondary delay.
Research Methodology and Design
This study examines the diverse landscape of postsecondary delay practices in the
United States and how different student characteristics are associated with various delay
reasons. Using descriptive statistics (e.g., cross-tabulations and chi-square tests), and
linear and logistic regression, this study answers the following three research questions:
1. What are the characteristics of postsecondary delay practices, both in terms of
timing and reason, among those who are enrolled in postsecondary education?
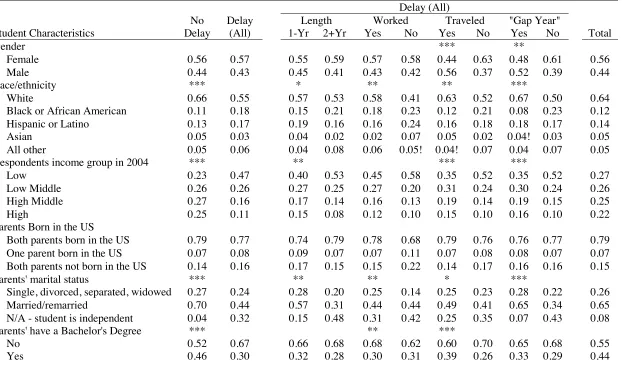
2. How do the characteristics of delaying students differ based on reason and length
of delay, and from those who do not delay?
3. What are the predictors of delaying postsecondary enrollment for different
21
The Data
This study utilizes data from the 2004/2009 Beginning Postsecondary Secondary
Longitudinal Study (BPS:04/09) from the National Center for Education Statistics
(NCES), which was designed to “address the need for nationally representative data on
key postsecondary education issues” (Wine, Janson, & Wheeless, 2011, p. 1). The study
examines the experiences over the course of a six year period of first-time beginners
(FTBs), defined as “students who started their postsecondary education for the first time
during the 2003–04 academic year at any postsecondary institution in the United States or
Puerto Rico” (Wine et al., 2011 p. iii). The BPS:04/09 survey includes students who were
FTBs in the National Postsecondary Student Aid Study in 2003-04 (NPSAS:04).
The primary purpose of the NPSAS:04 study was to understand how students and
their families pay for postsecondary education. The survey targeted all undergraduate,
graduate, and professional students, enrolled in Title VI postsecondary institutions in the
U.S. and Puerto Rico between July 1, 2003 and June 30, 2004. Title IV institutions are
those eligible for the federal student aid program and include public and private (both
not-for-profit and for-profit) four-year, two-year, and less-than-two year colleges and
universities. The administration of the survey entailed an eight-step sequential process.
Beginning with construction of a sampling frame from the 2000-2001 Integrated
Postsecondary Education Data System (IPEDS) Institutional Characteristics (IC), 58
institutional strata were created based upon “institutional level, institutional control,
highest level of offering, Carnegie classification, and state” (Cominole et al., 2006, pp.
5-6). Within institutions, students from eight strata ranging from both in- and out-of-state
22 separately from other undergraduate students in anticipation of the 2006 and 2009 BPS
follow-up surveys. Originally, 56,070 FTBs were targeted and 49,410 contacts were
established, yielding an 88.1 percent response rate. Five sources of data contributed to the
NPSAS:04: (1) Student Record abstraction which involved institutionally provided
financial aid and registrar records for students, entered electronically at the institution, (2)
Student Interviews, either self-administered or interviewer administered, via a web-based
questionnaire, (3) Central Processing System (CPS)’s data from the Free Application for
Federal Student Aid (FAFSA) form, (4) the National Student Loan Data System
(NSLDS)’s data on Title IV loans and Pell Grants, and (5) IPEDS information about
postsecondary institutions. The student interview was comprised of six sections including
enrollment, student expenses and financial aid, employment, education experiences,
student background, and locational information.
In both 2006 and 2009, NCES contacted eligible students using a variety of
methods including batch tracing, mailings, Computer Assisted Telephone Interviewing
(CATI) tracing, intensive tracing, and field tracing. The content of the interviews focused
on four key topics: enrollment history, enrollment characteristics, employment, and
background. The interviews were administered in the same fashion as NPSAS:04 student
surveys. Surveys took approximately 20 minutes to complete and students were
financially incentivized at each stage of the data collection process. Among the panel
respondents there was an unweighted response rate of 87.0% and a weighted response
rate of 85.7%. Additionally, postsecondary transcripts were requested and obtained with
an 87% response rate from all institutions attended by participants between July 1, 2003
23 there are 1,647 variables in the data set. The data used in this study are from the
BPS:04/09 restricted use database.
Previous studies focusing on postsecondary delay have utilized NELS:88 ,
BPS:96/01, and 2002 Texas graduating seniors (Bozick & DeLuca, 2005; Goldrick-Rab
& Han, 2011; Horn et al., 2005; Niu & Tienda, 2013; Rowan-Kenyon, 2007). Presently,
no peer-reviewed studies have utilized more current data sets, including BPS:04/09, to
examine delayers.
Analytic sample. The 2003-04 National Postsecondary Student Aid Study
(NPSAS:04) included 44,670 potential FTBs (composed of confirmed FTBs and other
“likely” FTBs). Of this group, 21,580 were confirmed non-FTBs or non-respondents. The
first follow-up study in 2006 included a sample of 23,090 students deemed eligible from
the 2004 sample and the final sample in 2009 included 18,640 students. The complete
BPS:04/09 data set contains completed information in the form of both interview and
administrative records (postsecondary transcripts) for a total of approximately 16,680
students from an eligible sample of 18,640 students. In total, there were approximately
16,120 panel respondents who participated in all three waves of data collection. The
BPS:04/09 data set contained an unweighted total of 16,680 first-time beginner
respondents, representing 3,746,295 students.
Because this dissertation is concerned with the postsecondary enrollment
decisions and related experiences of students who have graduated from high school in the
United States, I excluded students who had not earned a high school diploma or
certificate (N=1,360) and those who attended a foreign high school (N=370). This
24 size to 3,304,827. I then restricted the analytic sample to FTBs under the age of 24 years
for two salient reasons. First, this study is primarily concerned with the implications of
delaying postsecondary education as compared to directly enrolling; so examining
shorter-term delay was more appropriate. Excluding individuals over the age of 24 years
simultaneously capped the maximum length of delay to seven years. Second, for many of
the variables of interest in this study, specifically those related to academic background,
data were only collected for those under age 24. Restricting the analytic sample in this
way retained 87% of the unweighted subjects in the study for a total of 13,060
respondents representing a weighted population of 2,739,244. Finally, because delay
information is a critical outcome and predictor variable in this study, I performed listwise
deletion in the 66 cases with missing data on the reason for delay. The cases deleted only
made up 0.51% of the overall remaining sample; all 66 cases with missing data on the
reason for delay reported delaying for two or more years. Dropping these final 66 cases
reduced the unweighted analytic sample size to 12,990, allowing me to ultimately
generalize to a population of 2,721,215 students representing approximately 73% of the
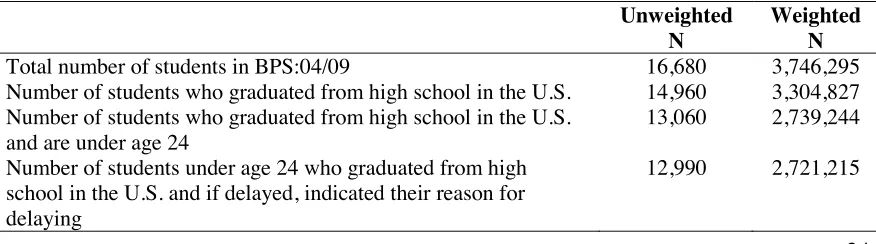
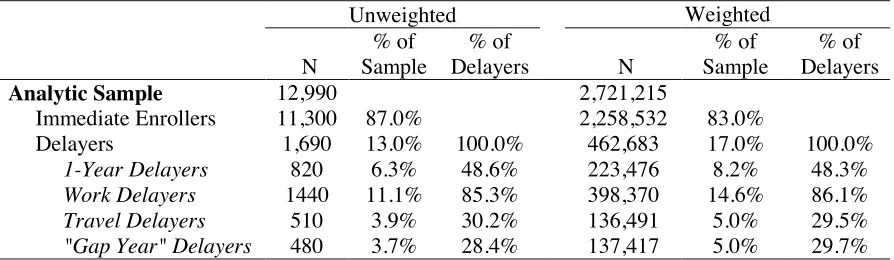
BPS:04/09 population. Table 1 illustrates this restriction of the analytic sample.
Table 1
Unweighted and Weighted Sample Counts for Selection Criteria and Resultant Analytic
Samples
Unweighted N
Weighted N
Total number of students in BPS:04/09 16,680 3,746,295
Number of students who graduated from high school in the U.S. 14,960 3,304,827
Number of students who graduated from high school in the U.S. and are under age 24
13,060 2,739,244
Number of students under age 24 who graduated from high school in the U.S. and if delayed, indicated their reason for delaying
25
Source: U.S. Department of Education, National Center for Education Statistics, 2003-04 Beginning Postsecondary Students Longitudinal Study, Second Follow-up (BPS:04/09). Notes: Figures weighted using WTB000 & WTB001-WTB200.
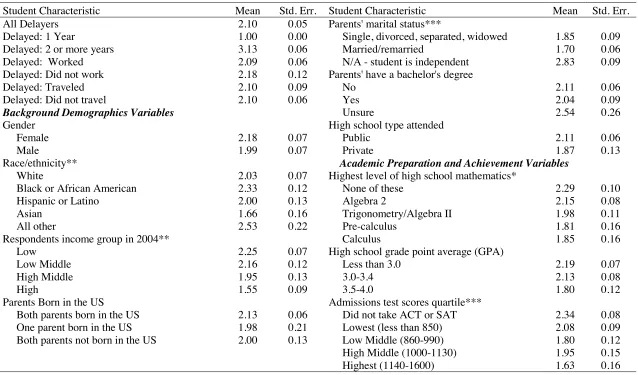
Variables
In order to explore the ways in which student characteristics varied based on
delay reasons, I disaggregated the delayers in several different ways according to their
indicated reasons. Because taking a gap year was not one of the available reasons on the
survey, I used variables to construct a “gap year” proxy variable (explained in detail
below). To date, no peer-reviewed studies have disaggregated students by their reasons
for delaying. First, students in the analytic sample were compared based on whether or
not they delayed. Second, students were compared based on timing of postsecondary
entrance, including: no delay (entered immediately following high school), delayed for
one year, or delayed for two or more years. The data set also included six “delay reason”
variables where students could indicate delaying for any combination of the following
reasons – work, military, marriage or family responsibilities, health problems, travel, or
other reasons. As the six delay reason choices were not mutually exclusive, there were a
total of 64 different delayer profiles, 45 of which were represented within the sample. In
this study, I specifically examined students who indicated delaying for work and for
travel and compared those students to immediate enrollers as well as work and
non-travel delayers.
Finally, Jones (2004) in his Review of the Gap Year Provision specifies that a gap
year may be comprised of any of the following activities, taking place either domestically
or internationally and in a structured or unstructured way: organized travel, independent
26 capture students who had delayed expressly for the purpose taking gap year (rather than
for such reasons as health, having a family, or joining the military), I selected six of the
delayer profiles that most closely aligned with “gap year” reasons. I then examined
students within these groups that delayed for one year: travel only, travel + other, travel +
work, travel + work + other, work only, and work + other. Additionally the average time
delayed for students by characteristics is also utilized. Throughout this study, I
intentionally use quotations around the word “gap year” to denote that this grouping is
presently a hypothesized identification of actual gap year participants.
Appendix A includes the full list of variables used in this analysis. Aligning with
many of the categories within Perna’s (2006) model and several of the same independent
variables used in previous studies, this study accounted for students’ pre-college
characteristics such as gender, race, income, parents’ place of birth, and parents’ marital
status and highest level of education. Students’ high school academic achievement and
preparation are described using indicators of high school type, highest level of math
taken, grade point average (GPA) and admissions test score. Though not a measure of
preparation, high school type was used as a proxy for student-to-teacher ratio, which is
intended to be an indicator of institutional agents and social capital (Perna, 2006).
According to the Institute of Education Sciences, the average student-to-teacher ratio is
10.7 to 1 in private schools (Education, 2010) and 16 to 1 in public schools (Education,
2012). Additionally, students are described in terms of their enrollment choices and