Rates of Pediatric Injuries by 3-Month Intervals for Children
0 to 3 Years of Age
Phyllis F. Agran, MD, MPH*; Craig Anderson, DHSc, PhD*; Diane Winn, RN, MPH*; Roger Trent, PhD‡; Lynn Walton-Haynes, DDS, MPH‡; and Sharon Thayer, MPH*
ABSTRACT. Objective. Mortality and morbidity data on childhood injury are used to construct developmen-tally appropriate intervention strategies and to guide pe-diatric anticipatory counseling on injury prevention top-ics. Effective anticipatory guidance depends on detailed injury data showing how risks change as children de-velop. Conventional age groupings may be too broad to show the relationship between children’s development and their risk of various causes of injury. Previous stud-ies revealed differences in overall rates and specific causes of injury by year of age. However, single year of age rates for children younger than 4 years may not reflect the variations in risk as a result of rapid develop-mental changes. This study was designed to analyze in-jury rates for children younger than 4 years by quarter-year intervals to determine more specifically the age period of highest risk for injury and for specific causes.
Methods. We used data from 1996 –1998 California hospital discharges and death certificates to identify day of age and external cause of injury (E-code) for children younger than 4 years. The number of California residents for each day of age was estimated from US Census of estimates of California’s population by year of age for the midpoints (1996 –1998). Rates were calculated by 3-month intervals. We grouped the E-codes into major categories that would be particularly relevant for devel-opmentally related risks of injury specific to young chil-dren. The categorization took into account physical, mo-tor, behavioral, and cognitive developmental milestones of children 0 to 3 years.
Results. There were a total of 23 173 injuries; 636 re-sulted in death. The overall annual rate for children aged 0 to 3 years was 371/100 000. Beginning at age 3 to 5 months, the overall rate of injury rapidly increased with increased age, peaking at 15 to 17 months. The mean injury rate calculated for each single year of age did not reflect the variation and the highest rate of injury by quarter year of age for children younger than 1 year, 1 year, and 2 years. The leading major causes of injury in descending order were falls, poisoning, transportation, foreign body, and fires/burns. The overall rate of the major category of falls exceeded poisoning, the second
leading cause of injury, by a factor of 2. Age-related differences were detected within each major cause of injury. For children 0 to 12 months of age, there was a different leading cause of specific injury for each 3-month period: other falls from height (0 –2 months), battering (3–5 months), falls from furniture (6 – 8 months), and nonairway foreign body (9 –11 months). Hot liquid and vapor injuries were the leading specific causes for children 12 to 17 months. Poisoning by medi-cation was the leading specific cause of injury for all age groups from 18 to 35 months and exceeded poisoning by other substances. Pedestrian injury was the leading spe-cific cause of injury for all age groups from 36 to 47 months. Fall from furniture has the highest rates of spe-cific causes of falls from age 3 to 47 months. Fall from stairs peaked at age 6 to 8 months and 9 to 11 months. Fall from buildings was highest at 24 to 26 months. Poisoning by medication peaked at age 21 to 23 months, but poi-soning by other substances peaked at 15 to 17 months. The motor vehicle occupant injury rates were fairly sta-ble over the age span of this study. The pedestrian injury rate increased beginning at age 12 to 14 months and by 15 to 17 months was double that of the motor vehicle occu-pant. Foreign body had a marked peak at age 9 to 11 months. Both battering and neglect rates were highest among infants 0 to 2 and 3 to 5 months. Bathtub submer-sions had a narrow peak at age 6 to 11 months. Other submersions peaked at 12 to 14 months and remained high until 33 to 35 months.
Conclusions. We departed from usual groupings of E-codes and devised groupings that would be reflective of age-related developmental characteristics. Differences in rates by narrow age groups for young children can be related to developmental achievements, which place the child at risk for specific causes of injury. We found marked variability in both rates and leading causes of injury by 3-month interval age groupings that were masked by year of age analyses. Children aged 15 to 17 months had the highest overall injury rate before age 15 years. This coincides with developmental achievements such as independent mobility, exploratory behavior, and hand-to-mouth activity. The child is able to access haz-ards but has not yet developed cognitive hazard aware-ness and avoidance skills. A remarkable finding was the high rate of battering injury among infants 0 to 5 months, suggesting the need to address potential child maltreat-ment in the perinatal period. Poisoning was the second major leading cause of injury; more than two thirds were medication. Cultural factors may influence views of med-ications, storage practices, use of poison control system telephone advice, and risk of toddler poisoning. The pedestrian injury rate doubled between 12 and 14 months and 15 and 17 months and exceeded motor vehi-cle occupant injury rates for each 3-month interval from 15 to 47 months. Pedestrian injury has not received suf-From the *University of California, Center for Health Policy and Research,
Pediatric Injury Prevention Research Group, Irvine, California; and ‡Epi-demiology and Prevention for Injury Control Branch, California Depart-ment of Health Services, SacraDepart-mento, California.
Received for publication Nov 4, 2002; accepted Feb 13, 2003.
The contents of this study are solely the responsibility of the authors and do not necessarily represent the official views of the National Center for Injury Prevention and Control.
Reprint requests to (P.F.A.) 100 Theory, Ste 110, University of California, Irvine, Health Policy and Research, Irvine, CA 92697-5800. E-mail: pagran@uci.edu
ficient attention in general and certainly not in injury prevention counseling for children younger than 4 years. Anticipatory guidance for pedestrian injury should be incorporated before 1 year of age. Effective strategies must be based on the epidemiology of childhood injury. Pediatricians and other pediatric health care providers are in a unique position to render injury prevention services to their patients. Integrating injury prevention messages in the context of developmental assessments of the child is 1 strategy. These data can also be used for complementary childhood injury prevention strategies such as early intervention programs for high-risk fami-lies for child abuse and neglect, media and advocacy campaigns, public policies, and environmental and prod-uct design.Pediatrics 2003;111:e683–e692. URL: http://www. pediatrics.org/cgi/content/full/111/6/e683; child, injury, causes of injury, injury hospitalization and death, age.
ABBREVIATIONS. OSHPD, Office of Statewide Health Planning and Development; E-code, external cause of injury code; TIPP, The Injury Prevention Program.
I
n 2000 in the United States, unintentional and assault injuries accounted for 42% of deaths of children aged 1 to 4 years1and 29% of emergencydepartment visits for children aged 0 to 5 years.2
National Center for Injury Prevention and Control fatality data for 2000 revealed differences in overall rates by single year of age for children younger than 15 years. The highest overall injury death rate was for children younger than 1 year: 34/100 000. Injury death rates progressively decreased through 9 years of age to a low of 7/100 000. These mortality data revealed differences by year of age for many causes of injury, such as pedestrian, motor vehicle occupant, and drowning.3 As of 2000, national estimates of
nonfatal injuries treated in emergency departments also revealed differences by single year of age. The nonfatal estimated injury rate was highest for chil-dren 2 years of age and second highest for chilchil-dren aged 1 year. After 2 years of age, the rates progres-sively decreased through 6 years of age.4 A recent
study of nonfatal injuries in children younger than age 1 year seen in US emergency departments found a rate of 108.2/1000, documenting the burden of injury among infants.5
Mortality and morbidity data on childhood injury are used to construct developmentally appropriate intervention strategies and to guide pediatric antici-patory counseling on injury prevention topics. Effec-tive anticipatory guidance depends on detailed in-jury data showing how risks change as children develop. Conventional age groupings, such as 1 to 4 years for injury data, may be too broad to show the actual relationship between children’s development and their risks for various causes of injury. In our previous study using California hospital discharge data and death data, we demonstrated that tradi-tional age groupings of years 1 to 4, 5 to 9, and 10 to 14 did not adequately reflect variation in rates within each age group and masked differences that cut across these age groups.6
We hypothesized that because of rapid changes in development in early childhood, even single year of
age analyses may be inadequate to reflect variation in risk of injury for children younger than 4 years. This study was designed to analyze injury rates for children younger than 4 years by quarter-year inter-vals to determine more specifically the age period of highest risk for injury overall and for specific causes.
METHODS
We defined injury in this study as an injury hospitalization or death. We used data from California hospital discharges and California death certificates for 1996 –1998 to identify the day of age and external cause of injury to California children younger than 4 years. We examined data for 3 years because this procedure produced larger numbers and more stable rates. Hospital dis-charge data for California hospitals in 1996 –1998 were obtained from the Office of Statewide Health Planning and Development (OSHPD), California Health and Human Services Agency. By law, each civilian hospital in California must report data to OSHPD on each hospital discharge, including external cause of injury codes (E-codes)7for each initial hospitalization for injury. (Subsequent
hospitalizations for the same injury are not E-coded.) OSHPD edits each discharge report for accuracy. We used the version of the publicly available data that includes age reported in years and days for children up to their fourth birthday.
Death certificate data for 1996 –1998 were obtained from the Office of Health Information and Research, California Department of Health Services. The precise age of decedents was calculated from their dates of birth and death.
From each data set, we selected records of California residents who were younger than 4 years and had a principal E-code of E800 –E869, E880 –E929, or E950 –E999 as the principal E-code or underlying cause of death. To avoid double counting, hospital discharges that involved a death were excluded.
We grouped the E-codes into major categories that would be relevant for developmentally related risks of injury specific to young children (Table 1). The categorization took into account physical, motor, behavioral, and cognitive developmental mile-stones of children aged 0 to 3 years. These differed in some ways from the groupings recommended by the National Center for Injury Prevention and Control for unintentional injury.8,9Injuries
as a result of assaults (E960 –E969) were combined with hunger, thirst, exposure, and neglect (E904). Six injuries reported as self-inflicted (E950 –E959) and 203 injuries with unknown intent (E980 –E989) were assigned to specific categories by mechanism. Young children are not able to form the intent to harm themselves. We created a new category, foreign body (E911, E912, and E915), because these injuries have in common the hazard of small objects and food. All transportation injuries were grouped together.
Within these major categories, specific categories were also examined. Unlike the National Center for Injury Prevention and Control recommended groupings, we combined traffic and non-traffic events in each of the transportation subcategories. On the basis of our previous experience, we found that medical record documentation often lacks information on location of transporta-tion injuries. The E-codes used to define each major and specific category are shown in Table 1.
A number of E-codes, or cause-of-injury codes, that are impor-tant in other age groups include only a small number of cases in these data. There were 60 assaults with firearms and 10 assaults with cutting or piercing instruments. These injuries are included under the specific category “other listed assaults.”
The number of California residents for each day of age younger than 4 years was estimated from US Census estimates of California population by year of age for the midpoints of 1996 –1998.10The
estimates for the 3 years were summed and interpolated linearly to provide population estimates by day of age. The slope connect-ing the midpoints of year 0 and year 1 was extended to birth, and the slope connecting the midpoints of year 2 and year 3 was extended to the day before the fourth birthday.
hospitalization or death. Three-month age periods with 10 injuries had rates of 2 or 3 per 100 000 and, using the Poisson distribution, 95% confidence limits 1 per 100 000 below the rate and 2 per 100 000 above the rate. Rates of 20 per 100 000 had 95% confidence limits within 5 per 100 000 of the rate. Rates of 89 per 100 000 had 95% confidence limits within 10 per 100 000 of the rate.
RESULTS
There were a total of 23 173 injuries from January 1, 1996, through December 31, 1998. Of these, 636 (3%) resulted in death. The overall annual rate for children aged 0 to 3 years was 371/100 000. The annual injury rates by quarter year of age are shown in Table 2.
Beginning at age 3 to 5 months, the overall rate of injury rapidly increased with increased age and peaked at age 15 to 17 months. After age 15 to 17 months, the rates slowly decreased to a low at age 42 to 44 months (Fig 1).
The mean injury rate calculated for each single year of age did not reflect the variation and the highest rate of injury by quarter year of age for children younger than 1 year, 1 year, and 2 years. For children younger than 1 year, the annual average
rate masked the 25% greater rate for children aged 9 to 11 months. The rate for those aged 15 to 17 months was 6% higher than the mean rate for the 1-year-old age group. The injury rate for children 24 to 26 months was 13% higher than the mean rate for the 2-year-old age group. For children 3 years of age (36 – 47 months), the rates were fairly uniform throughout each quarter year and were the lowest overall (Table 2).
The leading major causes of injury in descending order were falls, poisoning, transportation, foreign body, and fires/burns (Fig 2). The overall rate of the major category of falls exceeded poisoning, the sec-ond leading cause of injury, by a factor of 2. Age-related differences were detected within each major cause of injury.
Falls
“Other fall from height” was the most frequent specific cause of fall at 0 to 2 months (Fig 3). Other fall from height decreased with each age interval from 3 to 14 months. Fall from furniture was the leading cause of fall for all age groups 3 months of TABLE 1. E-Codes for Injury Categories and Subcategories
Major Category Specific Category ICD-9-CME-Codes
Assault and neglect Battering E967.0–967.9
Other listed assaults E960.0–966, 968.0–968.6 Unlisted, unspecified, and late
effects of assaults
E968.8, 968.9, 969
Neglect E904.0–904.9, 968.4
Bites and stings Dog bites E906.0
Other bites and stings E905.0–905.6, 905.9, 906.1–906.5, 906.9
Burn/fire Fire/flame E890.0–899, 958.1, 988.1
Hot liquids and vapors E924.0, 924.2, 958.2, 988.2 Other and unspecified E924.1, 924.8, 924.9, 958.7, 988.7
Cut/pierce E920.9–920.9, 956, 986
Fall Buildings E882
Furniture E884.2, 884.4, 884.5
Playground equipment E884.0
Stairs E880.9
Other falls from heights E880.0, 880.1, 881.0, 881.1, 883.0–883.9, 884.1, 884.3, 884.6, 884.9, 957.0–957.9, 987.0–987.9
Falls on the same level E885, 886.0, 886.9
Other and unspecified E888
Foreign body Airway obstruction—food E911
Airway obstruction—nonfood E912 Nonairway foreign body E915
Poisoning Medications E850.0–858.9, 950.0–950.5, 980.0–980.5
Other substances E860.0–869.9, 950.6–952.9, 972, 980.6–982.9
Struck by, against E916–917.9, 973, 975
Submersion/drowning Bathtub E910.4
Other and unspecified E830.0–830.9, 832.0–832.9, 910.0–910.3, 910.8, 910.9, 954, 984
Transportation Bicyclist E810–825 (.6), 826.1
Motor vehicle occupant E810–825 (.0, .1)
Pedestrian E810–825 (.7)
Other and unspecified E800.0–807.9, 810–825 (.2–.5, .8, .9), 826.0, 826.2–829.9, 831.0–831.9, 833.0–845.9, 958.5, 958.6, 988.5, 988.6 All other injuries Firearms, except assault E922.0–922.3, 922.8, 922.9, 955.0–955.4, 985.0–985.4
Foreign body, eye E914
Machinery E919.0–919.9
Environmental, except bites, stings, and neglect
E900.0–903, 905.8, 906.8, 907–909.9, 928.0–928.2
Overexertion E927
Suffocation, except choking E913.0–913.9, 953.0–953.9, 983.0–983.9
age and older. Peak rates of injury from fall from furniture were at 6 to 8 months and 15 to 17 months. Fall from stairs peaked at age 6 to 8 months and 9 to 11 months. Fall from buildings was highest at 24 to 26 months,. Fall from playground equipment was not numerous enough to calculate rates until age 18 to 20 months, and the rate more than doubled by age 39 to 41 months (Table 2).
Poisoning
Poisoning by medication was the leading specific cause of injury in this study. Beginning at 9 to 11 months, the rate progressively rose to a peak at 21 to 23 months and then steeply declined to a low at 42 to 47 months (Fig 3). The injury rate for poisonings by other substances was consistently lower than the rate for medications for all age groups, except for age 3 to 5 months The highest rates of poisoning by other substances were among children 12 to 20 months. The peak rate was at a younger age, 15 to 17 months, compared with the peak rate for poisoning by med-ications.
Transportation-Related Injuries
The motor vehicle occupant injury rates were fairly stable over the age span of this study, ranging from a low at age 21 to 23 months to a high at the upper age group of the study, 45 to 47 months (Fig 3). At age 12 to 14 months, the pedestrian injury rate was equal to that of motor vehicle occupant rate. At age 15 to 17 months, the pedestrian injury rate was double that of the motor vehicle occupant rate and remained higher than the occupant rate for all sub-sequent age groups (Fig 3).
Foreign Body
Nonairway foreign bodies were mostly in the gas-trointestinal tract and exceeded airway obstruction, both food and nonfood. Nonairway foreign body had a peak rate for children aged 9 to 11 months, which decreased by 50% by age 18 to 20 months. Nonfood airway obstruction was highest from age 6 to 15 months and peaked at the same age as nonair-way foreign body, 9 to 11 months.
Burns
Burn injuries from hot liquids and vapors had much higher rates than burns from fire/flame. The overall rate of burns from hot liquids/vapors was 5 times that of fire/flames. The rate steeply rose to a peak at 12 to 14 months and then declined to a low at 42 to 47 months. The rate of injury from fire/flame was fairly constant over the age range of this study.
Assault and Neglect
The peak rates of assault and neglect were be-tween 0 and 5 months with the rates for battering far exceeding neglect. The rate for battering was highest for infants 0 to 2 months and 3 to 5 months. The rate of battering injury rapidly declined by 9 to 11 months. Neglect showed a pattern similar to batter-ing with the highest rates at 0 to 2 and 3 to 5 months.
Submersion/Drowning
Bathtub submersion/drowning injury rates had a very narrow age range, largely confined to children aged 6 to 11 months. “Other and unspecified sub-mersion/drowning,” which includes pool and spa submersions, nearly equal bathtub submersions for 9- to 11-month-olds and then showed a 2-fold in-crease in the 12- to 14-month-old age group. The rates remained high until age 33 to 35 months and then declined to a low at 45 to 47 months.
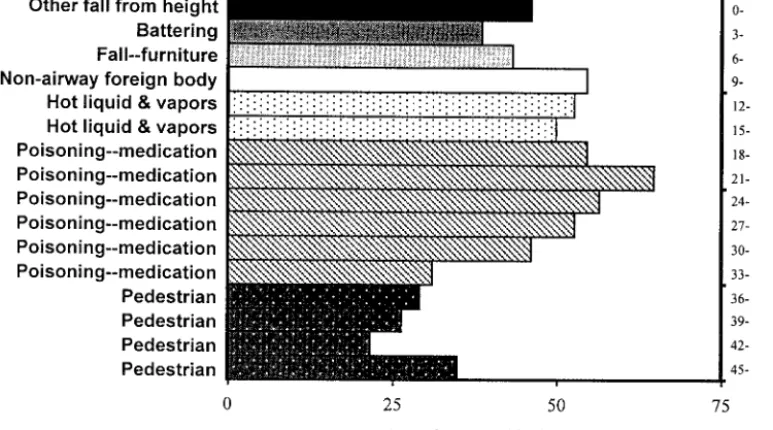
Marked variability in rates and leading causes of injury by quarter year of age is illustrated in Fig 4. The leading cause of specific injury was different for each 3-month age group from 0 to 11 months. The leading specific cause of injury was “other fall from height” for 0 to 2 months, battering for 3 to 5 months, fall from furniture for 6 to 8 months, and nonairway foreign body for 9 to 11 months. From 12 to 36 months, there were fewer specific causes of injury. From 12 to 17 months of age, hot liquid/vapor burns was the leading specific cause of injury. Poisoning by medication was the leading cause of injury for all age groups from 18 to 35 months of age, and pedestrian injury had the highest rate from 36 to 47 months of age. There was also marked variability in the rates. For example, the rate of poisoning, the leading cause of injury for children 21 to 23 months, was 3 times higher than the rate for the leading cause of injury (pedestrian) for children aged 42 to 44 months.
DISCUSSION
Our previous analysis of the annual rates of pedi-atric injury hospitalizations/death for children aged 0 to 19 years in a large state with E-coding of hospital discharge data provided an overview of the age-specific causes of injury.6 Age-related differences
were found for many of the major and specific causes of injury by single year of age. We also found that children aged 1 year had the highest injury rates before 15 years of age.
This study focused on more detailed analyses of children younger than 4 years. This age group is unique in terms of rapid growth and developmental changes, which influence risk for a number of spe-cific causes of injury. We departed from usual group-Fig 1. Annual rate of injury hospitalization and death per 100 000
ings of E-codes and devised groupings that would be reflective of age-related developmental characteris-tics of children aged 0 to 3 years. These developmen-tal features have implications for risk of injury. For example, very young children are at risk for foreign body ingestion. They have the mobility to gain access to small objects and explore objects by hand-to-mouth activity. The airway and gastrointestinal tract are more readily obstructed because they are smaller compared with older children. Because the same
de-velopmental features place the child at risk for both airway and gastrointestinal foreign bodies, the E-codes were grouped. From an injury prevention per-spective, these categories should be grouped to-gether as the prevention strategies are similar.
masked leading causes for narrower age groups and masked trends and patterns that transected year-of-age groupings. Substantial variability was detected in leading causes of injury rates by quarter year of age among children younger than 1 year.
Children aged 15 to 17 months had the highest overall injury rate, 94% higher than that of children
is interesting that Rowntree,11in a classic article
pub-lished in 1950 on “accidents” among children younger than 2 years, grouped injuries by develop-mental milestones. He found that the most frequent medically attended injuries were among children who were already walking and up to 16 months of age, which he characterized as “beginning to walk and becoming inquisitive.”
Using developmental milestones and providing anticipatory guidance to discuss injury hazards has been the approach of The Injury Prevention Program (TIPP) of the American Academy of Pediatrics.12
Data from our study can be used to enhance the 1994 recommendations of TIPP. For example, the early onset of pedestrian injury, the increase with in-creased age, and the extent of pedestrian injuries indicate that pedestrian injury prevention should re-ceive greater emphasis. Anticipatory guidance for pedestrian injury should be incorporated before 1 year of age.
A remarkable finding in this study was the highest rates of battering injury among infants 0 to 5 months. A number of studies have similarly found that infant homicides and head injury from child abuse are higher in the early months of life. Overpeck et al13
found that half of the homicides among infants oc-curred by the fourth month. In a study of trauma in infants younger than 3 months, 28% were attribut-able to abuse/neglect.14Reece and Sege15found that
the median age for head injury as a result of abuse was 4 months, the same high-risk period identified in this study. The mean age of child abuse was signif-icantly younger than that of unintentional injury in a 10-year retrospective review.16 Health care
profes-sionals who provide prenatal care and early new-born infant care should not only be alert to risk factors for intentional child injury but also should be proactive in early intervention services. These in-fants/families may benefit from referral services for home visits as well as injury prevention counseling
services. Some home visitation programs have doc-umented reductions in injury, abuse, and neglect.17
Recognizing the need for incorporation of violence prevention, the American Academy of Pediatrics is developing the Violence Injury Prevention Program as the companion to TIPP. This tool along with guidelines and policies will enhance pediatricians’ efforts to prevent and identify families that are at risk for child maltreatment and abuse.
Fall was the leading cause of injury for all ages, and the rate was nearly twice that of the second leading cause, poisoning. However, this finding does not yield sufficient information for crafting appropri-ate prevention strappropri-ategies. Unless falls are broken down by specific causes, we are limited in under-standing risk factors for the various types of falls. Fall from furniture was the leading specific cause of falls for all children, except for the 0- to 2-month age group. “Other fall from height” was the leading cause of falls for the 0- to 2-month infants, and many of these may be falls from being dropped. Nearly 12% of infant falls for infants 6 months of age or younger were dropped, most commonly by an older sibling.18 In a study of short vertical falls among
infants aged 0 to 10 months, being dropped by a caregiver was the only characteristic associated with significant injury compared with rolling or fall from furniture.19Falls from stairs had a narrow peak
be-tween 6 and 11 months. This can be related to the onset of crawling and independent mobility. Infant walkers are a contributor to falls from stairs.20
Spe-cific prevention messages for this age group should include the use of stair gates and the elimination of infant walkers.
was masked by year-of-age analysis. Considerable outreach efforts have been undertaken by poison control centers, and a universal 1– 800 number has been established. Child-resistant containers and blis-ter packaging for medications have reduced child-hood poisonings substantially,21 yet poisoning by
medications remains a leading cause of injury for young children. Cultural factors and views of medi-cines and vitamins may influence storage practices and risks of toddler poisoning.22Additional research
is needed on types of medications and circumstances of ingestion to design more effective interventions.
Pedestrian injuries markedly increased from 9 to 14 months and then doubled between 12 to 14 months and 15 to 17 months, making the rate twice that of the occupant rate. The pedestrian injury rate exceeded motor vehicle occupant injury rates for each 3-month age interval from 15 to 47 months of age. Pedestrian injury was the leading specific cause of injury for children aged 36 to 47 months. Many of these pedestrian injuries among young children are attributable to nontraffic driveway backover events as well as traffic events.23–25The most recent data for
the State of California revealed that children aged 1 year had the highest number of pedestrian deaths.26
These data indicate that pedestrian injury, both driveway backover events and traffic events, should be addressed earlier and receive more emphasis than is currently suggested in the TIPP.12Supervision and
preventing access of young children to areas used by vehicles are essential prevention measures. Environ-mental measures such as speed reduction in residen-tial neighborhoods are additional strategies for the prevention of pediatric pedestrian injuries.27Vehicle
design, which includes sensors and cameras to detect small children behind vehicles, offers potential for prevention of residential driveway backovers.
Nonairway foreign body was the largest specific cause in the foreign body category. The rate of air-way obstruction caused by food was substantially lower than for nonfood items but peaked at the same age. Poisonings and foreign body ingestion, both airway and nonairway obstruction involving food and nonfood items, have similar developmental risk factors: independent mobility, exploration, hand-to-mouth activity, and the pincer grasp as well as ana-tomic/physiologic features such as airway size and drug metabolism. The Consumer Product Safety Commission has issued small parts regulations for toys and products intended for use by children younger than 3 years.28
In California, drowning is the leading cause of death for children aged 1 to 4 years. Age-related patterns were detected. Submersion/drowning rates from bathtubs had a very narrow peak, 6 to 11 months, the same age as falls from stairs. Other and unspecified submersion/drowning, which includes pool submersion, had the highest rates between 9 and 17 months. Messages for drowning prevention need to consider both bathtub and residential pool risks for young children. In this study, the overall rates of submersions were not high; however, be-cause submersions have a high case fatality rate, prevention is critical.
Limitations
Assignment of E-codes is contingent on adequate medical record documentation and sufficiently de-tailed codes. This study demonstrated limitations in understanding injuries from fall. Many E-codes for fall are insufficient for characterizing risk factors. Adding codes on certain causes of injury is 1 ap-proach to make the category more discriminating. However, many causes may result from unusual events that would be difficult to classify under any system.
Injuries as a result of battering may be underre-ported because of insufficient or incomplete informa-tion at hospital discharge regarding inteninforma-tion.29
Un-intentional pediatric trauma is often difficult to distinguish from child abuse.30 These unrecognized
or undocumented cases of child abuse may inflate rates from other causes, such as falls.
Patterns of childhood injury in California may be different from those in other states and regions. For example, childhood deaths in house fires are less frequent in California than in other states, whereas pool drownings are more frequent.31 However, to
the extent that age-related patterns of injury reflect developmental changes, they may be similar in dif-ferent regions.
Implications
Effective strategies must be based on the epidemi-ology of childhood injury. The differences in rates by narrow age groups (quarter-year intervals in this study) can be related to the achievement of develop-mental milestones that contribute to the child’s risk for specific causes of injury. Pediatricians and other pediatric health care providers are in a unique posi-tion to render injury prevenposi-tion services to their patients. Integrating injury prevention messages in the context of developmental assessments of the child is 1 strategy. Enhancements to office-based counseling offering parents the opportunities to practice and develop strategies for managing the risk of injury warrant exploration. These data can also be used for complementary childhood injury preven-tion strategies such as early intervenpreven-tion programs for high-risk families for prevention of child abuse and neglect. Media programs, environmental changes in and around the home, product design, advocacy, and appropriate policy measures are other complementary measures.
ACKNOWLEDGMENTS
This study was supported by grant R49/CCR919796 from the Centers for Disease Control and Prevention, National Center for Injury Prevention and Control.
REFERENCES
1. Hoyert DL, Freedman MA, Strobino DM, Guyer B. Annual summary of
vital statistics—2000.Pediatrics.2001;108:1241–1255
2. Weiss HB, Mathers LJ, Furjuoh SN, Kinnane JM.Child and Adolescent
Emergency Department Visit Databook.Pittsburgh, PA: Center for Vio-lence and Injury Control, Allegheny University of the Health Sciences; 1997
4. National Center for Injury Prevention and Control. Web-based Injury Statistics Query and Reporting System (WISQARS) Nonfatal Injury Reports. Atlanta, GA: Centers for Disease Control and Prevention; 2002. Available at: webapp.cdc.gov/sasweb/ncipc/nfirates.html. Accessed January 6, 2003
5. Powell EC, Tanz RT. Adjusting our view of injury risk: The burden of
nonfatal injuries in infants.Pediatrics.2002;110:792–796
6. Agran PF, Winn DG, Anderson CL, Trent R, Walton-Haynes, L. Rates of
pediatric and adolescent injuries by year of age.Pediatrics.2001;108(3).
Available at: www.pediatrics.org/cgi/content/full/108/3/e45. 7.International Classification of Diseases. Ninth Revision. Clinical Modification
(ICD-9-CM). 5th ed. Washington, DC: National Center for Health Sta-tistics (NCHS) and Health Care Financing Administration; 1996 8. National Center for Injury Prevention and Control, Centers for Disease
Control and Prevention. Recommended framework of E-code group-ings for presenting injury mortality and morbidity data. Available at: www.cdc.gov/ncipc/whatsnew/matrix2.htm. Accessed January 6, 2003
9. Centers for Disease Control and Prevention. Recommended framework
for presenting injury mortality data.MMWR Recomm Rep.
1997;46(RR-14):1–30
10. Population Estimates Program, Population Division, U.S. Census
Bu-reau.Population Estimates for the U S. and States by Single Year of Age and
Sex: July 1, 1996 –1998 (ST-99 –13, ST-99 –12, ST-99 –11). Washington, DC: US Department of Commerce; 2000. Available at: www.census.gov/ population/estimates/state/stats/st-99 –13.txt,/st-99 –12.txt,/st-99 –11. Accessed January 6, 2003
11. Rowntree G. Accidents among children under two years of age in Great
Britain.J Hyg(nowEpidemiol Infect). 1950;48:323–337 (Reprinted inInj
Prev.1998;4:69 –76)
12. American Academy of Pediatrics.The Injury Prevention Program.Elk
Grove, IL: American Academy of Pediatrics; 1994
13. Overpeck MD, Brenner RA, Trumble AC, Trifiletti LB, Berendes HW.
Risk factors for infant homicide in the United States.N Engl J Med.
1998;339:1211–1216
14. Stewart G, Meert K, Rosenberg N. Trauma in infants less than three
months of age.Pediatr Emerg Care.1993;9:199 –201
15. Reece RN, Sege R. Childhood head injuries. Accidental or inflicted?
Arch Pediatr Adolesc Med.2000;154:11–15
16. DiScala C, Sege R, Guohua L, Reece R. Child abuse and unintentional
injuries.Arch Pediatr Adolesc Med.2000;154:16 –22
17. David and Lucille Packard Foundation. Home visiting: recent program
evaluations.Future Child.1999;9(1):inside back cover
18. Warrington SA, Wright CM, ALSPAC Study Team. Accidents and resulting injuries in premobile infants: data from the ALSPAC study.
Arch Dis Child.2001;85:104 –107
19. Tarantino CA, Dowd MD, Murdock TC. Short vertical falls in infants.
Pediatr Emerg Care.1999;15:5– 8
20. American Academy of Pediatrics, Committee on Injury and Poison
Prevention. Injuries associated with infant walkers.Pediatrics.2001;108:
790 –792
21. Schieber RA, Gilchrist J, Sleet DA. Legislative and regulatory strategies
to reduce childhood unintentional injuries. Future Child. 2000;10:
111–136
22. Mull DS, Agran PF, Winn DG, Anderson CL. Household poisoning exposure among children of Mexican-born mothers: an ethnographic
study.West J Med.1999;171:16 –19
23. Agran PA, Winn DG, Anderson CL. Differences in child pedestrian
injury events by location.Pediatrics.1994;93:284 –288
24. Winn DG, Agran PA, Castillo DN. Pedestrian injuries to children
younger than 5 years of age.Pediatrics.1991;88:776 –782
25. Nadler EP, Courcoulas AP, Gardner MJ, Ford HR. Driveway injuries in
children: risk factors, morbidity and mortality. Pediatrics. 2001;108:
326 –328
26. Lynn Walton-Haynes. Pedestrian injuries to young children.EPICgram.
May 2002. Report No. 5, California Department of Health Services, Epidemiology and Prevention for Injury Control Branch. Available at: http://www.dhs.ca.gov/epic/documents/epicgram5-pedestrian.pdf. Accessed April 15, 2003
27. Agran P, Winn D, Anderson C, Tran C, Del Valle C. The role of the
physical and traffic environment in child pedestrian injuries.Pediatrics.
1996;98:1096 –1103
28. US Consumer Product Safety Commission, Office of Compliance. Method for identifying toys and other articles intended for use by children under 3 years of age which present choking, aspiration, or ingestion hazards because of small parts. 16 CFR Part 1501; 2002 29. Winn D, Agran P, Anderson C. Sensitivity of hospitals’ E-coded data in
identifying causes of children’s violence-related injuries.Public Health
Rep.1995;110:277–282
30. Boyce MC, Melhorn KJ, Vargo G. Pediatric trauma documentation.
Adequacy for assessment of child abuse. Arch Pediatr Adolesc Med.
1996;150:730 –732
31. Wilson MD, Baker SP, Teret SP, Shock S, Garbarino J.Saving Children: A
DOI: 10.1542/peds.111.6.e683
2003;111;e683
Pediatrics
and Sharon Thayer
Phyllis F. Agran, Craig Anderson, Diane Winn, Roger Trent, Lynn Walton-Haynes
Rates of Pediatric Injuries by 3-Month Intervals for Children 0 to 3 Years of Age
Services
Updated Information &
http://pediatrics.aappublications.org/content/111/6/e683 including high resolution figures, can be found at:
References
http://pediatrics.aappublications.org/content/111/6/e683#BIBL This article cites 19 articles, 9 of which you can access for free at:
Subspecialty Collections
son_prevention_sub
http://www.aappublications.org/cgi/collection/injury_violence_-_poi
Injury, Violence & Poison Prevention
sub
http://www.aappublications.org/cgi/collection/fetus:newborn_infant_
Fetus/Newborn Infant
following collection(s):
This article, along with others on similar topics, appears in the
Permissions & Licensing
http://www.aappublications.org/site/misc/Permissions.xhtml in its entirety can be found online at:
Information about reproducing this article in parts (figures, tables) or
Reprints
DOI: 10.1542/peds.111.6.e683
2003;111;e683
Pediatrics
and Sharon Thayer
Phyllis F. Agran, Craig Anderson, Diane Winn, Roger Trent, Lynn Walton-Haynes
Rates of Pediatric Injuries by 3-Month Intervals for Children 0 to 3 Years of Age
http://pediatrics.aappublications.org/content/111/6/e683
located on the World Wide Web at:
The online version of this article, along with updated information and services, is
by the American Academy of Pediatrics. All rights reserved. Print ISSN: 1073-0397.