University of Pennsylvania
ScholarlyCommons
Publicly Accessible Penn Dissertations
1-1-2015
The Effect of the Secondary Coordination Sphere
on the Stabilities of Cerium(III) and Cerium(IV)
Coordination Complexes
Jessica Rae Levin
University of Pennsylvania, [email protected]
Follow this and additional works at:http://repository.upenn.edu/edissertations Part of theInorganic Chemistry Commons
This paper is posted at ScholarlyCommons.http://repository.upenn.edu/edissertations/1844 For more information, please [email protected].
Recommended Citation
Levin, Jessica Rae, "The Effect of the Secondary Coordination Sphere on the Stabilities of Cerium(III) and Cerium(IV) Coordination Complexes" (2015).Publicly Accessible Penn Dissertations. 1844.
The Effect of the Secondary Coordination Sphere on the Stabilities of
Cerium(III) and Cerium(IV) Coordination Complexes
Abstract
The lanthanides, the elements from La–Lu, have intrinsic properties that make them desirable components in many technological applications as well as useful catalysts. However, lanthanides can form unpredictable solid state and solution structures due to their ionic, non-directional, and kinetically labile bonds with ligands, which hampers the development of structure-function relationships. To enhance the stability of the
lanthanide bonds, the use of the secondary coordination sphere about lanthanide complexes, including alkali metal cations lithium, sodium, and potassium, as well as hydrogen bonding guanidinium cations, as a framework to guide lanthanide-ligand bonding interactions was studied. This work can be applied to lanthanide coordination and redox chemistries.
Degree Type Dissertation
Degree Name
Doctor of Philosophy (PhD)
Graduate Group Chemistry
First Advisor Eric J. Schelter
Keywords
cerium, coordination chemistry, electrochemistry, redox chemistry
Subject Categories
Chemistry | Inorganic Chemistry
r '
THE EFFECT OF THE SECONDARY COORDINATION SPHERE ON THE STABILITIES OF CERIUM(III) AND CERIUM(IV) COORDINATION COMPLEXES
Jessica R. Levin A DISSERTATION
in Chemistry
Presented to the Faculties of the University of Pennsylvania in
Partial Fulfillment of the Requirements for the Degree of Doctor of Philosophy
2015
Gary A. Moland , Hirschmann-Makineni Professor of Chemistry
Dissertation Committee:
Donald H. Berry, Professor of Chemistry
! !
THE EFFECT OF THE SECONDARY COORDINATION SPHERE ON THE
STABILITIES OF CERIUM(III) AND CERIUM(IV) COORDINATION COMPLEXES COPYRIGHT
2015
Jessica R. Levin
This work is licensed under the Creative Commons Attribution- NonCommercial-ShareAlike 3.0 License
To view a copy of this license, visit
iii ACKNOWLEDGMENTS
Marie Curie said:
“You cannot hope to build a better world without improving the individuals. To that end each of us must work for his own improvement, and at the same time share a general responsibility for all humanity, our particular duty being to aid those to whom we think we can be most useful.”
I would like to thank my advisor, Dr. Eric J. Schelter, for helping me to improve not only myself, but the many individuals in our group. His efforts at my improvement have taught me much about chemistry and about myself. Additionally, I would like to thank my previous and current committee members, Dr. Donald H. Berry, Larry G. Sneddon, So-Jung Park, and Daniel J. Mindiola, as well as Dr. Christopher Graves for advising me over the years, and taking the time to help me advance my chemistry. I also thank my former advisor, Dr. Francis J. DiSalvo at Cornell University, for his guidance and his interest in my development in chemistry.
I don’t think I could have done any of my work without the help of Dr. Patrick J. Carroll solving impossible structures; Drs. Jun Gu and George Furst for teaching me tons NMR techniques and magically fixing all of the instruments; and Judith Currano for helping me search the literature and for being a great Women in Chemistry advisor.
I am grateful to my labmates in the Schelter group, particularly those in my year, Jee Eon Kim and Justin A. Bogart, for being there so I can ask my stupid questions and for keeping me sane. Special thanks to Dr. David S. Weinberger for editing my rough drafts of papers and Walter L. Dorfner for working with me to collect magnetism data and prepare samples.
iv
ABSTRACT
THE EFFECT OF THE SECONDARY COORDINATION SPHERE
ON THE STABILITIES OF CERIUM(III) AND CERIUM(IV)
COORDINATION COMPLEXES
Jessica R. Levin Eric J. Schelter
The lanthanides, the elements from La–Lu, have intrinsic properties that make them desirable components in many technological applications as well as useful catalysts. However, lanthanides can form unpredictable solid state and solution structures due to their ionic, non-directional, and kinetically labile bonds with ligands, which hampers the development of structure-function relationships. To enhance the stability of the
v
Table of Contents
ACKNOWLEDGMENT ... iii
ABSTRACT ... iv
LIST OF TABLES ... ix
LIST OF FIGURES ... xiv
LIST OF SCHEMES ... xlvi CHAPTER 1 INTRODUCTION AND OUTLINE OF THE DISSERTATION ... 1
1.1 Why Study the Lanthanides? ... 1
1.2 Introduction. Properties of the Lanthanides ... 2
1.3 Outline of the Dissertation ... 12
1.4 Bibliography ... 16
CHAPTER 2 STABILIZATION OF LANTHANIDE NAPHTHOLATE COMPLEXES THROUGH INTERLIGAND NON-COVALENT INTERACTIONS ... 23
Abstract ... 23
2.1 Introduction. ... 24
2.2 Results ... 25
2.2.1. Syntheses and structural characterization of Li3(py)6[Ce(Onaph)6] and Li4(DME)4[Ce2(Onaph)10]. ... 25
vi 2.2.3. Solution characterization of complexes Li3(py)6[Ln(Onaph)6] Ln = La (2.4), Ln = Ce (2.1); Li4(DME)4[Ln2(Onaph)10] Ln = La (2.5), Ln = Ce (2.2); and [HTMG]3[Ln2(Onaph)9] Ln
= La (2.6), Ln = Ce (2.3) ... 34
2.2.4. Syntheses and structural characterization of complexes Na3(py)6[Ce(Onaph)6] (2.7), Na4(DME)4[Ce2(Onaph)10] (2.8), K3(py)6[Ce2(Onaph)9(py)2] (2.9), and K6(DME)4[Ce2Onaph)12] (2.10). ... 36
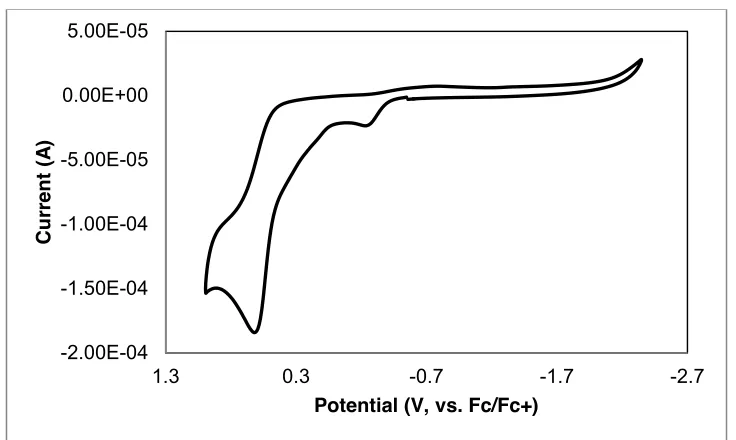
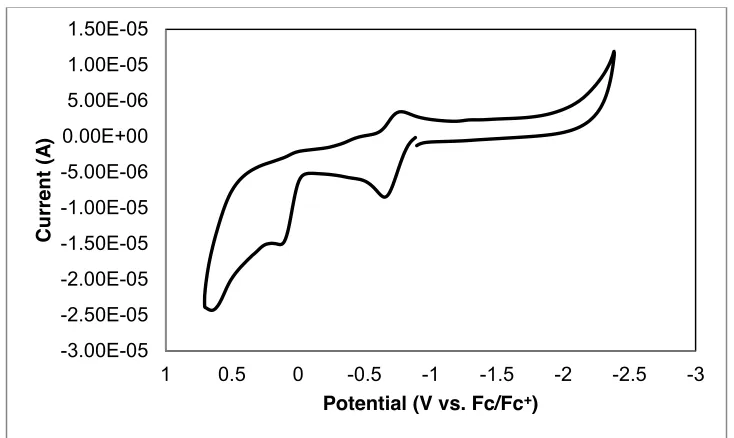
2.2.5. Cyclic voltammetry of complexes 2.1–2.10. ... 43
2.3 Discussion and Conclusions ... 45
2.4 Experimental Section ... 47
2.5 Bibliography ... 93
CHAPTER 3 COMPARISON OF LANTHANIDE(III) NAPHTHOLATE SOLUTION STRUCTURES ... 96
Abstract ... 96
3.1 Introduction. ... 97
3.2 Results and Discussion ... 99
3.2.1. Competition Experiments between Alkali Metal Cations and (HTMG)+ ... 99
3.2.2. Solution Structure of Lanthanide Naphtholate Complexes ... 108
3.3 Conclusions ... 111
3.4 Experimental Section ... 112
3.5 Bibliography ... 197
CHAPTER 4 CONTROL OF CERIUM OXIDATION STATE THROUGH METAL COMPLEX SECONDARY STRUCTURES ... 201
Abstract ... 201
4.1 Introduction. ... 202
vii
4.2.1. Synthesis of M4-5(sol)[Ce(PhNNPh)4] ... 204
4.2.2. Structural characterization of M4-5(sol)[Ce(PhNNPh)4]... 208
4.2.3. Balancing the chemical equation. ... 216
4.2.4. Oxidation state assignment using magnetic measurements and XAS spectroscopy. ... 219
4.2.5. Spectroscopic and electrochemical characterization. ... 221
4.2.6. Ce(IV) and alkali metal cation exchange reactions. ... 229
4.3 Conclusions ... 235
4.4 Experimental Section ... 236
4.5 Bibliography ... 305
CHAPTER 5 ACCESSING ELECTRON POOR CERIUM(IV) COMPLEXES BY ALKALI METAL PROMOTED LIGAND REDUCTION ... 313
Abstract ... 313
5.1 Introduction. ... 314
5.2 Results and Discussion ... 317
5.2.1. Synthesis of ligands and complexes 5.1–5.4. ... 317
5.2.2. Structural characterization of complexes 5.1–5.4 ... 324
5.2.3. Spectroscopic and Electrochemical Characterization of Complexes 5.1–5.4. ... 327
5.3 Conclusions ... 332
5.4 Experimental Section ... 332
5.5 Bibliography ... 383
CHAPTER 6 DENSITY FUNCTIONAL THEORY AS A PREDICTIVE TOOL FOR CERIUM REDOX PROPERTIES IN NON-AQUEOUS SOLVENTS ... 390
Abstract ... 390
viii
6.2 Results ... 393
6.2.1. Pseudo 4-coordinate semi-empirical models in dichloromethane.. ... 393
6.2.2. Synthesis and characterization of Ce(O-DiNOx)2 ... 400
6.2.3. Non-aqueous correlations of the CeIV/III reduction potentials. ... 403
6.3 Conclusions ... 406
6.4 Experimental Section ... 407
6.5 Bibliography ... 495
APPENDIX AQUEOUS LANTHANIDE CARBONATE CHEMISTRY. ATTEMPTS TO ISOLATE AND STABILIZE Tb(IV) AND Pr(IV) CARBONATE COMPLEXES ... 500
A1.1 Introduction. ... 500
A1.2 Results ... 500
A1.2.1. Repeating and expanding on Hobart and coworkers’ results ... 500
A1.2.2. Switching K2CO3 for the hydrogen bond donor guanidine carbonate ... 503
A1.2.3. Comparing carbonate with other inorganic salts. ... 508
A1.2.4. Alternative strong oxidants. ... 510
A1.3 Conclusions ... 514
ix
List of Tables
Table 1.2.1. Standard reduction potentials of LnIV/III and LnIII/II versus NHE ... 11
Table 2.2.1. Summary of the 7Li NMR data for complexes 2.1 and 2.2 ... 30
Table 2.2.2. Results of DOSY 1H NMR experiments performed in CDCl3 for complexes 2.3− 2.6. ... 36
Table 2.2.3. A summary of cyclic voltammetry (CV) data of complexes 2.1–2.10 collected in ~0.1 M [nPr4N][B(3,5-(CF3)2-C6H3)4] in methylene chloride ... 44
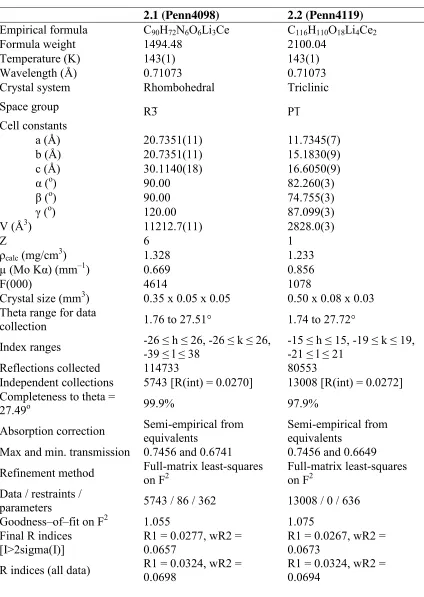
Table 2.4.1. Crystallographic parameters for compounds 2.1 and 2.2. ... 59
Table 2.4.2. Crystallographic parameters for compounds 2.3. ... 60
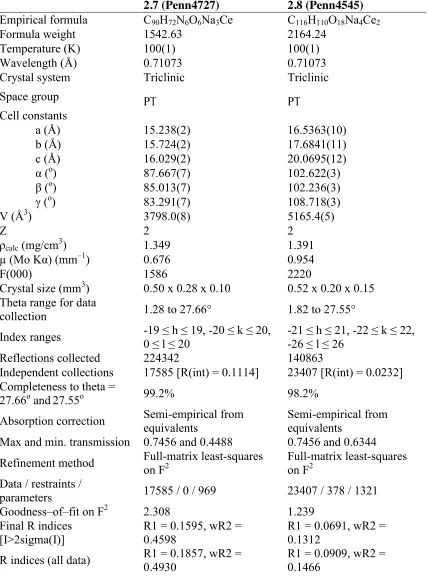
Table 2.4.3. Crystallographic parameters for compounds 2.7 and 2.8. ... 61
Table 2.4.4. Crystallographic parameters for compounds 2.9 and 2.10. ... 62
Table 3.2.1. 2D 1H-1H EXSY NMR spectroscopy self-exchange rate and activation parameters for complex 3.8−3.9 ... 110
Table 3.4.1. Crystallographic parameters for compounds 3.8 and 3.9. ... 124
Table 3.4.2. Crystallographic parameters for compounds 3.12. ... 126
Table 4.2.1. Unique Ce(1)–N and N–N bonds of complexes 4.1.1, 4.1.2, 4.2, and 4.3 measured by X-ray crystallography or DFT calculations. ... 215
Table 4.2.2. Energies of the N–N stretch vibrational modes of 4.1, 4.2, and 4.3 determined experimentally and by calculations. ... 225
Table 4.4.1. Evans’ method results for complexes 4.1.2, 4.2, and 4.3.. ... 243
x Table 4.4.3. Crystallographic parameters for compounds 4.2 and 4.3.. ... 248 Table 4.4.4. Crystallographic parameters for the lithium cluster
Li(py)4[Li5(PhNNPh)3(py)3] (Penn4392)... 249 Table 4.4.5. Shape parameters for complexes 4.1.2, 4.2, and 4.3. ... 252 Table 4.4.6. Ce–N average bond lengths and τ4 values for both the experimental and calculated complexes. ... 253 Table 4.4.7. Optimized coordinates (calculated) for Li4(OMe2)4[Ce(PhNNPh)4] (4.1.3). ... 254 Table 4.4.8. Optimized coordinates (calculated) for Na4(OMe2)4[Ce(PhNNPh)4] (4.2.2). ... 260 Table 4.4.9. Optimized coordinates (calculated) for K4(OMe2)4[Ce(PhNNPh)4] (4.3.2+). ... 265 Table 4.4.10. Optimized coordinates (calculated) for Li4(OMe2)4[Ce(PhNNPh)4]– (4.1.3– ). ... 270 Table 4.4.11. Optimized coordinates (calculated) for Na4(OMe2)4[Ce(PhNNPh)4]–
xi Table 5.2.2. Energy of the ligand to metal charge transfer transition, energy of the N–N stretching mode, potential of the CeIV/III redox couple, and Epc–Epa (ΔE) of complexes 5.1, 5.2, 5.3, and 5.4 measured by UV-Vis spectroscopy, FTIR spectroscopy, and cyclic voltammetry respectively. ... 329 Table 5.4.1. Crystallographic parameters for Me2ArN=NArMe2 and complex 5.2. ... 347 Table 5.4.2. Crystallographic parameters for complexes 5.3 and 5.4.. ... 348 Table 5.4.3. Table of Evans’ method results for complexes 5.2–5.4, with
hexamethyldisiloxane as the internal standard... ... 350 Table 5.4.4. Optimized coordinates (calculated) for Li4(OMe2)4[Ce(ClArNNArCl)4]... . 364 Table 5.4.5. Optimized coordinates (calculated) for Li4(OMe2)4[Ce(Cl2ArNNArCl2)4]... ... 369 Table 5.4.6. Optimized coordinates (calculated) for Li4(OMe2)4[Ce(ArFNNArF)4]... ... 374 Table 5.4.7. Crystallographic parameters for {[Li(THF)]2[BocNNBoc]}n... ... 382 Table 6.2.1. Experimental E1/2 and Epc values, and calculated E1/2 and LUMO energies for 4-coordinate and one octahedral complexes.... ... 399 Table 6.2.2. Correlations of the calculated E1/2 and LUMO energies with experimental reduction potentials of pseudo-tetrahedral cerium complexes measured in
dichloromethane.... ... 400 Table 6.2.3. Correlations of the calculated E1/2 and LUMO energies with experimental reduction potentials of cerium complexes measured in dichloromethane and
xii Table 6.4.2. Computed Thermal Free Energies, G, and ΔG values for the series of
4-coordinate and pseudo-4-4-coordinate cerium complexes.... ... 421
Table 6.4.3. Optimized coordinates of Ce[N(SiHMe2)2]4.... ... 422
Table 6.4.4. Optimized coordinates of Li(THF)[Ce(NiPr2)4]+ ... 425
Table 6.4.5. Optimized coordinates of Ce(NiPr2)4. ... 429
Table 6.4.6. Optimized coordinates of Ce[N(SiMe3)2]3Br ... 432
Table 6.4.7. Optimized coordinates of Ce[N(SiMe3)2]3Cl. ... 434
Table 6.4.8. Optimized coordinates of Ce[N(SiMe3)2]3F... 437
Table 6.4.9. Optimized coordinates of Ce(OAr)4, OAr = 2,6-diphenylphenol. ... 440
Table 6.4.10. Optimized coordinates of Li(THF)2[Ce(MBP)2(THF)2]+. ... 445
Table 6.4.11. Optimized coordinates of Ce(MBP)2(THF)2. ... 450
Table 6.4.12. Optimized coordinates of Ce(O-DiNOx)2. ... 455
Table 6.4.13. Optimized coordinates of Ce[N(SiHMe2)2]4–... 459
Table 6.4.14. Optimized coordinates of Li(THF)[Ce(NiPr2)4] ... 462
Table 6.4.15. Optimized coordinates of Ce(NiPr2)4–. ... 465
Table 6.4.16. Optimized coordinates of Ce[N(SiMe3)2]3Br– ... 468
Table 6.4.17. Optimized coordinates of Ce[N(SiMe3)2]3Cl–. ... 471
Table 6.4.18. Optimized coordinates of Ce[N(SiMe3)2]3F–. ... 474
Table 6.4.19. Optimized coordinates of Ce(OAr)4–, OAr = 2,6-diphenylphenol. ... 477
Table 6.4.20. Optimized coordinates of Li(THF)2[Ce(MBP)2(THF)2]. ... 481
Table 6.4.21. Optimized coordinates of Ce(MBP)2(THF)2–. ... 487
xiii Table A1.2.1. Summary of cyclic voltammetry data of CeCl3•6H2O in a variety of
xiv
List of Figures
Figure 1.2.1. Abundance of the elements in the Earth’s crust ... 3
Figure 1.2.2. Radial extent of the 4d, 5d, 6s, and 6p orbitals for a Sm3+ cation ... 4
Figure 1.2.3. Thermal ellipsoid plots of [Tb(H2O)9]3+ and [Mn(H2O)6]2+ complexes ... 5
Figure 1.2.4. Plot of the ionic radius for 9-coordinate lanthanoids and the –ΔHhydration for the lanthanide series ... 7
Figure 1.2.5. Water exchange rate constants, kH2O, for water molecules in the primary coordination sphere ... 8
Figure 1.2.6. Ce(III/IV) oxidation potentials for cerium complexes in non-aqueous and aqueous conditions ... 12
Figure 2.2.1. 30 % thermal ellipsoid plot of Li3(py)6[Ce(Onaph)6] (2.1) ... 27
Figure 2.2.2. 30 % thermal ellipsoid plot of Li4(DME)4[Ce2(Onaph)10] (2.2) ... 29
Figure 2.2.3. 30 % thermal ellipsoid plot of [HTMG]3[Ce2(Onaph)9] (2.3) ... 32
Figure 2.2.4. 1H NMR spectra of complexes 2.1–2.3 recorded in CDCl3 ... 34
Figure 2.2.5. 30 % thermal ellipsoid plot of Na3(py)6[Ce(Onaph)6] (2.7) ... 39
Figure 2.2.6. 30 % thermal ellipsoid plot of Na4(DME)4[Ce2(Onaph)10] (2.8) ... 40
Figure 2.2.7. 30 % thermal ellipsoid plot of K3(py)6[Ce2(Onaph)9(py)2] (2.9) ... 41
Figure 2.2.8. 30 % thermal ellipsoid plot of {K6(DME)4[Ce2(Onaph)12]}n (2.10) ... 42
xv Figure 2.4.1. Cyclic voltammetry of Li3(py)6[Ce(Onaph)6] (2.1) in methylene chloride and 0.1 M ([nPr4N][BArF4]) ... 49 Figure 2.4.2. Scan rate dependence of the CeIII/IV redox wave of Li3(py)6[Ce(Onaph)6] (2.1) in methylene chloride and 0.1 M ([nPr4N][BArF4]) ... 50 Figure 2.4.3. Differential pulse voltammogram of Li3(py)6[Ce(Onaph)6] (2.1) in
methylene chloride and 0.1 M ([nPr4N][BArF4]) ... 50 Figure 2.4.4. Cyclic voltammetry of Li4(DME)4[Ce2(Onaph)10] (2.2) in methylene
chloride and 0.1 M ([nPr4N][BArF4]). Scan rate was 500 mV/s ... 51 Figure 2.4.5. Scan rate dependence of the CeIII/IV redox wave of
xvi Figure 2.4.11. Differential pulse voltammogram of Na3(py)6[Ce(Onaph)6] (2.7) in
methylene chloride and 0.1 M ([nPr4N][BArF4]) ... 54 Figure 2.4.12. Cyclic voltammetry of Na4(DME)4[Ce2(Onaph)10] (2.8) in methylene chloride and 0.1 M ([nPr4N][BArF4]). Scan rate was 100 mV/s ... 55 Figure 2.4.13. Scan rate dependence of the CeIII/IV redox wave of
Na4(DME)4[Ce2(Onaph)10] (2.8) in methylene chloride and 0.1 M ([nPr4N][BArF4]). Scan rates ranged from 25–1000 mV/s ... 55
Figure 2.4.14. Cyclic voltammetry of K3(py)6[Ce2(Onaph)9(py)2] (2.9) in methylene chloride and 0.1 M ([nPr4N][BArF4]). Scan rate was 100 mV/s ... 56 Figure 2.4.15. Scan rate dependence of the CeIII/IV redox wave of
K3(py)6[Ce2(Onaph)9(py)2] (2.9) in methylene chloride and 0.1 M ([nPr4N][BArF4]). Scan rates ranged from 25–1000 mV/s ... 56
Figure 2.4.16. Cyclic voltammetry of K6(DME)4[Ce2(Onaph)12] (2.10) in methylene chloride and 0.1 M ([nPr4N][BArF4]). Scan rate was 100 mV/s ... 57 Figure 2.4.17. Scan rate dependence of the CeIII/IV redox wave of
K6(DME)4[Ce2(Onaph)12] (2.10) in methylene chloride and 0.1 M ([nPr4N][BArF4]). Scan rates ranged from 25–1000 mV/s ... 57
Figure 2.4.18. 1H NMR spectrum of Li3(py)6[Ce(Onaph)6] (2.1) collected in CDCl3 ... 64
Figure 2.4.19. 7Li NMR spectrum and 13C NMR spectrum of Li3(py)6[Ce(Onaph)6] (2.1) collected in CDCl3 ... 65
xvii Figure 2.4.21. 7Li NMR (left) and 13C NMR (right) spectra of Li4(DME)4[Ce2(Onaph)10] (2.2) collected in CDCl3 ... 67
Figure 2.4.22. 1H NMR spectrum of [HTMG]3[Ce2(Onaph)9] (2.3) crystallized from THF collected in CDCl3 ... 68 Figure 2.4.23. 1H NMR spectrum of [HTMG]3[Ce2(Onaph)9] (2.3) crystallized from DME and pyridine collected in CDCl3 ... 69 Figure 2.4.24. 1H NMR spectrum of [HTMG]3[Ce2(Onaph)9] (2.3) crystallized from DME collected in in THF–d8 and pyridine–d5 ... 70 Figure 2.4.25. 13C NMR spectrum of [HTMG]3[Ce2(Onaph)9] (2.3) crystallized from THF collected in CDCl3 ... 71 Figure 2.4.26. 1H NMR spectrum of Li3(py)6[La(Onaph)6] (2.4) collected in CDCl3 ... 72 Figure 2.4.27. 7Li NMR spectrum and 13C NMR spectrum of Li3(py)6[La(Onaph)6] (2.4) collected in CDCl3 ... 73 Figure 2.4.28. 1H NMR spectrum of Li4(DME)4[La2(Onaph)10] (2.5) collected in CDCl3 ... 74 Figure 2.4.29. 7Li NMR and 13C NMR spectra of Li4(DME)4[La2(Onaph)10] (2.5)
xviii
Figure 2.4.33. 13C NMR of Na3(py)6[Ce(Onaph)6] (2.7) in CDCl3 ... 78
Figure 2.4.34. 1H NMR of Na4(DME)4[Ce2(Onaph)10] (2.8) in CDCl3 ... 79
Figure 2.4.35. 13C NMR of Na4(DME)4[Ce2(Onaph)10] (2.8) in CDCl3 ... 80
Figure 2.4.36. 1H NMR of K3(py)6[Ce2(Onaph)9(py)2] (2.9) in CDCl3 ... 81
Figure 2.4.37. 13C NMR of K3(py)6[Ce2(Onaph)9(py)2] (2.9) in CDCl3 ... 82
Figure 2.4.38. 1H NMR of K6(DME)4[Ce2(Onaph)12] (2.10) in CDCl3... 83
Figure 2.4.39. Representative 1H DOSY NMR spectrum of [HTMG]3[Ce2(Onaph)9] (2.3) in CDCl3 with benzene as an internal reference ... 85
Figure 2.4.40. Representative 1H DOSY NMR spectrum of Li3(py)6[La(Onaph)6] (2.4) in CDCl3 with benzene as an internal reference ... 85
Figure 2.4.41. Representative 1H DOSY NMR spectrum of Li4(DME)4[La2(Onaph)10] (2.5) in CDCl3 with benzene as an internal reference ... 86
Figure 2.4.42. Representative 1H DOSY NMR spectrum of [HTMG]3[La2(Onaph)9] (2.6) in CDCl3 with benzene as an internal reference ... 86
Figure 2.4.43. Stacked plot of the 1H NMR spectra in CDCl3 of lanthanum naphtholate complexes with the following hydrogen bonded aminiums: tBuNH 3+, diisopropylaminium, and piperidinium. These reactions took place in toluene ... 87
Figure 2.4.44. 1H NMR spectrum in CDCl3 of the piperidinium cerium naphtholate complex. The reaction took place in toluene ... 88
Figure 2.4.45. 1H NMR spectrum in CDCl3 of an attempt to synthesize diisopropylaminium cerium naphtholate complex. The reaction took place in toluene ... 88
xix Figure 2.4.47. 1H NMR spectrum in CDCl3 of the attempt to form a
(1,3-diphenylguanidinium)+ cerium naphtholate complex ... 89
Figure 2.4.48. 1H NMR spectrum in C6D6 of the attempt to oxidize Li3(py)6[Ce(Onaph)6] (2.1) with I2 ... 90
Figure 2.4.49. 1H NMR spectrum in CDCl3 of the attempt to oxidize (HTMG)3[Ce2(Onaph)9] (2.3) with Ph3CCl ... 90
Figure 2.4.50. 1H NMR spectrum and 19F NMR spectrum in pyridine-d5 of the attempt to oxidize (HTMG)3[Ce2(Onaph)9] (2.3) with FcBArF4 ... 91
Figure 2.4.51. 1H NMR spectrum in C6D6 of the attempt to synthesize a (HTMG)+ cerium mentholate complex ... 91
Figure 2.4.52. 1H NMR spectrum in pyridine-d5 of the attempt to synthesize a Li+ cerium mentholate complex ... 92
Figure 2.4.53. 1H NMR spectrum in C6D6 of the attempt to synthesize a cerium mentholate complex ... 92
Figure 2.4.54. Stacked plot of 1H NMR spectrum in C6D6 of the attempt to synthesize an (HTMG)+ Ce(III) tOBu complex. The number of equivalents of TMG added increases from 0–3 from the bottom to the top ... 93
Figure 3.2.1. Crystal structure of [Na2(DME)2][HTMG][Ce2(Onaph)9(TMG)2] (3.12) 103 Figure 3.4.1. 1H NMR of K3(py)6[Eu2(Onaph)9(py)2] (3.8) in CDCl3 ... 117
Figure 3.4.2. 13C NMR of K3(py)6[Eu2(Onaph)9(py)2] (3.8) in CDCl3 ... 118
Figure 3.4.3. 1H NMR of K3(py)6[Pr2(Onaph)9(py)2] (3.9) in CDCl3 ... 119
Figure 3.4.4. 13C NMR of K3(py)6[Pr2(Onaph)9(py)2] (3.9) in CDCl3... 120
xx Figure 3.4.6. 13C NMR of (HTMG)3[Eu2(Onaph)9] (3.10) in CDCl3 ... 122 Figure 3.4.7. 1H NMR of (HTMG)3[Pr2(Onaph)9] (3.11) in CDCl3 ... 123 Figure 3.4.8. 13C NMR of (HTMG)3[Pr2(Onaph)9] (3.11) in CDCl3 ... 124 Figure 3.4.9. Stacked plot of 1H NMR spectra in CDCl3 of (HTMG)3[Ce2(Onaph)9] (3.1), complex 3.1 with 3 equiv LiOTf and 1 equiv LiOnaph stirred for 1 hr in DME, and Li4(DME)4[Ce2(Onaph)10] (3.2) ... 127 Figure 3.4.10. Stacked plot of 7Li NMR spectra in CDCl3 of Li4(DME)4[Ce2(Onaph)10] (3.2), and complex 3.1 with 3 equiv LiOTf and 1 equiv LiOnaph stirred for 1 hr in DME ... 128 Figure 3.4.11. Stacked plot of 1H NMR spectra in CDCl3 of (HTMG)3[Ce2(Onaph)9] (3.1) with 3 equiv LiOTf and 1 equiv LiOnaph stirred for 1 hr in DME, and complex 3.1 mixed with 1 equiv LiOnaph stirred for 1 hr in DME ... 128 Figure 3.4.12. Stacked plot of 7Li NMR spectra in CDCl3 of (HTMG)3[Ce2(Onaph)9] (3.1) with 3 equiv LiOTf and 1 equiv LiOnaph stirred for 1 hr in DME, and complex 3.1 mixed with 1 equiv LiOnaph stirred for 1 hr in DME ... 129 Figure 3.4.13. Stacked plot of 1H NMR spectra in proteo DME of
(HTMG)3[Ce2(Onaph)9] (3.1) at the top, complex 3.1 with 3 equiv LiOTf and 1 equiv LiOnaph stirred for 1 hr in DME at the middle, and Li4(DME)4[Ce2(Onaph)10] (3.2) shown at the bottom ... 129 Figure 3.4.14. Stacked plot of 7Li NMR spectra in proteo DME of
xxi Figure 3.4.15. Stacked plot of 1H NMR spectra in proteo DME of
(HTMG)3[Ce2(Onaph)9] (3.1) with 3 equiv LiOTf and 1 equiv LiOnaph stirred for 1 hr in DME at the top, and complex 3.1 mixed with 1 equiv LiOnaph stirred for 1 hr in DME at the bottom ... 130 Figure 3.4.16. Stacked plot of 7Li NMR spectra in proteo DME of
(HTMG)3[Ce2(Onaph)9] (3.1) with 3 equiv LiOTf and 1 equiv LiOnaph stirred for 1 hr in DME at the top, and complex 3.1 mixed with 1 equiv LiOnaph stirred for 1 hr in DME at the bottom ... 131 Figure 3.4.17. Stacked plot of 1H NMR spectra in CDCl3 of (HTMG)3[Ce2(Onaph)9] (3.1) at the top, complex 3.1 with 3 equiv NaOTf and 1 equiv NaOnaph stirred for 1 hr in DME at the middle, and Na4(DME)4[Ce2(Onaph)10] (3.3) shown at the bottom ... 131 Figure 3.4.18. Stacked plot of 1H NMR spectra in CDCl3 of (HTMG)3[Ce2(Onaph)9] (3.1) with 3 equiv NaOTf and 1 equiv NaOnaph stirred for 1 hr in DME at the top, and complex 3.1 mixed with 1 equiv NaOnaph stirred for 1 hr in DME at the bottom ... 132 Figure 3.4.19. Stacked plot of 1H NMR spectra in proteo DME of
(HTMG)3[Ce2(Onaph)9] (3.1) at the top, complex 3.1 with 3 equiv NaOTf and 1 equiv NaOnaph stirred for 1 hr in DME at the middle, and Na4(DME)4[Ce2(Onaph)10] (3.3) shown at the bottom ... 132 Figure 3.4.20. Stacked plot of 1H NMR spectra in proteo DME of
xxii Figure 3.4.21. Stacked plot of 1H NMR spectra in CDCl3 of (HTMG)3[Ce2(Onaph)9] (3.1) at the top, complex 3.1 with 3 equiv KOTf and 3 equiv KOnaph stirred for 1 hr in DME at the middle, and K6(DME)4[Ce2(Onaph)12] (3.4) shown at the bottom ... 133 Figure 3.4.22. Stacked plot of 1H NMR spectra in CDCl3 of (HTMG)3[Ce2(Onaph)9] (3.1) with 3 equiv KOTf and 3 equiv KOnaph stirred for 1 hr in DME at the top, and (HTMG)3[Ce2(Onaph)9] (3.1) with 3 equiv KOnaph stirred for 1 hr in DME shown at the bottom ... 134 Figure 3.4.23. Stacked plot of 1H NMR spectra in proteo DME of
(HTMG)3[Ce2(Onaph)9] (3.1) at the top, complex 3.1 with 3 equiv KOTf and 3 equiv KOnaph stirred for 1 hr in DME at the middle, and K6(DME)4[Ce2(Onaph)12] (3.4)
shown at the bottom ... 134 Figure 3.4.24. Stacked plot of 1H NMR spectra in proteo DME of
xxiii (HTMG)3[Ce2(Onaph)9] (3.1) with 3 equiv LiOnaph stirred for 1 hr in pyridine shown at the bottom ... 137 Figure 3.4.28. Stacked plot of 7Li NMR spectra in CDCl3 of (HTMG)3[Ce2(Onaph)9] (3.1) with 3 equiv LiOTf and 3 equiv LiOnaph stirred for 1 hr in pyridine at the top, and (HTMG)3[Ce2(Onaph)9] (3.1) with 3 equiv LiOnaph stirred for 1 hr in pyridine shown at the bottom ... 137 Figure 3.4.29. Stacked plot of 1H NMR spectra in pyridine-d5 of (HTMG)3[Ce2(Onaph)9] (3.1) at the top, complex 3.1 with 3 equiv LiOTf and 3 equiv LiOnaph stirred for 1 hr in pyridine at the middle, and Li3(py)6[Ce(Onaph)6] (3.5) shown at the bottom ... 138 Figure 3.4.30. Stacked plot of 7Li NMR spectra in pyridine-d5 of Li3(py)6[Ce(Onaph)6] (3.5) shown at the top, and (HTMG)3[Ce2(Onaph)9] (3.1) with 3 equiv LiOTf and 3 equiv LiOnaph stirred for 1 hr in pyridine at the bottom... 138 Figure 3.4.31. Stacked plot of 1H NMR spectra in pyridine-d5 of (HTMG)3[Ce2(Onaph)9] (3.1) with 3 equiv LiOTf and 3 equiv LiOnaph stirred for 1 hr in pyridine at the top, and (HTMG)3[Ce2(Onaph)9] (3.1) with 3 equiv LiOnaph stirred for 1 hr in pyridine shown at the bottom ... 139 Figure 3.4.32. Stacked plot of 7Li NMR spectra in pyridine-d5 of
xxiv Figure 3.4.34. Stacked plot of 1H NMR spectra in CDCl3 of (HTMG)3[Ce2(Onaph)9] (3.1) with 3 equiv NaOTf and 3 equiv NaOnaph stirred for 1 hr in pyridine at the top, and (HTMG)3[Ce2(Onaph)9] (3.1) with 3 equiv NaOnaph stirred for 1 hr in pyridine shown at the bottom ... 141 Figure 3.4.35. Stacked plot of 1H NMR spectra in pyridine-d5 of (HTMG)3[Ce2(Onaph)9] (3.1) at the top, complex 3.1 with 3 equiv NaOTf and 3 equiv NaOnaph stirred for 1 hr in pyridine at the middle, and Na3(py)6[Ce(Onaph)6] (3.6) shown at the bottom... 142 Figure 3.4.36. Stacked plot of 1H NMR spectra in pyridine-d5 of (HTMG)3[Ce2(Onaph)9] (3.1) with 3 equiv NaOTf and 3 equiv NaOnaph stirred for 1 hr in pyridine at the top, and (HTMG)3[Ce2(Onaph)9] (3.1) with 3 equiv NaOnaph stirred for 1 hr in pyridine shown at the bottom ... 143 Figure 3.4.37. Stacked plot of 1H NMR spectra in CDCl3 of (HTMG)3[Ce2(Onaph)9] (3.1) at the top, complex 3.1 with 4 equiv LiOTf and 1 equiv HOnaph stirred for 1 hr in DME at the middle, and Li4(DME)4[Ce2(Onaph)10] (3.2) shown at the bottom... 144 Figure 3.4.38. Stacked plot of 7Li NMR spectra in CDCl3 of Li4(DME)4[Ce2(Onaph)10] (3.2) at the top, and (HTMG)3[Ce2(Onaph)9] (3.1) with 4 equiv LiOTf and 1 equiv
HOnaph stirred for 1 hr in DME at the bottom ... 144 Figure 3.4.39. Stacked plot of 1H NMR spectra in proteo DME of
xxv Figure 3.4.40. Stacked plot of 7Li NMR spectra in proteo DME of
Li4(DME)4[Ce2(Onaph)10] (3.2) at the top, and (HTMG)3[Ce2(Onaph)9] (3.1) with 4
equiv LiOTf and 1 equiv HOnaph stirred for 1 hr in DME at the bottom ... 145
Figure 3.4.41. Stacked plot of 1H NMR spectra in CDCl3 of (HTMG)3[Ce2(Onaph)9]
(3.1) at the top, complex 3.1 with 4 equiv NaOTf and 1 equiv HOnaph stirred for 1 hr in DME at the middle, and Na4(DME)4[Ce2(Onaph)10] (3.3) shown at the bottom ... 146
Figure 3.4.42. Stacked plot of 1H NMR spectra in proteo DME of
(HTMG)3[Ce2(Onaph)9] (3.1) at the top, complex 3.1 with 4 equiv NaOTf and 1 equiv
HOnaph stirred for 1 hr in DME at the middle, and Na4(DME)4[Ce2(Onaph)10] (3.3)
shown at the bottom ... 147
Figure 3.4.43. Stacked plot of 1H NMR spectra in CDCl3 of (HTMG)3[Ce2(Onaph)9]
(3.1) at the top, complex 3.1 with 6 equiv KOTf and 1 equiv HOnaph stirred for 1 hr in DME at the middle, and K6(DME)4[Ce2(Onaph)12] (3.4) shown at the bottom ... 148
Figure 3.4.44. Stacked plot of 1H NMR spectra in proteo DME of
(HTMG)3[Ce2(Onaph)9] (3.1) at the top, complex 3.1 with 6 equiv KOTf and 1 equiv
HOnaph stirred for 1 hr in DME at the middle, and K6(DME)4[Ce2(Onaph)12] (3.4)
shown at the bottom ... 149
Figure 3.4.45. Stacked plot of 1H NMR spectra in CDCl3 of (HTMG)3[Ce2(Onaph)9]
(3.1) at the top, complex 3.1 with 6 equiv LiOTf and 3 equiv HOnaph stirred for 1 hr in
pyridine at the middle, and Li3(py)6[Ce(Onaph)6] (3.5) shown at the bottom ... 150
Figure 3.4.46. Stacked plot of 7Li NMR spectra in CDCl3 of Li3(py)6[Ce(Onaph)6] (3.5)
at the top, and (HTMG)3[Ce2(Onaph)9] (3.1) with 6 equiv LiOTf and 3 equiv HOnaph
xxvi Figure 3.4.47. Stacked plot of 1H NMR spectra in pyridine-d5 of (HTMG)3[Ce2(Onaph)9]
(3.1) at the top, complex 3.1 with 6 equiv LiOTf and 3 equiv HOnaph stirred for 1 hr in pyridine at the middle, and Li3(py)6[Ce(Onaph)6] (3.5) shown at the bottom ... 151
Figure 3.4.48. Stacked plot of 7Li NMR spectra in pyridine-d5 of Li3(py)6[Ce(Onaph)6]
(3.5) at the top, and (HTMG)3[Ce2(Onaph)9] (3.1) with 6 equiv LiOTf and 3 equiv
HOnaph stirred for 1 hr in pyridine shown at the bottom ... 151
Figure 3.4.49. Stacked plot of 1H NMR spectra in CDCl3 of (HTMG)3[Ce2(Onaph)9]
(3.1) at the top, complex 3.1 with 6 equiv NaOTf and 3 equiv HOnaph stirred for 1 hr in
pyridine at the middle, and Na3(py)6[Ce(Onaph)6] (3.6) shown at the bottom... 152
Figure 3.4.50. Stacked plot of 1H NMR spectra in pyridine-d5 of (HTMG)3[Ce2(Onaph)9]
(3.1) at the top, complex 3.1 with 6 equiv NaOTf and 3 equiv HOnaph stirred for 1 hr in
pyridine at the middle, and Na3(py)6[Ce(Onaph)6] (3.6) shown at the bottom... 153
Figure 3.4.51. Stacked plot of 1H NMR spectra in CDCl3 of (HTMG)3[Ce2(Onaph)9]
(3.1) at the top, complex 3.1 with 3 equiv KOTf stirred for 1 hr in pyridine at the middle,
and K3(py)6[Ce2(Onaph)9(py)2] (3.7) shown at the bottom ... 154
Figure 3.4.52. Stacked plot of 1H NMR spectra in pyridine-d5 of (HTMG)3[Ce2(Onaph)9]
(3.1) at the top, complex 3.1 with 3 equiv KOTf stirred for 1 hr in pyridine at the middle, and K3(py)6[Ce2(Onaph)9(py)2] (3.7) shown at the bottom ... 155
Figure 3.4.53. Stacked plot of 1H NMR spectra in CDCl3 of Li4(DME)4[Ce2(Onaph)10]
(3.2) at the top, complex 3.2 with 4 equiv (HTMG)OTf stirred for 1 hr in DME next, and (HTMG)3[Ce2(Onaph)9] (3.1) shown at the bottom ... 156
Figure 3.4.54.7Li NMR spectrum in CDCl3 of Li4(DME)4[Ce2(Onaph)10] (3.2) with 4
xxvii Figure 3.4.55. Stacked plot of 1H NMR spectra in proteo DME of
Li4(DME)4[Ce2(Onaph)10] (3.2) at the top, complex 3.2 with 4 equiv (HTMG)OTf stirred
for 1 hr in DME next, and (HTMG)3[Ce2(Onaph)9] (3.1) shown at the bottom ... 157
Figure 3.4.56. Stacked plot of 7Li NMR spectra in proteo DME of
Li4(DME)4[Ce2(Onaph)10] (3.2) at the top, and complex 3.2 with 4 equiv (HTMG)OTf
stirred for 1 hr in DME shown at the bottom ... 157
Figure 3.4.57. Stacked plot of 1H NMR spectra in CDCl3 of Na4(DME)4[Ce2(Onaph)10]
(3.3) at the top, complex 3.3 with 4 equiv (HTMG)OTf stirred for 1 hr in DME next, and
(HTMG)3[Ce2(Onaph)9] (3.1) shown at the bottom ... 158
Figure 3.4.58. Stacked plot of 1H NMR spectra in proteo DME of
Na4(DME)4[Ce2(Onaph)10] (3.3) at the top, complex 3.3 with 4 equiv (HTMG)OTf stirred
for 1 hr in DME next, and (HTMG)3[Ce2(Onaph)9] (3.1) shown at the bottom ... 159
Figure 3.4.59. Stacked plot of 1H NMR spectra in CDCl3 of K6(DME)4[Ce2(Onaph)12]
(3.4) at the top, complex 3.4 with 6 equiv (HTMG)OTf stirred for 1 hr in DME next,
(HTMG)3[Ce2(Onaph)9] (3.1) with 3 equiv (HTMG)Onaph second from the bottom, and
complex 3.1 shown at the bottom ... 160
Figure 3.4.60. Stacked plot of 1H NMR spectra in proteo DME of
K6(DME)4[Ce2(Onaph)12] (3.4) at the top, complex 3.4 with 6 equiv (HTMG)OTf stirred
for 1 hr in DME next, (HTMG)3[Ce2(Onaph)9] (3.1) with 3 equiv (HTMG)Onaph second
from the bottom, and complex 3.1 shown at the bottom ... 161
Figure 3.4.61. Stacked plot of 1H NMR spectra in CDCl3 of Li3(py)6[Ce(Onaph)6] (3.5)
xxviii Figure 3.4.62. 7Li NMR spectrum in CDCl3 of Li3(py)6[Ce(Onaph)6] (3.5) with 3 equiv (HTMG)OTf stirred for 1 hr in pyridine ... 162 Figure 3.4.63. Stacked plot of 1H NMR spectra in pyridine-d5 of Li3(py)6[Ce(Onaph)6] (3.5) at the top, 2 equiv complex 3.5 with 6 equiv (HTMG)OTf stirred for 1 hr in pyridine in the middle, and (HTMG)3[Ce2(Onaph)9] (3.1) shown at the bottom... 163 Figure 3.4.64. Stacked plot of 7Li NMR spectra in pyridine-d5 of Li3(py)6[Ce(Onaph)6] (3.5) at the top, and 2 equiv complex 3.5 with 6 equiv (HTMG)OTf stirred for 1 hr in pyridine shown at the bottom ... 163 Figure 3.4.65. Stacked plot of 1H NMR spectra in CDCl3 of Na3(py)6[Ce(Onaph)6] (3.6) at the top, complex 3.6 with 6 equiv (HTMG)OTf stirred for 1 hr in pyridine next, (HTMG)3[Ce2(Onaph)9] (3.1) with 3 equiv (HTMG)Onaph second to the bottom, and complex 3.1 shown at the bottom ... 164 Figure 3.4.66. Stacked plot of 1H NMR spectra in pyridine-d5 of Na3(py)6[Ce(Onaph)6] (3.6) at the top, complex 3.6 with 6 equiv (HTMG)OTf stirred for 1 hr in pyridine next, (HTMG)3[Ce2(Onaph)9] (3.1) with 3 equiv (HTMG)Onaph second to the bottom, and complex 3.1 shown at the bottom ... 165 Figure 3.4.67. Stacked plot of 1H NMR spectra in CDCl3 of K3(py)6[Ce2(Onaph)9(py)2] (3.7) at the top, complex 3.7 with 3 equiv (HTMG)OTf stirred for 1 hr in pyridine at the middle, and (HTMG)3[Ce2(Onaph)9] (3.1) shown at the bottom... 166 Figure 3.4.68. Stacked plot of 1H NMR spectra in pyridine-d5 of
xxix Figure 3.4.69. Variable temperature 1H NMR spectra of (HTMG)3[Ce2(Onaph)9] (3.1) in pyridine-d5... 168 Figure 3.4.70. Variable temperature 1H NMR spectra of K3(py)6[Ce2(Onaph)9(py)2] (3.7) in pyridine-d5 ... 169 Figure 3.4.71. Variable temperature 1H NMR spectra of the reaction of
K3(py)6[Ce2(Onaph)9(py)2] (3.7) with 3 equiv (HTMG)OTf in pyridine-d5 ... 170 Figure 3.4.72. Overlay of 1H NMR spectra of the reaction of K3(py)6[Ce2(Onaph)9(py)2] (3.7) with 3 equiv (HTMG)OTf (black), K3(py)6[Ce2(Onaph)9(py)2] (3.7) (red), and (HTMG)3[Ce2(Onaph)9] (blue) in pyridine-d5 at 250 K ... 171 Figure 3.4.73. Overlay of 1H NMR spectra of the reaction of K3(py)6[Ce2(Onaph)9(py)2] (3.7) with 3 equiv (HTMG)OTf (black), K3(py)6[Ce2(Onaph)9(py)2] (3.7) (red), and (HTMG)3[Ce2(Onaph)9] (blue) in pyridine-d5 at 300 K ... 171 Figure 3.4.74. Variable temperature 1H NMR spectra of the reaction of
Li3(py)6[Ce(Onaph)6] (3.5) with 3 equiv (HTMG)OTf in pyridine-d5 ... 172 Figure 3.4.75. Variable temperature 7Li NMR spectra of the reaction of
Li3(py)6[Ce(Onaph)6] (3.5) with 3 equiv (HTMG)OTf in pyridine-d5 ... 173 Figure 3.4.76. Cyclic voltammetry of K3(py)6[Ce2(Onaph)9(py)2] (3.7) in pyridine and 0.15 M ([nBu4N][BArF4]). Scan rate was 100 mV/s ... 174 Figure 3.4.77. Scan rate dependence of the CeIII/IV redox wave of
xxx Figure 3.4.79. Scan rate dependence of the CeIII/IV redox wave of
(HTMG)3[Ce2(Onaph)9] (3.1) in pyridine and 0.15 M ([nBu4N][BArF4]). Scan rates
ranged from 25–1000 mV/s ... 175 Figure 3.4.80. Cyclic voltammetry of K3(py)6[Ce2(Onaph)9(py)2] (3.7) and 3 equiv (HTMG)OTf in pyridine and 0.15 M ([nBu4N][BArF4]). Scan rate was 100 mV/s ... 176 Figure 3.4.81. Cyclic voltammetry of K3(py)6[Ce2(Onaph)9(py)2] (3.7) and 3 equiv (HTMG)OTf in pyridine and 0.15 M ([nBu4N][BArF4]). Scan rate was 100 mV/s ... 176 Figure 3.4.82. Scan rate dependence of the CeIII/IV redox wave of
K3(py)6[Ce2(Onaph)9(py)2] (3.7) and 3 equiv (HTMG)OTf in pyridine and 0.15 M
([nBu4N][BArF4]). Scan rates ranged from 25–1000 mV/s ... 177 Figure 3.4.83. Cyclic voltammetry of K3(py)6[Ce2(Onaph)9(py)2] (3.7) and 3 equiv (HTMG)OTf (top), (HTMG)3[Ce2(Onaph)9] (3.1) (middle), and
K3(py)6[Ce2(Onaph)9(py)2] (3.7) (bottom) in pyridine and 0.15 M ([nBu4N][BArF4]). Scan rate was 100 mV/s ... 177
Figure 3.4.84. 1H -1H COSY NMR spectrum of K3(py)6[Eu2(Onaph)9(py)2] (3.8) in CDCl3 ... 178 Figure 3.4.85. 1H -1H COSY NMR spectrum of K3(py)6[Eu2(Onaph)9(py)2] (3.8) in CDCl3 ... 178
xxxi Figure 3.4.88. 1H -1H COSY NMR spectrum of K3(py)6[Pr2(Onaph)9(py)2] (3.9) in CDCl3 ... 180 Figure 3.4.89. 1H -1H COSY NMR spectrum of K3(py)6[Pr2(Onaph)9(py)2] (3.9) in CDCl3 ... 180 Figure 3.4.90. 1H -13C HSQC NMR spectrum of K3(py)6[Pr2(Onaph)9(py)2] (3.9) in CDCl3 ... 181 Figure 3.4.91. 1H -13C HSQC NMR spectrum of K3(py)6[Pr2(Onaph)9(py)2] (3.9) in CDCl3 ... 181 Figure 3.4.92. 1H NMR spectrum of K3(py)6[Eu2(Onaph)9(py)2] (3.8) in CDCl3 (top) and K3(py)6[Eu2(Onaph)9(py)2] (3.8) first dissolved in pyridine-d5, solvent removed under reduced pressure, and then 1H NMR spectrum in CDCl3 (bottom) ... 182 Figure 3.4.93. 1H NMR spectrum of K3(py)6[Pr2(Onaph)9(py)2] (3.9) in CDCl3 (top) and K3(py)6[Pr2(Onaph)9(py)2] (3.9) first dissolved in pyridine-d5, solvent removed under reduced pressure, and then 1H NMR spectrum in CDCl3 (bottom) ... 182 Figure 3.4.94. Assigned 1H NMR spectrum of K3(py)6[Eu2(Onaph)9(py)2] (3.8) (top) and K3(py)6[Pr2(Onaph)9(py)2] (3.9) (bottom) in CDCl3 ... 183 Figure 3.4.95. Representative 2D 1H -1H EXSY NMR spectrum of
xxxii Figure 3.4.98. 1H -1H 2D EXSY spectrum of (HTMG)3[Pr2(Onaph)9] (3.11) at 220 K in CDCl3, tmix = 25 ms ... 187 Figure 3.4.99. 1H -1H 2D EXSY spectrum of the mixture of K3(py)6[Eu2(Onaph)9(py)2] (3.8) and K3(py)6[Pr2(Onaph)9(py)2] (3.9) at 300 K in CDCl3, tmix = 25 ms ... 188 Figure 3.4.100. Overlay of the 1H NMR spectra of K3(py)6[Eu2(Onaph)9(py)2] (3.8) (red), K3(py)6[Pr2(Onaph)9(py)2] (3.9) (blue), and the mixture of
K3(py)6[Eu2(Onaph)9(py)2] (3.8) and K3(py)6[Pr2(Onaph)9(py)2] (3.9) (black) ... 189 Figure 3.4.101. Overlay of the 1H NMR spectra of K3(py)6[Eu2(Onaph)9(py)2] (3.8) (red), K3(py)6[Pr2(Onaph)9(py)2] (3.9) (blue), and the mixture of
K3(py)6[Eu2(Onaph)9(py)2] (3.8) and K3(py)6[Pr2(Onaph)9(py)2] (3.9) (black) ... 189 Figure 3.4.102. Overlay of the 1H NMR spectra of K3(py)6[Eu2(Onaph)9(py)2] (3.8) (red), K3(py)6[Pr2(Onaph)9(py)2] (3.9) (blue), and the mixture of
K3(py)6[Eu2(Onaph)9(py)2] (3.8) and K3(py)6[Pr2(Onaph)9(py)2] (3.9) (black) ... 190 Figure 3.4.103. 1H -1H COSY NMR spectrum of the mixture of
K3(py)6[Eu2(Onaph)9(py)2] (3.8) and K3(py)6[Pr2(Onaph)9(py)2] (3.9) ... 191 Figure 3.4.104. 1H -1H COSY NMR spectrum of the mixture of
K3(py)6[Eu2(Onaph)9(py)2] (3.8) and K3(py)6[Pr2(Onaph)9(py)2] (3.9) ... 191 Figure 3.4.105. 1H -13C HSQC NMR spectrum of the mixture of
K3(py)6[Eu2(Onaph)9(py)2] (3.8) and K3(py)6[Pr2(Onaph)9(py)2] (3.9) ... 192 Figure 3.4.106. 1H -13C HSQC NMR spectrum of the mixture of
K3(py)6[Eu2(Onaph)9(py)2] (3.8) and K3(py)6[Pr2(Onaph)9(py)2] (3.9) ... 192 Figure 3.4.107. 1H -1H TOCSY NMR spectrum of the mixture of
xxxiii Figure 3.4.108. 1H -1H TOCSY NMR spectrum of the mixture of
K3(py)6[Eu2(Onaph)9(py)2] (3.8) and K3(py)6[Pr2(Onaph)9(py)2] (3.9) ... 193 Figure 3.4.109. UV-Vis spectra of K3(py)6[Eu2(Onaph)9(py)2] (3.8) (yellow),
K3(py)6[Pr2(Onaph)9(py)2] (3.9) (green), and the mixture of 3.8 and 3.9 (black) ... 194 Figure 3.4.110. 1H -1H 2D EXSY spectrum of the mixture of (HTMG)3[Eu2(Onaph)9] (3.10) and (HTMG)3[Pr2(Onaph)9] (3.11) at 300 K in CDCl3, tmix = 50 ms ... 194 Figure 3.4.111. 1H -1H 2D EXSY spectrum of the mixture of K3(py)6[Eu2(Onaph)9(py)2] (3.8) and (HTMG)3[Eu2(Onaph)9] (3.10) at 300 K in CDCl3, tmix = 50 ms ... 195 Figure 3.4.112. Eyring plot of K3(py)6[Eu2(Onaph)9(py)2] (3.8) bridging to terminal self-exchange obtained from variable temperature 2D 1H -1H EXSY NMR spectra in CDCl3 ... 196 Figure 3.4.113. Eyring plot of K3(py)6[Pr2(Onaph)9(py)2] (3.9) bridging to terminal self-exchange obtained from variable temperature 2D 1H -1H EXSY NMR spectra in CDCl3 ... 196 Figure 4.2.1. 1H and 7Li spectra of complex 4.1.1 in benzene-d6 and pyridine-d5 ... 207 Figure 4.2.2. Thermal ellipsoid plot of the complex Li(py)4[Li5(PhNNPh)3(py)3], an unintended side product from the reaction to form complex 4.1.2 ... 208 Figure 4.2.3. 30 % thermal ellipsoid plots of Li4(Et2O)4[Ce(PhNNPh)4] 4.1.1 and
xxxiv Figure 4.2.7. 1H NMR spectra of the filtrate from the reaction to synthesize
Li4(py)4[Ce(PhNNPh)4] (4.1.2) collected in C6D6, the filtrate spiked with aniline, and the filtrate spiked with aniline and 1,2-diphenylhydrazine ... 217
Figure 4.2.8. 1H NMR spectrum of the filtrate from the reaction to synthesize
K5(py)7[Ce(PhNNPh)4] (4.3) collected in C6D6... 218 Figure 4.2.9. Temperature dependent magnetic data measured by SQUID magnetometry for complexes 4.1.2, 4.2, and 4.3 ... 220 Figure 4.2.10. UV-Vis spectra of Li4(py)4[Ce(PhNNPh)4] (4.1.2) collected in pyridine and fluorobenzene ... 222 Figure 4.2.11. UV-Vis spectra of Na4(py)8[Ce(PhNNPh)4] (4.2) collected in pyridine and fluorobenzene ... 222 Figure 4.2.12. UV-Vis spectrum of K5(py)7[Ce(PhNNPh)4] (4.3) collected in pyridine ... 223 Figure 4.2.13. UV-Vis spectra of 1,2-diphenylhydrazine deprotonated with KN(SiMe3)2, NaN(SiMe3)2, or LiN(SiMe3)2 collected in pyridine ... 223 Figure 4.2.14. Cyclic voltammetry of 1,2-diphenylhydrazine and Li4(py)4[Ce(PhNNPh)4] (4.1.2) in a solution of [nNBu4][BArF4] in fluorobenzene, v = 100 mV/s ... 227 Figure 4.2.15. Cyclic voltammetry of 1,2-diphenylhydrazine and
xxxv Figure 4.2.17. 1H NMR spectrum of the metathesis reaction of complex 4.3 with LiI in C6D6 ... 232
Figure 4.2.18. 1H and 7Li NMR spectra of the metathesis reaction of complex 4.1 with 5 equiv KI in pyridine-d5 ... 233
Figure 4.2.19. 1H and 7Li NMR spectra of the metathesis reaction of complex 4.1 with 5 equiv KI and 0.5 equiv PhNHNHPh in pyridine-d5 ... 233
Figure 4.2.20. 1H NMR spectrum of the metathesis reaction of complex 4.2 with 5 equiv KI and in pyridine-d5 ... 234
Figure 4.2.21. 1H NMR spectrum of the metathesis reaction of complex 4.2 with 5 equiv KI and 0.5 equiv PhNHNHPh in pyridine-d5... 235
Figure 4.4.1. Isolation scans of Li4(py)4[Ce(PhNNPh)4] (4.1.2) in a solution of
[nNBu4][BArF4] in fluorobenzene at varying scan rates, and ip vs. v1/2 plot ... 239 Figure 4.4.2. Isolation scans of Na4(py)8[Ce(PhNNPh)4] (4.2) in a solution of
[nNBu4][BArF4] in fluorobenzene at varying scan rates, and ip vs. v1/2 plot ... 240 Figure 4.4.3. Isolation scans of K5(py)7[Ce(PhNNPh)4] (4.3) in a solution of
[nNPr4][BArF4] in THF at varying scan rates, and ip vs. v1/2 plot ... 241 Figure 4.4.4. Normalized absorption (A) as a function of the incident X-ray energy (E) in the Ce LIII near-edge region at T = 30 K for complexes 4.1.2, 4.2, and 4.3 ... 245
Figure 4.4.5. 1H NMR spectrum of Li4(Et2O)4[Ce(PhNNPh)4] (4.1.1) collected in C6D6 ... 287
xxxvi Figure 4.4.7. 13C NMR spectrum of Li4(Et2O)4[Ce(PhNNPh)4] (4.1.1) collected in C6D6 ... 288 Figure 4.4.8. 1H NMR spectrum of Li4(py)4[Ce(PhNNPh)4] (4.1.2) collected in C6D6 ... 289
xxxvii Figure 4.4.19. Experimental FTIR spectrum of K5(py)7[Ce(PhNNPh)4] (4.3) collected in nujol and its calculated spectrum of K4(OMe2)4[Ce(PhNNPh)4]– (4.3.2) ... 297
Figure 4.4.20. Gas chromatogram of the metathesis reaction of complex 4.3 with LiI ... 298
Figure 4.4.21. 1H NMR spectrum in pyridine-d5 of the following crude reaction mix: in a diethyl ether solution, KH or KN(SiMe3)2 and 1,2-diphenylhydrazine were added to
Ce{N(SiHMe2)2}4 ... 299
Figure 4.4.22. Atomic orbitals 87 and 101 of the calculated Li4(Me2O)4[Ce(PhNNPh)4] complex showing one set of the Ce–N bonding and antibonding orbitals ... 300
Figure 4.4.23. 1H NMR spectrum in pyridine-d5 of the reaction of complex 4.3 with Ph3CCl... 300
Figure 4.4.24. 1H NMR spectrum in pyridine-d5 of the reaction of complex 4.3 with FcPF6 ... 301
Figure 4.4.25. 1H NMR spectrum in pyridine-d5 of the reaction of complex 4.3 with CuCl2 ... 301
Figure 4.4.26. 1H NMR spectrum in pyridine-d5 of the reaction of complex 4.3 with I2 ... 302
Figure 4.4.27. 1H NMR spectrum in pyridine-d5 of the reaction of complex 4.3 with 18-crown-6 ... 302
Figure 4.4.28. 30 % thermal ellipsoid plots of Li4(DME)4[Ce(PhNNPh)4] (left) and Na4(Et2O)4[Ce(PhNNPh)4] (right) ... 303
Figure 5.2.1. Cyclic voltammetry of 1,2-bis(3,5-dimethylphenyl)diazene
xxxviii 1,2-bis(3,5-dichlorophenyl)diazene Cl2ArN=NArCl2,
3,3′5,5′-tetrakis(trifluoromethyl)azobenzene ArFN=NArF, and decafluoroazobenzene
F5ArN=NArF5 in 0.1 M [nNBu4][PF6] in acetonitrile ... 322
Figure 5.2.2. 30% thermal ellipsoid plots for complexes Li4(Et2O)4[Ce(PhNNPh)4] (5.1),
Li4(Et2O)4[Ce(ClArNNArCl)4] (5.2), Li4(Et2O)4[Ce(Cl2ArNNArCl2)4] (5.3), and
Li4(Et2O)4[Ce(ArFNNArF)4] (5.4) ... 326 Figure 5.2.3. UV-Vis spectra of Li4(py)4[Ce(PhNNPh)4], Li4(Et2O)4[Ce(ClArNNArCl)4] (5.2), Li4(Et2O)4[Ce(Cl2ArNNArCl2)4] (5.3), and Li4(Et2O)4[Ce(ArFNNArF)4] (5.4) in toluene ... 328
Figure 5.2.4. Cyclic voltammetry of Li4(py)4[Ce(PhNNPh)4],
Li4(Et2O)4[Ce(ClArNNArCl)4] (5.2), and Li4(Et2O)4[Ce(Cl2ArNNArCl2)4] (5.3) in 0.1 M [nNBu4][BArF4] in fluorobenzene ... 331 Figure 5.4.1. 1H NMR spectrum of Li4(Et2O)4[Ce(PhNNPh)4] (5.1) collected in C6D6 from 280–300 K ... 337
Figure 5.4.2. 1H NMR spectrum of Li4(Et2O)4[Ce(ClArNNArCl)4] (5.2) collected in C6D6 ... 339
Figure 5.4.3. 7Li NMR and 13C NMR spectra of Li4(Et2O)4[Ce(ClArNNArCl)4] (5.2) collected in C6D6 ... 339
Figure 5.4.4. 1H NMR spectrum of Li4(Et2O)4[Ce(Cl2ArNNArCl2)4] (5.3) collected in C6D6 ... 341
xxxix Figure 5.4.6. 1H NMR spectrum of Li4(Et2O)4[Ce(ArFNNArF)4] (5.4) collected in CDCl3 ... 343
Figure 5.4.7. 7Li NMR and 19F NMR spectra of Li4(Et2O)4[Ce(ArFNNArF)4] (5.4)
collected in CDCl3 ... 343
Figure 5.4.8. 1H NMR spectrum of Li4(Et2O)4[Ce(ArFNNArF)4] (5.4) collected in CD2Cl2 ... 344
Figure 5.4.9. 7Li NMR and 19F NMR spectra of Li4(Et2O)4[Ce(ArFNNArF)4] (5.4)
collected in CD2Cl2 ... 344
Figure 5.4.10. 19F NMR spectra of the following reaction mixes: Ce[N(SiMe3)2]3 with 4 equiv F5ArNHNHArF5 and 4 equiv LiN(SiMe3)2; Ce[N(SiMe3)2]3 with 4 equiv
F5ArNHNHArF5; and LiN(SiMe3)2 with 4 equiv F5ArNHNHArF5 ... 345
Figure 5.4.11. 1H NMR spectra of the following reaction mixes: Ce[N(SiMe3)2]3 with 4 equiv Me2ArNHNHArMe2 and Ce[N(SiMe3)2]3 with 4 equiv Me2ArNHNHArMe2 and 4 equiv LiN(SiMe3)2 ... 346
Figure 5.4.12. Thermal ellipsoid plot of the soluble orange crystals isolated from the reaction mixture of Ce[N(SiMe3)2]3 with 4 equiv Me2ArNHNHArMe2 and 4 equiv
LiN(SiMe3)2 ... 346
Figure 5.4.13. Evans’ method results for complex Li4(Et2O)4[Ce(ClArNNArCl)4] (5.2) ... 351
Figure 5.4.14. Evans’ method results for complex Li4(Et2O)4[Ce(Cl2ArNNArCl2)4] (5.3) ... 351
xl Figure 5.4.16. Experimental FTIR spectrum of Li4(Et2O)4[Ce(ClArNNArCl)4] (5.2) in C6D6 overlayed with the calculated FTIR spectrum ... 353 Figure 5.4.17. Experimental FTIR spectrum of Li4(Et2O)4[Ce(Cl2ArNNArCl2)4] (5.3) in C6D6 overlayed with the calculated FTIR spectrum ... 353 Figure 5.4.18. Experimental FTIR spectrum of Li4(Et2O)4[Ce(ArFNNArF)4] (5.4) in dichloromethane overlayed with the calculated FTIR spectrum ... 354 Figure 5.4.19. UV-Vis spectrum of complex Li4(py)4[Ce(PhNNPh)4] in toluene ... 355 Figure 5.4.20. UV-Vis spectrum of complex Li4(Et2O)4[Ce(ClArNNArCl)4] (5.2) in
toluene ... 355 Figure 5.4.21. UV-Vis spectrum of complex Li4(Et2O)4[Ce(Cl2ArNNArCl2)4] (5.3) in toluene ... 356 Figure 5.4.22. UV-Vis spectrum of complex Li4(Et2O)4[Ce(ArFNNArF)4] (5.4) in toluene ... 356 Figure 5.4.23. Depiction of the ligand to metal charge transfer transition calculated at 18,800 cm–1 (532 nm) for complex 5.1 Li4(Me2O)4[Ce(PhNNPh)4] ... 357 Figure 5.4.24. Depiction of the ligand to metal charge transfer transition calculated at 21,000 cm–1 (475 nm) for complex 5.1 Li4(Me2O)4[Ce(PhNNPh)4] ... 357 Figure 5.4.25. Cyclic voltammetry of 1,2-diphenylhydrazine in 0.1 M [nNBu4][BArF4] in fluorobenzene. Scan rate was 100 mV/s ... 358 Figure 5.4.26. Cyclic voltammetry of N,N′-bis-(4-chlorophenyl)hydrazine in 0.1 M [nNBu4][BArF4] in fluorobenzene. Scan rate was 100 mV/s ... 358 Figure 5.4.27. Cyclic voltammetry of bis-(3,5-dichlorophenyl)hydrazine in 0.1 M
xli
Figure 5.4.28. Cyclic voltammetry of 3,3′,5,5′-tetrakis(trifluoromethyl)hydrazobenzene
in 0.1 M [nNBu4][BArF4] in fluorobenzene. Scan rate was 100 mV/s ... 359 Figure 5.4.29. Scan rate dependence plot of Li4(Et2O)4[Ce(ClArNNArCl)4] (5.2) in 0.1 M [nNBu4][BArF4] in fluorobenzene. Scan rate ranged from 25–1000 mV/s ... 360 Figure 5.4.30. Differential pulse voltammetry of Li4(Et2O)4[Ce(ClArNNArCl)4] (5.2) in 0.1 M [nNBu4][BArF4] in fluorobenzene ... 360 Figure 5.4.31. Scan rate dependence plot of Li4(Et2O)4[Ce(Cl2ArNNArCl2)4] (5.3) in 0.1 M [nNBu4][BArF4] in fluorobenzene. Scan rate ranged from 25–1000 mV/s ... 361 Figure 5.4.32. Differential pulse voltammetry of Li4(Et2O)4[Ce(Cl2ArNNArCl2)4] (5.3) in 0.1 M [nNBu4][BArF4] in fluorobenzene ... 361 Figure 5.4.33. Scan rate dependence plot of Li4(Et2O)4[Ce(ArFNNArF)4] (5.4) in 0.1 M [nNBu4][BArF4] in fluorobenzene. Scan rate ranged from 25–1000 mV/s ... 362 Figure 5.4.34. Cyclic voltammetry of Li4(Et2O)4[Ce(ArFNNArF)4] (5.4) in 0.1 M
[nNBu4][BArF4] in fluorobenzene. Scan rate was 100 mV/s ... 362 Figure 5.4.35. Cyclic voltammetry of Li4(Et2O)4[Ce(ArFNNArF)4] (5.4) in 0.1 M
[nNBu4][BArF4] in fluorobenzene. Scan rate was 100 mV/s ... 363 Figure 5.4.36. Differential pulse voltammetry of Li4(Et2O)4[Ce(ArFNNArF)4] (5.4) in 0.1 M [nNBu4][BArF4] in fluorobenzene ... 363 Figure 5.4.37. Molecular orbital of a Ce–N bonding interaction in
Li4(Me2O)4[Ce(PhNNPh)4] (5.1) and Li4(Me2O)4[Ce(ClArNNArCl)4] (5.2) ... 381 Figure 5.4.38. Thermal ellipsoid plot of {[Li(THF)]2[BocNNBoc]}n ... 381
Figure 6.2.1. Correlation of calculated versus experimental E1/2 of a series of
xlii
Figure 6.2.2. Correlation of calculated –LUMO energy versus the experimental reduction potential of a series of 4-coordinate tetrahedral complexes ... 397 Figure 6.2.3. 30 % thermal ellipsoid plot of Ce(O-DiNOx)2 and the calculated structure of Ce(O-DiNOx)2 ... 402 Figure 6.2.4. Correlation of calculated versus experimental E1/2 of a series of tetrahedral complexes in dichloromethane and D2d complexes in acetonitrile ... 405 Figure 6.2.5. Correlation of calculated –LUMO energy versus the experimental reduction potential of a series of tetrahedral complexes in dichloromethane and D2d complexes in acetonitrile... 405 Figure 6.4.1. 1H NMR spectrum of O-DiNOx in pyridine-d5 ... 411 Figure 6.4.2. 13C NMR spectrum of O-DiNOx in pyridine-d5 ... 412 Figure 6.4.3. Crude 1H NMR spectrum of Ce(O-DiNOx)2 in C6D6 ... 413 Figure 6.4.4. Cyclic voltammetry of Ce(O-DiNOx)2 in 0.1 M [nNPr4][BArF4] in
dichloromethane. Scan rate was 50 mV/s ... 415 Figure 6.4.5. Scan rate dependence of Ce(O-DiNOx)2 in 0.1 M [nNPr4][BArF4] in
dichloromethane. Scan rate ranged from 50–1000 mV/s. At bottom, ip vs. v1/2 plot ... 415 Figure 6.4.6. Cyclic voltammetry of Ce[N(SiMe3)2]3F in 0.1 M [nNPr4][BArF4] in
dichloromethane. Scan rate was 100 mV/s ... 416 Figure 6.4.7. Scan rate dependence of Ce[N(SiMe3)2]3F in 0.1 M [nNPr4][BArF4] in dichloromethane. Scan rate ranged from 25–1000 mV/s. At bottom, ip vs. v1/2 plot ... 416 Figure 6.4.8. Cyclic voltammetry of Ce[N(SiMe3)2]3Cl in 0.1 M [nNPr4][BArF4] in
xliii
Figure 6.4.9. Scan rate dependence of Ce[N(SiMe3)2]3Cl (top) in 0.1 M [nNPr4][BArF4]
in dichloromethane. Scan rate ranged from 25–1000 mV/s. At bottom, ip vs. v1/2 plot ... 417 Figure 6.4.10. Cyclic voltammetry of Ce[N(SiMe3)2]3Br in 0.1 M [nNPr4][BArF4] in
dichloromethane. Scan rate was 100 mV/s ... 418 Figure 6.4.11. Scan rate dependence of Ce[N(SiMe3)2]3Br in 0.1 M [nNPr4][BArF4] in
dichloromethane. Scan rate ranged from 25–1000 mV/s. At bottom, ip vs. v1/2 plot ... 418 Figure 6.4.12. Cyclic voltammetry of Li(THF)[Ce(NiPr
2)4] in 0.1 M [nNPr4][BArF4] in
dichloromethane. Scan rate was 100 mV/s ... 419 Figure 6.4.13. Scan rate dependence of Li(THF)[ Ce(NiPr
2)4] in 0.1 M [nNPr4][BArF4] in
dichloromethane. Scan rate ranged from 25–1000 mV/s. At bottom, ip vs. v1/2 plot ... 419 Figure 6.4.14. Cyclic voltammetry of Ce(NiPr
2)4 in 0.1 M [nNPr4][BArF4] in THF. Scan
rate was 100 mV/s ... 420 Figure 6.4.15. Scan rate dependence of Ce(NiPr
2)4 in 0.1 M [nNPr4][BArF4] in THF. Scan
rate ranged from 25–1000 mV/s. At bottom, ip vs. v1/2 plot ... 420 Figure 6.4.16. LUMO orbitals of the following complexes: CeIV[N(SiHMe2)2]4,
Li(THF)[CeIV(NiPr
2)4]+, and Ce[N(SiMe3)2]3F ... 422
Figure A1.2.1. Scan rate dependence of the isolated CeIV/III reduction potential of 0.1 M CeCl3•6 H2O in a 5.5 M K2CO3 aqueous solution. Scan rates ranged from 25 mV/s–1000
mV/s ... 502 Figure A1.2.2. Cyclic voltammogram of the background, a 5.5 M K2CO3 and 1 M KOH
aqueous solution. Cyclic voltammogram of 0.1 M TbCl3•6 H2O in a 5.5 M K2CO3 and 1
xlv Figure A1.2.9. Cyclic voltammogram of the background, a 2.2 M (N3H5C)2SO4 in water.
Cyclic voltammogram of 0.1 M CeCl3•6 H2O in a 2.2 M (N3H5C)2SO4 aqueous solution.
Scan rate was 500 mV/s ... 509 Figure A1.2.10. Cyclic voltammogram of the background, a 2.2 M guanidine phosphate
in water. Cyclic voltammogram of 0.1 M CeCl3•6 H2O in a 2.2 M guanidine phosphate
aqueous solution. Scan rate was 500 mV/s ... 509 Figure A1.2.11. The UV-Vis spectrum of a Fenton reaction ... 512
Figure A1.2.12. The UV-Vis spectra of the Fenton reactions with 0.1 M TbCl3•6 H2O
... 513 Figure A1.2.13. UV-Vis spectra of the following: an aqueous solution containing 0.1 M
PrCl3•6 H2O and 5.5 M K2CO3, and an aqueous solution containing 0.1 M TbCl3•6 H2O
xlvi
List of Schemes
Scheme 2.2.1. Synthesis of Li3(py)6[Ce(Onaph)6] (2.1) and Li4(DME)4[Ce2(Onaph)10] (2.2) ... 26
Scheme 2.2.2. Proposed degradation of complex 2.1 in DME... 30 Scheme 2.2.3. Synthesis of complex 2.3 ... 31 Scheme 2.2.4. Syntheses of complexes 2.7–2.10 ... 37 Scheme 3.1.1. Importance of hydrogen bonding interactions of water in the Mukaiayama-Aldol reaction catalyzed by Ln(OTf)3 ... 98
Scheme 3.2.1. Cation exchange reactions of 3 or more equivalents of MX with
(HTMG)3[(BINOLate)3Ce ... 100
Scheme 3.2.2. Attempted cation exchange reactions of MOTf and MOnaph with complex 3.1... 102 Scheme 3.2.3. Attempted cation exchange reactions of MOTf and HOnaph with complex 3.1... 104 Scheme 3.2.4. Reactions of (HTMG)OTf with complexes 3.3, 3.4, 3.6, and 3.7 ... 105 Scheme 3.2.5. Depiction of proposed naphtholate self-exchange process between the terminal and bridging naphtholates in complexes 3.7−3.9 ... 109
xlvii Scheme 4.2.3. Attempted synthesis of K4(sol) [Ce(PhNNPh)4] starting from a Ce(IV)
precursor ... 230
Scheme 4.2.4. Metathesis reaction of complex 4.3 with 4 equiv LiI ... 231
Scheme 5.1.1. Proposed cooperation of the rare earth (RE) Lewis acid with the alkali
metal (M) Lewis acid in the rare earth metal BINOLate (REMB) catalysts which were
used for the enantioselective 1,4-addition of alkoxylamine ... 315
Scheme 5.1.2. Syntheses of Li4(py)4[Ce(PhNNPh)4] and Na4(py)8[Ce(PhNNPh)4] ... 316
Scheme 5.2.1. Series of 1,2-diarylhydrazine compounds that were reacted with
Ce[N(SiMe3)2]3 and LiN(SiMe3)2: 1,2-bis(3,5-dimethylphenyl)hydrazine
(Me2ArNHNHArMe2), 1,2-diphenylhydrazine (PhNHNHPh),
3,3′,5,5′-tetrakis(trifluoromethyl)hydrazobenzene (ArFNHNHArF), and
bis(pentafluorophenyl)-hydrazine (F5ArNHNHArF5) ... 318
Scheme 5.2.2. Syntheses of Li4(Et2O)4[Ce(ArNNAr)4] complexes ... 319
Scheme 5.2.3. 1,2-diarylhydrazine ligands synthesized. N,N
′-bis-(4-chlorophenyl)hydrazine (ClArNHNHArCl) and N,N′-bis-(3,5-dichlorophenyl)hydrazine
(Cl2ArNHNHArCl2) ... 322
1
CHAPTER
1
Introduction and Outline of the Dissertation
1.1 Why Study the Lanthanides?
While traditional chemistry courses typically do not cover the chemistry of the
lanthanide series, these elements from La–Lu are integral to technologies that we use and
see every day. Several key “clean energy technologies” including wind power, batteries
in electric vehicles, fuel cells, and energy-efficient lighting/displays as well as defense
technologies such as SONAR, radar, communication systems, night vision, satellites, and
guided munitions rely on rare earth (RE) elements (which include Sc, Y, and the
lanthanide series) to function and show optimal performance.[1, 2]
Additionally, the redox chemistry of the lanthanides is an important attribute in a
number of organic reactions and industrial processes.[3-8] Catalytic hydrocarbon cracking
and catalytic converter catalysts utilize redox-active cerium to remove unwanted organic
components or harmful pollutants such as CO.[8]
To improve catalytic processes and discover new uses for the lanthanides, the
focus of this research is to better understand solid state and solution structures of
lanthanide complexes to establish structure-function relationships and to explore new
2 Since the lanthanide elements are not typically included in chemistry courses, a brief introduction to their properties and coordination chemistry is provided below. The introduction will not be extensive. For more information, a number of textbooks[9-13] and reviews[4, 5, 14-19] written on the lanthanides have been provided here for reference. An outline of the dissertation also is included.
1.2 Introduction. Properties of the Lanthanides.
The word “lanthanide” describing the 15 elements in the lanthanide series from La−Lu comes from the Greek “lanthaneien” meaning to lie hidden.[14] While the
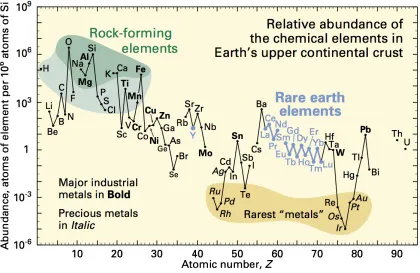
lanthanides are relatively abundant in the Earth’s crust (Figure 1.2.1), they, unlike Ni or Cu which have a similar crustal abundance, are typically dilute in their natural ore deposits, “lying hidden” in the earth.[11, 12] Neighboring lanthanides are also chemically similar, leading to difficulties in separating their mixtures into constituent elements.[9, 11, 20] These challenges slowed the elements’ discovery and continue to impede the opening
3 Figure 1.2.1. Abundance of the elements in the Earth’s crust (Haxel, Gordon B.;
Hedrick, James B.; Orris, Greta J. U. S. Geological Survey, 2002, Fact Sheet 087-02).
Reprinted with permission of the Dept. of the Interior/USGS, © 2002.
The lanthanides make up part of the f-block in the periodic table, distinguishing
them from the transition metal series located in the d-block. The lanthanides
predominantly form complexes in the 3+ oxidation state where their valence orbitals can
be described by [Xe]4fn, n = 0−14.[9, 11] The valence 4f orbitals lend the lanthanides their
unique properties. The 4f orbitals are well-shielded by the 5s2 and 5p6 orbitals and barely
extend radially beyond the [Xe] core, making them very contracted compared to the 5d,
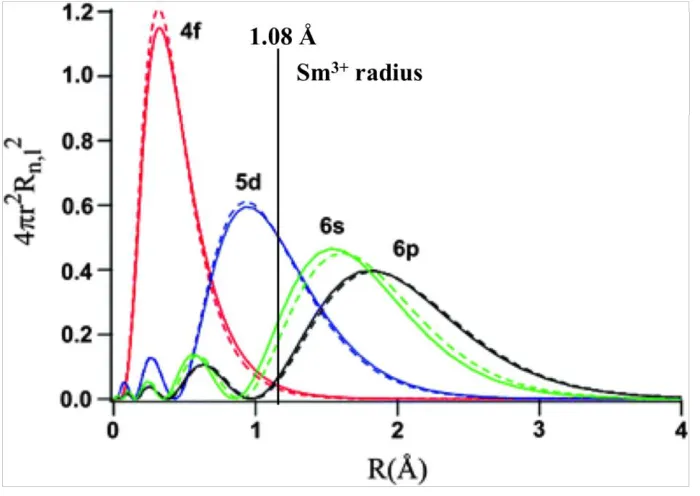
6s, and 6p orbitals (Figure 1.2.2).[9, 11, 21, 22] Because the 4f orbitals are isolated, their
4 orbitals result in sharp spectral bands and high color purity for luminescent materials,
phosphors, sensors, and imaging probes. Large number of unpaired 4f electrons can be
taken advantage for magnetic materials, NMR shift reagents, and MRI contrast agents.[9,
11, 14-16, 23]
Figure 1.2.2. Radial extent of the 4d, 5d, 6s, and 6p orbitals for a Sm3+ cation. The solid
lines show non-relativistic radial extent, and the dashed lines represent the radial extent
including relativistic effects. Adapted from (Ref. 22) with permission of The Royal
Society of Chemistry © 2004.
From La–Lu, the size of the cations decreases (“the Lanthanide Contraction”).[9,
11] The contraction is attributed to the poor shielding of the 4f electrons as the series is
traversed, increasing the effective nuclear charge of the later lanthanides.[9, 11] The greater
5 The lanthanides are hard Lewis acids that ‘prefer’ coordination by hard, anionic Lewis bases.[9, 11] Because the contracted 4f orbitals preclude metal-ligand orbital overlap, the nature of bonding with the lanthanides is largely ionic and non-directional, and the ligand field splitting energy is small compared to the d-block transition metals.[9,
11, 21] Thus, the arrangement of ligands about lanthanide metal centers is largely dictated
by ligand sterics.[9, 11] When bound to ligands with small steric profiles, the lanthanides have high coordination numbers and tend to form oligomeric complexes.[16] For example, Ln3+ cations coordinate 8–9 water molecules, depending on their ionic radius, whereas transition metals typically form directional octahedral hexaaqua species (Figure 1.2.3).[11,
24]
Figure 1.2.3. Thermal ellipsoid plots of (a) [Tb(H2O)9]3+ and (b) [Mn(H2O)6]2+
6 The lanthanides form strong bonds with water, where the hydration enthalpy
trends with the size of the Ln3+ cation (Figure 1.2.4).[11] The greater charge density with
the heavier, smaller lanthanides leads to larger (more negative), exothermic hydration
enthalpies. Aqueous coordination chemistry of the lanthanides requires large enthalpic
and/or entropic gains by the ligands upon coordination to out-compete water in the
primary coordination sphere.[19] Despite the thermodynamically strong water binding, the
water, and ligands in general, form kinetically labile bonds with the lanthanides (Figure
1.2.5).[11, 24] For example, [Eu(H2O)7]2+ exchanges water every 2.9 × 10⁻¹¹ s, as compared
to more kinetically inert metal-ligand bonds such as those in [Ir(H2O)6]3+, where water
exchanges on the order of once every 50 years.[24] The kinetic lability of ligands is
important for catalysis and probes such as MRI contrast agents. But such lability can be
challenging to design lanthanide complexes with well-defined coordination spheres and
7
Figure 1.2.4. Plot of the ionic radius for 9-coordinate lanthanoids[26] (blue squares) and
8 Figure 1.2.5. Water exchange rate constants, kH2O, for water molecules in the primary coordination sphere. Solid lines indicate values of kH2O determined directly, whereas dashed lines indicate values of kH2O estimated by ligand exchange. Reprinted from S. F. Lincoln, Helv. Chim. Acta 2005, 88, 523-545 (Ref. 24) with permission of WILEY-VCH Verlag Helvetica Chimica Acta AG, Zurich Switzerland, © 2005.
9 2,6-di-iso-propylphenoxide (DIPP) form dimers.[27, 28] Methyl or tert-butyl substituents in
the meta- or para- positions also result in trimeric or dimeric species.[27] However,
homoleptic lanthanide complexes coordinated to 2,6-di-tert-butyl-phenoxide (TBP) only
form monomeric species, Ln(TBP)3.[27] Another important sterically bulky supporting
ligand imparting low-coordinate, well-defined lanthanide complexes is N(SiMe3)2–,
which generates Ln[N(SiMe3)2]3.[29] The high basicity of the amide ligand, the volatility
of HN(SiMe3)2 and the well-defined complex structure makes the Ln[N(SiMe3)2]3 a
useful protonolysis starting material.[27]
Neutral Lewis bases also can be added to help break up higher order polymers of
lanthanide complexes.[27] Addition of THF to the dimeric lanthanide
2,6-di-iso-propylphenoxide yields Ln(DIPP)3(THF)x, where x = 2 or 3.[27] Similarly, addition of
pyridine or THF to CeIV2(OtBu)8 forms monomeric CeIV(OtBu)4(sol)2 where sol = py or
THF.[30, 31] However, the tert-butoxide supporting ligand tends to oligomerize with the
larger lanthanides, including CeIII, regardless of solvent conditions.[28, 30] For example,
there are 22 different Ce(III), Ce(IV), and mixed valent Ce(III)/Ce(IV) homoleptic
cerium tert-butoxide structures submitted to the Cambridge Structural Database. The
many different lanthanide tert-butoxide complex structures show how difficult it is to
predict the solid state and solution speciation of homoleptic lanthanide complexes in
different solvents, reaction conditions, and with different stoichiometries and starting
![Figure 2.2.8. 30 % thermal ellipsoid plot of {K6(DME)4[Ce2(Onaph)12]}n (2.10). The top](https://thumb-us.123doks.com/thumbv2/123dok_us/9365436.1470325/91.612.154.491.99.591/figure-thermal-ellipsoid-plot-k-dme-ce-onaph.webp)
![Figure 2.4.10. Scan rate dependence of the CeIII/IV redox wave of Na3(py)6[Ce(Onaph)6]](https://thumb-us.123doks.com/thumbv2/123dok_us/9365436.1470325/103.612.140.507.416.638/figure-scan-rate-dependence-ceiii-redox-wave-onaph.webp)