Simulation of Dynamics of System with Hydraulic Lines and Linear
Hydraulic Motor with Mass Load
A. Bureček1, L. Hružík1 and M. Vašina2
1VŠB
Technical University of Ostrava, Faculty of Mechanical Engineering, Department of Hydromechanics and Hydraulic Equipment, 708 33 Ostrava, Czech Republic
2Tomas Bata University in Zlín, Faculty of Technology, Department of Physics and Materials Engineering, 760 01 Zlín, Czech Republic
Abstract.This paper deals with the numerical simulation of dynamic properties of the system consisting of hydraulic lines and linear hydraulic motor with a mass load. The mathematical model is created using Matlab SimHydraulics software. Oil bulk modulus, elasticity and volumes of pipes and hoses play a significant role in this case. Mathematical models are verified on experimental equipment. Pressure and position responses during sudden stop of a moving cylinder are measured on this equipment.
1 Introduction
It is possible to define suitable optimizations of a hydraulic system without physical intervention be means of numerical simulations. This type of design and modifications of hydraulic systems is applied in order to verify the behaviour of systems before their implementation. It is possible to save significant financial costs in this way. Dynamics of hydraulics systems [1, 3, 4, 7] is influenced by oil bulk modulus of elasticity, undissolved air content in oil, oil viscosity, elasticity of hydraulic lines (i.e. pipes and hoses), mass load, pipe length etc.
There are different computer programs for mathematical simulations of behaviour of hydraulic systems. The physical modelling is suitable from the user´s point of view. In this case, the simulation model consists of blocks that correspond to hydraulic elements. The blocks are described by mathematical equations and are included in libraries of computer programs. The simulation of dynamic behaviour of a system with long pipe and mass load was performed using SimHydraulics and SimMechanics that are part of Matlab software. The one-dimensional model is proposed for flow simulations. The long pipe in SimHydraulics software was simulated using a segmented pipe with concentric parameters. The numerical model was verified on experimental equipment [3].
2 Descriptions of experiment and
experimental equipment
The experimental equipment is applied to realization of dynamic processes of a hydraulic system. The system consists of a linear hydraulic motor with mass load and piston position sensor. Motion control is realized by proportional valve [2]. The equipment allows to test the influence of elasticity and length of hydraulic lines (i.e. pipes or hoses) on pressure and position response on inputs of the hydraulic motor during its starting and stopping. Furthermore, it allows to evaluate the influence of mass load and undissolved air content in oil.
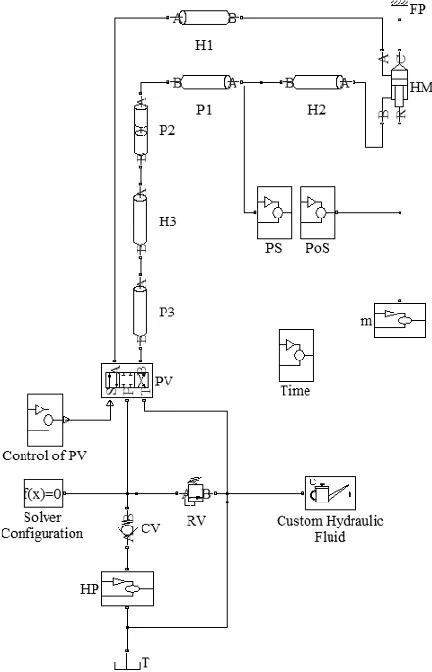
The scheme of the experimental equipment is shown in figure 1. The hydraulic pump HP is a constant pressure source. The working liquid is mineral oil with the working temperature tt = 25 °C. The control of the linear
hydraulic motor HM is realized using the proportional valve PV. A control signal of the proportional valve PV is obtained by control card from the company Humusoft in Simulink software. The mass load m is suspended on piston rod of the linear hydraulic motor HM. The hydraulic motor HM is connected to the proportional valve PV through the hydraulic lines HL A and HL B. The hydraulic line HL A consists of the hose H1. The line HL B consists of the hoses H2 and H3 and the pipes P1, P2 and P3 (see figure 2). The long pipe P2 has a significant influence on the system dynamics. The hydraulic aggregate consists of the check valve CV, the relief valve RV and the tank T.
C
Owned by the authors, published by EDP Sciences, 2013
This is an Open Access article distributed under the terms of the Creative Commons Attribution License 2 0 , which . permits unrestricted use, distributi and reproduction in any medium, provided the original work is properly cited.
The experimental measurement was performed as follows: The constant pressure p = 50 bar is adjusted on the input of the proportional valve PV. The channel P of the valve is connected with the channel A. Similarly, the channel B is connected with the channel T. Hydraulic oil flows through the hydraulic line HL A into the piston of the hydraulic motor. For this reason, the piston rod is protruded. The piston rod velocity v = 0.317 m s-1 was
observed at the flow Q =23.93 dm3 min-1. The
proportional valve PV is abruptly converted into the central position approximately in the middle of the motor stroke. It results in a hydraulic shock. Time dependencies of pressure in the hydraulic line HL B and piston position of the hydraulic motor HM are observed in this case. The pressure p was measured by means of the pressure sensor PS. It is the PR15 Hydrotechnik sensor with the measuring range of (0 400) bar and with 0.5% accuracy. The position was measured by the position sensor PoS which is integrated in the hydraulic motor body. It is the Balluff BTL7 sensor with the measuring range of (0 0.3) m. The signal from the sensors is recorded by means of the measuring equipment Hydrotechnik M5050 with the scanning interval
Δt = 0.001 s of the measured quantities. Measured data are processed using Hydrowin software and subsequently compared with the numerical model.
Fig. 1. Scheme of experimental circuit.
Fig. 2. Detailed description of the lines HL A and HL B.
The parameters of the experimental equipment are the following:
1. Hydraulic oil – density ρ = 880 kg m-3,
kinematic viscosity = 1.05 10-4 m2 s-1, bulk
modulus of elasticity K = 2.05 × 10⁹ Pa,
undissolved air content α = 0.5 %.
2. Hoses H1, H2 – length l = 2.5 m, outside diameter D = 0.02 m, inside diameter
d= 0.012 m.
3. Hose H3 – length l = 0.9 m, outside diameter
D = 0.022 m, inside diameter d= 0.014 m. 4. Pipe P1 – length l = 2.05 m, outside diameter
D= 0.016 m, inside diameter d = 0.012 m. 5. Pipe P2 – length l = 60 m, outside diameter
D = 0.016 m, inside diameter d = 0.012 m. 6. Pipe P3 – length l = 1.4 m, outside diameter
D= 0.016 m, inside diameter d = 0.012 m. 7. Hydraulic motor HM – piston stroke h = 0.3 m,
piston diameter D= 0.04 m, piston rod diameter
d = 0.028 m, mass load m = 45 kg.
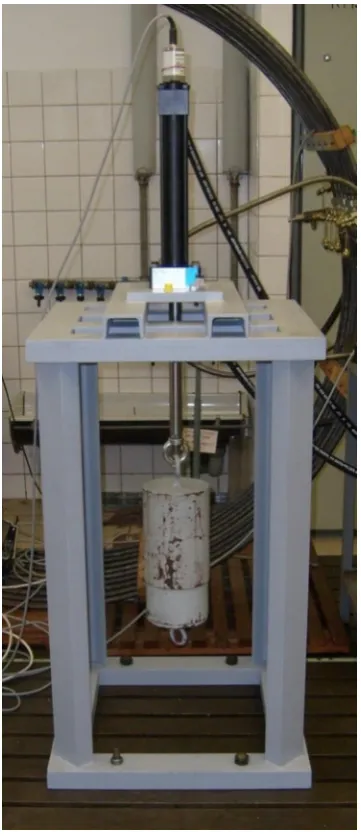
Figure 3 shows the hydraulic motor HM with the position sensor PoS, the suspended mass load m and the stand for the motor mounting.
3 Mathematical model of experimental
equipment
The numerical model (see figure 4) was created using Matlab SimHydraulics software [5, 6]. Dynamic
properties of the hydraulic system at a jump motor stop in the middle stroke position at the piston rod protrusion were evaluated in this model.
Fig. 4. Mathematical model of the experimental equipment.
The constant pressure p = 50 bar was secured by the hydraulic pump HP. Oil flows through the check valve CV, the proportional valve PV and the hose H1 into the piston side of the hydraulic motor HM. For this reason, the piston rod is protruded and the mass m is triggered. The hydraulic motor is fixed to the fixed point FP. Furthermore, oil flows from the piston rod space through the lines H2, P1, P2, H3 and P3 and the proportional valve PV into the tank T. The circuit is protected against overload by the relief valve RV. The model consists of the blocks for control of the proportional valve PV (i.e. the block Control of PV), for measurement of the piston position PoS, for pressure measurement PS and the block Solver Configuration. The block Time is used to adjustment of the time step of scanning Δt, which was same as in the case of the experimental measurements (i.e. Δt = 0.001 s). The block Custom Hydraulic Fluid is used to adjustment of hydraulic oil parameters. The undissolved air content in oil corresponded to the value of 0.5%. The pipe P2 is simulated as a segmented pipe with concentric parameters.
The segmented pipe (see figure 5) of a circular cross-section is divided by longitudinal cuts on set of same serially arranged parts - concentric parameters. Each part consists of the resistive tube (i.e. Resistive Tube – movement resistance), the block of liquid inertia (i.e. Fluid Inertia – acceleration resistance) and liquid compressibility (i.e. Constant Volume Hydraulic Chamber – deformation resistance). In the case of one segment, it is assumed a symmetric T-part. Every other segment is considered as L-part [3, 5].
Fig. 5. Block of segmented pipe.
Fig. 6. Composition of segmented pipe.
Fig. 7. Composition of one segment.
4 Verification of mathematical model
The verification of the mathematical model consists in comparison of measured and mathematically simulated values of the pressure and the piston position at hydraulic motor stop in the middle position. The proportional valve PV is in the right position (see figure 1) in this case (i.e. channel connections P-A and B-T). The piston rod is protruded (see chapter 3). The proportional valve PV is abruptly converted into the central position approximately in the middle of the motor stroke. The piston is subsequently stopped. It is accompanied by pressure and position oscillations.
Figure 8 shows the comparison of time dependencies of the simulated and the measured pressures on the piston rod side (see figure 2). It is evident, that the numerically obtained pressure dependence corresponds with the experiment both in the amplitude of oscillation, and in the pressure amplitude. In this case, the system eigenfrequency f = 7.3 Hz.
Figure 9 demonstrates the comparison of time dependencies of the simulated and the experimentally measured piston positions at motor stop in the middle position. It can be concluded, that the simulated piston position overshoots the position of 129 10-3 m in view
of the steady value of 127.8 10-3 m. A similar
Fig. 8. Time dependencies of measured and simulated pressures.
Fig. 9. Time dependencies of measured and simulated piston positions.
5 Simulation of influence of undissolved
air content in oil
The influence of undissolved air content in oil on the time dependence of the pressure on the piston rod side (see figure 10) and the time dependence of the position (see figure 11) were simulated at the jump piston stop in the middle position.
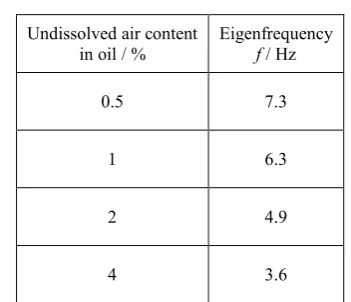
It is evident (see figure 10), that the eigenfrequency is in general decreased with increasing the undissolved air content in oil (see table 1). The pressure amplitude is decreased too.
Fig. 10. Influence of undissolved air content (in %) on pressure response.
Table 1. Influence of undissolved air content on system
eigenfrequency.
Undissolved air content
in oil / % Eigenfrequency f / Hz
0.5 7.3
1 6.3
2 4.9
4 3.6
It is visible (see figure 11), that the overshoot of the piston position increases with increasing the undissolved air content in oil.
Fig. 11. Influence of undissolved air content (in %) on position response.
Table 2. Influence of undissolved air content on overshoot of
piston position.
Undissolved air content
in oil / % Overshoot of piston position / 10-3 m
0.5 1.16
1 1.35
2 1.58
4 1.66
6 Conclusions
The work describes the experimental equipment with the linear hydraulic motor, the mass load and the hydraulic line for realization of dynamic processes. The simulation model of the experimental equipment was created using Matlab SimHydraulics. The model was verified by comparison of mathematical simulations and experimental measurements of time dependencies of
0 5 10 15 20 25 30 35 40
0.35 0.45 0.55 0.65 0.75 0.85
p
/
bar
t/ s
Experiment Simulation 126.5 127.0 127.5 128.0 128.5 129.0 129.5
0.35 0.45 0.55 0.65
h
/
10
-3
m
t/ s
Experiment Simulation 0 5 10 15 20 25 30 35 40
0.35 0.45 0.55 0.65 0.75
p
/
bar
t/ s
0.5% 1% 2% 4% 126.5 127.0 127.5 128.0 128.5 129.0 129.5
0.35 0.45 0.55 0.65 0.75
h
/
10
-3
m
t/ s
pressure and piston position of the hydraulic motor at its stop in the middle position (see figures 8 and 9). The influence of undissolved air content in oil on dynamics of the hydraulic circuit was also simulated. Increasing undissolved air content in oil causes a decreasing of the eigenfrequency (see figure 10 and table 1) and an increasing of the overshoot size of the piston position at its stop (see figure 11 and table 2).
References
1. P. Beater, Entwurf Hydraulischer Maschinen: Modellbildung, Stabilitätsanalyse und Simulation Hydrostatischer Antriebe und Steuerungen (Springer, Berlin, 1999)
2. Mannesmann Rexroth, Der Hydraulik Trainer, Band 2, Proportional und Servoventil Technik (Germany, Lohr am Main, 1986)
3. M. Kozubková, Matematické modely kavitace a hydraulického rázu (VŠB – TU Ostrava, Ostrava, 2009)
4. A. Bureček, L. Hružík, Journal of applied science in the termomechanics and fluid mechanics 5, 2 (2011) 5. The MathWorks, Matlab Simulink User´s Guide,
SimHydraulics User´s Guide (USA, 2007)
6. K. Bittner, Simhydraulics – Modelování hydraulických systémů v programu Simulink, http://www.automatizace.cz/article.php?a=1228 7. J. Kopáček, J. Šubert, Strojírenská výroba 28, 12