of flood protection standards
Paolo Scussolini1, Jeroen C. J. H. Aerts1, Brenden Jongman1, Laurens M. Bouwer2, Hessel C. Winsemius2, Hans de Moel1, and Philip J. Ward1
1Institute for Environmental Studies, Vrije Universiteit Amsterdam, De Boelelaan 1087,
1081 HV Amsterdam, the Netherlands
2Deltares, P.O. Box 177, 2600 MH Delft, the Netherlands
Correspondence to: Paolo Scussolini ([email protected])
Received: 28 October 2015 – Published in Nat. Hazards Earth Syst. Sci. Discuss.: 7 December 2015 Revised: 24 March 2016 – Accepted: 8 April 2016 – Published: 3 May 2016
Abstract. With projected changes in climate, population and socioeconomic activity located in flood-prone areas, the global assessment of flood risk is essential to inform climate change policy and disaster risk management. Whilst global flood risk models exist for this purpose, the accuracy of their results is greatly limited by the lack of information on the current standard of protection to floods, with studies either neglecting this aspect or resorting to crude assumptions. Here we present a first global database of FLOod PROtection Stan-dards, FLOPROS, which comprises information in the form of the flood return period associated with protection mea-sures, at different spatial scales. FLOPROS comprises three layers of information, and combines them into one consis-tent database. The design layer contains empirical informa-tion about the actual standard of existing protecinforma-tion already in place; the policy layer contains information on protection standards from policy regulations; and the model layer uses a validated modelling approach to calculate protection stan-dards. The policy layer and the model layer can be considered adequate proxies for actual protection standards included in the design layer, and serve to increase the spatial coverage of the database. Based on this first version of FLOPROS, we suggest a number of strategies to further extend and increase the resolution of the database. Moreover, as the database is intended to be continually updated, while flood protection standards are changing with new interventions, FLOPROS requires input from the flood risk community. We therefore invite researchers and practitioners to contribute information to this evolving database by corresponding to the authors.
1 Introduction and rationale
A large portion of the world’s population is prone to flood-ing. About 0.8 billion people and USD 50 trillion are ex-posed to a 1-in-100-years river flood event (Jongman et al., 2012; Kundzewicz et al., 2013), and 40 million people and USD 3 trillion are exposed to coastal floods in the world’s main port cities (Hanson et al., 2011). River floods alone re-sulted in direct economic losses exceeding USD 1 trillion be-tween 1980 and 2013, and more than 220 000 fatalities (Mu-nich Re, 2013). Future damaging impacts of floods are pro-jected to increase in many parts of the world, by increasing encroachment of population and economic activities on river and coastal plains resulting from socioeconomic growth, as well as by projected increases in intense precipitation due to climate change (Min et al., 2011; IPCC, 2014; Winsemius et al., 2016). Estimating the present and future risk of floods is therefore critical in the ongoing discourse on the impacts of climate change: to motivate climate change mitigation pol-icy; to identify hotspots of risk; and to plan investments in adaptation, on a range of spatial and decision-making do-mains, such as water management, agriculture, risk manage-ment and risk financing (Hall et al., 2012).
et al., 2014; Alfieri et al., 2015), and other indicators of flood risk (Arnell and Gosling, 2014). In parallel, tools have been devised to make this type of knowledge accessible to a vast range of users (e.g. the Global Flood Analyzer1). Also at the smaller scale, assessments of flood risk are becoming more sophisticated (te Linde et al., 2011; Merz et al., 2014; Miller et al., 2015; de Moel et al., 2015).
The results from the current generation of large-scale flood risk models, however, remain highly uncertain (Ward et al., 2015). Typically, these models calculate damage for floods with several return periods, and integrate this damage in their annual likelihood of occurrence to estimate the annual expected damage. Because information on flood protection standards for most places in the world is severely limited, most current assessments either assume highly simplified flood protection standards, or assume no protection. There-fore, the integration of damage takes place along the whole spectrum of return periods, including damage of frequent (i.e. high return period) flood events that in reality are often prevented by existing protection. This results in a systematic overestimation of hazard, and greatly limits the accuracy of the computation of actual flood risk (e.g. IPCC, 2014; Hinkel et al., 2014). For example, Ward et al. (2013), using a global river flood risk model, found that the expected annual dam-age, assuming that all areas were protected against a flood with a return period of only 5 years, was about 40 % lower than in the absence of protection.
In this dearth of information on protection, researchers have devised solutions to circumvent the problem by assum-ing different standards of flood protection for different in-come regions across the globe (e.g. Mokrech et al., 2015; Sadoff et al., 2015; PBL, 2014). On the other hand, Jongman et al (2014) developed estimates of flood protection cover-ing all river basins in the European Union, uscover-ing a risk-based approach (i.e. assigning higher protection values to areas of higher risk), making use of a number of available empirical data points. They then included these protection estimates in a probabilistic continental flood risk model.
While these synthetic estimations of flood protection stan-dards indeed lead to improved results of flood damage simu-lations, quantifications of protection standards have not been extended beyond Europe, and the required empirical infor-mation available on protection standards is still extremely limited (e.g. Hall, 2014; de Moel et al., 2015). Some ef-forts, however, have been made to improve this empirical data availability. Linham et al. (2010) compiled a global list of adaptation standards for 32 coastal cities from “reports, email surveys, meetings with specialist consultancies and discussions with experts”. Later this work was implemented by Hallegatte et al. (2013), who added their expert estimates of standards of protection for an additional number of coastal cities. Information is thus limited to selected coastal cities, and the original sources are generally not available.
1http://floods.wri.org
This paper aims to present the first version of an open-source, dynamic, community-informed database of FLOod PROtection Standards, FLOPROS. The main motive of FLO-PROS is to aid research in flood risk management and in ap-plications such as global hydrological modelling (Bierkens, 2015), and assessments at a smaller scale. The database com-piles information from different sources: specialised litera-ture, policy documents and modelling techniques; and aims to incorporate input from the expert community. FLOPROS covers various spatial scales, from the district to the national level. In our search we realised, as Linham et al. (2010) also did, that this information “tends to exist in unpublished re-ports and with experienced engineers”. For this reason, we invite the community of specialists to contribute to improv-ing the coverage, accuracy and resolution of the database. Experts, researchers and operators in specific countries and regions are encouraged to provide pieces of information to FLOPROS, which will ultimately result in a comprehensive body of information available to the flood risk assessment community. Further, because it is apparent that empirical in-formation on protection will remain unavailable for consider-able areas of the globe, we propose other ways to fill gaps in the empirical database by means of modelling and inference. We plan to regularly update FLOPROS to incorporate the contributions of the community. This is necessary for three reasons: (1) to accommodate the flow of new information, (2) because, by its own nature, the implementation of pro-tection is a highly dynamic process, and likely to be acceler-ated under changing climatic conditions, under demographic and economic pressure, and with increased awareness of and aversion to risk and (3) because flood protection standards are prone to degrade, in the absence of adequate mainte-nance, and with the effect of climate change on the frequency and magnitude of flood events. Based on the frequency and amount of new entries and updates, progressive versions of the database will be released to include the new information.
2 Methods
2.1 Aggregating multiple layers of information
FLOPROS is a database of flood protection standards, based on a wide range of sources, and on a modelling approach. The database is structured into three layers of information, namely
a. the design layer, containing information about protec-tion defined by engineers in the design and realisaprotec-tion of currently existing river and coastal flood protection infrastructure;
Figure 1. Hierarchical structure of information contained in the
FLOPROS database. The design layer provides information on the construction standard of existing protection measures; the policy layer is relative to normative standards of protection; while the model layer calculates protection using flood hazard modelling and a relationship between wealth and flood protection (see Sect. 2.4 for details). These are aggregated into the merged layer, as explained in Sect. 2.
c. the model layer for river flood protection, which is based on a flood-modelling approach and on the ob-served relationship between per capita wealth and pro-tection.
While the model layer is based on river flood simulations, the approach can also be expanded to coastal flood risks and coastal protection levels. The general principle at the base of the composition of the FLOPROS database is the incorpora-tion of the best informaincorpora-tion available for each locaincorpora-tion. By best information, we mean the most reliable (i.e. trustworthy, accurate or closest to the hypothetical “real” protection stan-dard), the most recent and that with the highest resolution. To this end, a hierarchy is established between the three layers of information, on the basis of how reliable each layer is in representing the actual, existing protection (Fig. 1).
We deem the design layer to be the most reliable to rep-resent existing protection standards because it contains di-rect information concerning the standards used when design-ing the protection infrastructure. The two other layers, pol-icy and model, contain information that is a proxy for actual protection. We consider the policy layer to have intermedi-ate reliability because although it provides indication about the intended or required standard of protection, it does not indicate whether such protection is yet realised or enforced. Lastly, the model layer is third in order of reliability because even though partially validated against observations (see Re-sults), it involves a method to indirectly attribute protection information. The individual layers are further explained in Sects. 2.2 to 2.4.
While each of the three layers of information on protection standards can be used separately, depending on the desired scope, for large-scale applications of the database, integra-tion of the three layers of protecintegra-tion standard informaintegra-tion is
Figure 2. Procedure for the integration of protection standards
in-formation from the design, policy and model layers into the merged layer of the FLOPROS database.
desirable. We propose a method for this integration of the three layers into a merged layer, as schematised in Fig. 2. In this method, for places where information is not available in the most reliable layers, information from the subsequent lower layers is employed. In practice, if information is avail-able in the design layer for a given sub-country unit, then this information is included in the merged layer. If no infor-mation is contained in the design layer, then the policy layer information is included in the merged layer. Finally, if in-formation is not available even at the policy layer, then the model layer information is included in the merged layer. The rationale for this structure is to enable immediate use of a database that is almost global in extent, while allowing for constant updating of the design layer, as more empirical data on flood protection standards become available.
2.2 Design layer
rel-evant information presented and (c) the absence of evident conflicts in the attribution of the protection standard.
2.3 Policy layer
For the policy layer, we gathered information on regulated standards of flood protection from policy documents and regulations, and from governmental directives (Table 3). It is often the case that laws and regulations do not cor-respond to factual, enforced protection, as underlined by Jonkman (2013), given that they are in practice neglected or partially transgressed due to financial and enforcement limi-tations (de Moel et al., 2009). Nevertheless, this information provides a policy objective towards which action is oriented, thereby assigning a value that is likely more realistic than no protection (Mokrech et al., 2015).
2.4 Model layer
For the model layer, we adjusted and extended towards the global scale the approach introduced by Jongman et al. (2014) for deriving protection standards for fluvial flood-ing in Europe. A modelled protection standard was calcu-lated for administrative units at the first sub-country level2 (henceforth simply sub-country unit).
To do this, the following steps were taken.
1. Global maximum and minimum flood protection stan-dards were set. Here, we assumed the minimum pro-tection standard to be no propro-tection. In the GLOFRIS global flood risk model (Ward et al., 2013; Winsemius et al., 2013) schematisation (Ward et al., 2013; see their step 3; no protection means a protection against flood with a return of 2 years (the natural bank-full discharge, following Dunne and Leopold, 1978), and hence this value was used. For the maximum protection standard, we assumed a return period of 1000 years as per Jong-man et al. (2014).
2. Next, as it is known that protection standards vary de-pending on country wealth (Feyen et al., 2012; Jong-man et al., 2015), we estimated a maximum and mini-mum flood protection standard for each income group of the World Bank classification, namely, high-, upper-middle-, lower-upper-middle-, and low-income group3. To do this, firstly, GDP per capita (GDPpc) was calculated per
income group in USD 2005 at purchasing power par-ity. This was done using gridded maps of GDP val-ues and of population density from the IMAGE model, the same maps used in Ward et al. (2013), developed with the method described in van Vuuren et al. (2007). Next, the maximum (minimum) protection standard for a given income group was calculated by dividing its
2http://www.gadm.org
3http://data.worldbank.org/about/country-and-lending-groups
GDPpcby the GDPpcof the income group with the
high-est (lowhigh-est) GDPpc, and multiplying the obtained value
by the assumed maximum (minimum) protection stan-dard, i.e. 1000 years (2 years).
3. In the next step, the protection standard for each sub-country unit was estimated. The expected annual dam-age (EAD) that would occur if no flood protection were in place was calculated using the GLOFRIS model, and then normalised to potential flooded area to yield the EAD per unit of area (EADarea). For each World Bank
income group, the sub-country units with the highest and lowest EADarea were assigned the income
group-specific maximum and minimum protection standards (see step 2), respectively, and protection standards for the remaining sub-country units in the income group were linearly interpolated. GLOFRIS only simulates floods on rivers of a Strahler order 6 and higher (Win-semius et al., 2013). Hence, it was not possible to de-rive a modelled protection standard for catchments with lower Strahler order rivers, corresponding to ∼2 % of the Earth’s land surface (excluding Antarctica). Various alternative choices for modelling protection were investigated. Before opting to use the World Bank income groups classification to perform the interpolation (step 2 and 3), we first interpolated uniformly between all sub-country regions across the globe, and also used the United Nations regions classification. Further, we performed inter-polation between protection standard values (step 2 and 3), whereby the interpolation was carried out based on both the return period (e.g. 50 years) and the annual exceedance prob-ability (the inverse of the return period; e.g. 0.02). We for-mulated our decision for the World Bank income groups ag-gregation, and for using the flood periodicity in the interpola-tions, on the basis of a comparison of the results with the pro-tection standards included in the design layer (see Sect. 3.3 and Table 4). We visualise the results of these alternative choices for the model layer in Fig. S1 in the Supplement.
We underline that it was not possible to model protection standards in the model layer for coastal floods, due to the lack of essential data sets that resolve the hazard, and there-fore the risk in the coastal area. In the absence of spatially resolved risk information, we cannot apply to the coast an approach similar to the one described for the river flood pro-tection standards in the model layer.
3 Results
Figure 3. (a) World and (b) Europe maps of flood protection standards contained in the FLOPROS database, for sub-country administrative
units (http://www.gadm.org). Standards of the design, policy and model layers (see Sect. 2) are indicated in the red, green and blue colour scales, respectively; these are integrated into the merged layer, which the maps ultimately represent. White indicates no data available (see Sect. 2.4). Note that only the protection standards of the design and policy layers that are coherent with the scale of the sub-country units are included, and therefore part of the information of FLOPROS is not represented in the maps.
policy layers, and their references, are included in an Excel table. Furthermore, a Shapefile provides the information on the protection standards of the model layer along with the in-formation of the design and policy layers that is compatible with the sub-country unit scale of the map, and the resulting merged layer. Information from the design and policy layers that is available at a scale finer than the sub-country unit is not included in the integration process, but remains available for use in its original layer. In this section, we report on the main findings for the design, policy and model layers.
3.1 Design layer
Table 1 summarises the different types of information that are gathered and organised within the design layer. A total of 181 entries have been included in this layer. For each en-try it is specified whether the measure is meant to counter riverine flood, coastal flood or both. Empirical information on protection standards seems to be more available for river floods (102 out of 181 entries). The spatial resolution is het-erogeneous, ranging from city-scale (the most common with 107 out of 181 entries) to country-scale. Most of the infor-mation is gathered from institutional and technical reports.
On many occasions, information is retrieved in the form of a range of protection standard values, with a maximum and minimum value, normally to account for the spatial hetero-geneity of the location, and/or for the necessarily vast
uncer-Figure 4. Comparison of the protection standards included in the
model layer (green diamonds) to those in the design layer (red bars), for locations where the two layers can be compared on the same scale. For the design layer, a range of values, when available, or a single value are plotted. To enhance the visualisation, values are reported as a logarithm of the protection standard, expressed as the return period.
tainties associated with the estimation of the magnitude and the probability of flood events (see also Fig. 4).
Table 1. Overview of the characteristics of information contained
in the design layer of the FLOPROS database (the full database is available in the Supplement).
Characteristic Subdivision No. entries %
Type of flood hazard
River floods 102 56
Coastal floods 32 18
Both 35 19
Unspecified 12 7
Scale
City 107 59
River stretch 37 20
Region 23 13
Country 14 8
Reference type
Technical report 52 29
Institutional report/document 47 26
Institutional website 15 8
Personal communication 12 7
Journal article 11 6
Engineering book 9 5
Specialists book 7 4
Technical website 6 3
Newspaper article 6 3
Scientific study 6 3
Project website 3 2
Corporate website 3 2
Wikipedia (not further specified) 2 1
Not available 2 1
Reliability
High 99 57
Medium 54 31
Low 21 12
retention areas. “Soft” and “green” measures for flood pro-tection (Cheong et al., 2013; Hinkel and Bisaro, 2015) tend not to have a standard of protection specified in terms of re-turn period years, although exceptions exist, such as the flood control area realised for the town of Kruibeke, Belgium, combining flood protection with habitat creation, for which a protection standard of 350 years is specified (EU OUR-COAST Project, 2014).
3.2 Policy layer
The policy layer is composed of 71 entries, considerably less than for the design layer. Table 2 summarises the character-istics of the information gathered in this layer. A list of the countries for which policy standards of flood protection have been retrieved, either at country, regional, or city scale, is provided in Table 3. In contrast with the design layer, river and coastal flood protection entries are more balanced, and information is much more available at the country scale, than at the city scale. The main sources are again technical and institutional reports, followed by specialists’ books.
Mostly, policy protection standards are provided in the form of coding of areas, which is assigning different stan-dards of protection to an area based on the type of use (e.g. residential, industrial, agricultural). This is for exam-ple the case in the UK, where policy standards seem to range from 1 to 300 years, depending on the land use (DEFRA,
Table 2. Overview of the characteristics of information contained
in the policy layer of the FLOPROS database (the full database is available in the Supplement).
Characteristic Subdivision No. entries %
Type of flood hazard
River floods 29 40
Coastal floods 11 11
Both 28 39
Unspecified 4 6
Scale
City 9 13
River stretch 2 3
Region 8 11
Country 50 70
Continent 2 3
Reference type
Technical report 22 31
Institutional report/document 19 27
Institutional website 5 7
Personal communication 3 4
Journal article 8 11
Specialists book 6 8
Technical website 2 3
Scientific study 1 1
Project website 3 4
Not available 2 3
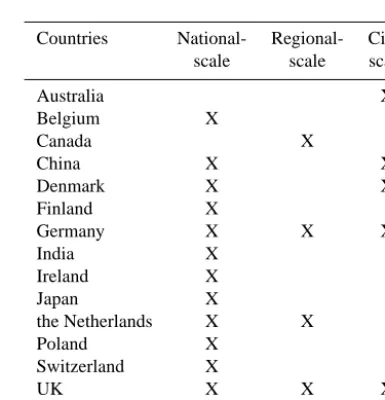
Table 3. Countries for which indications of the presence of
pol-icy/legal standards of protection at national, regional or city scale were found.
Countries National- Regional-
City-scale scale scale
Australia X
Belgium X
Canada X
China X X
Denmark X X
Finland X
Germany X X X
India X
Ireland X
Japan X
the Netherlands X X
Poland X
Switzerland X
UK X X X
USA X X
1999). A recurrent form of regulating flood risk is the lim-itation of new developments in areas subject to flooding of a certain return period, which often depends on the urban, residential, rural or industrial use of the land.
3.3 Model layer
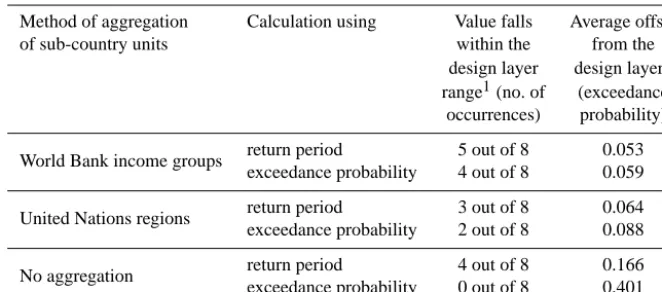
clos-World Bank income groups return period 5 out of 8 0.053
exceedance probability 4 out of 8 0.059
United Nations regions return period 3 out of 8 0.064
exceedance probability 2 out of 8 0.088
No aggregation return period 4 out of 8 0.166
exceedance probability 0 out of 8 0.401
1For the eight comparisons for which a range of design layer values is available (see Fig. 4).2We calculate the average of the absolute value of each offset between the model layer and the design layer (i.e. the mean between the max and min value, if a range is available) protection standard, expressed in terms of exceedance probability.
est to reality (Fig. 4). Moreover, as mentioned in Sect. 2.4, a range of options have been tested using different aggre-gations of sub-country units for interpolation, and different units for protection standards in the interpolations. There-fore, the comparison with the design layer serves also as a basis for the choice of the most appropriate method for the model layer of FLOPROS.
We use two criteria for the selection of the most appro-priate solution by comparison with the design layer: (1) the number of occurrences in which the model layer value falls within the range of design layer values; and (2) the average offset between the model layer and the design layer values.
Table 4 shows the degree of matching between the out-put of the selected solution for the model layer and the de-sign layers, for a number of spatially coherent comparisons (where the scale of information in the design layer matches the resolution of the model layer). The solution of aggregat-ing by World Bank income groups and to use return period years for the interpolations yielded a better performance ac-cording to both criteria, with its values either falling within the range provided by the design layer or close to the only available design layer value most of the time (Fig. 4). We therefore considered it the one most in agreement with the design layer and decided to adopt it for inclusion in FLO-PROS. The comparison of all solutions for the model layer to the design layer values is found in Fig. S1.
The highest standards of protection in the model layer are found in North America, from about a 380-year return period in the west coast of the United States, to about 20 years in Mexico; in Europe, from about a 250-year return period in regions of west Germany to about a 20-year return period in eastern European countries, with peaks of more than 500-year return periods in specific cities like Vienna, Paris and
London; and in Russia, Australia, Saudi Arabia and Oman, with values around 50.
South America is protected with standards ranging from about a 45-year return period in Uruguay and Chile, to 6 in Bolivia, Paraguay, Guyana and French Guiana. Africa presents protection ranging from 16 in northern and in south-ern African countries, to values of 2 in Saharan, sub-Saharan, tropical and western Africa, with peaks of about 115 in Egypt and 45 in Equatorial Guinea. Protection in Asia ranges from peaks of about 150 in Japan, to values around 2 in countries like Myanmar, Cambodia, Afghanistan or Nepal.
4 Discussion and future developments of FLOPROS
reli-ability cannot realistically be achieved, this limitation can be addressed by the strategies that we propose in Sect. 4.1.
4.1 Type of protection
The design and policy layers of FLOPROS comprise, at present, almost exclusively information on structural mea-sures of flood protection. These are construction works, com-monly dikes, levees and reservoirs, but also less common solutions, such as river bypass channels (realised for exam-ple for the Donau in Vienna; Zurich, 2014), and are often referred to as “grey”; but examples of “soft” measures like management plans (as in the case of Copenhagen; City of Copenhagen, 2012) are included as well. Also, entries in the database commonly refer to hazard-reducing measures, i.e. measures aimed at addressing the frequency and the mag-nitude of flood events. In recent years, flood risk-reduction practices have increasingly been considered that rather than addressing flood hazard, aim to reduce the exposure or the vulnerability to floods (e.g. Nicholls et al., 2008; Bouwer et al., 2009; Bubeck et al., 2011). For example, relocation of people and assets outside of floodplains of a given return pe-riod is a measure that addresses exposure; and dry-proofing (sealing off to water) residential buildings is a measure to reduce vulnerability of the assets in a flood-prone area. Fur-ther, since the introduction of the concept of Integrated Flood Risk Management, a new paradigm, has taken foot, entail-ing hybrid and mixed approaches (e.g. Sayers et al., 2013) that combine approaches to simultaneously reduce the haz-ard, exposure and vulnerability elements of risk (as defined in Kron, 2005; Aerts et al., 2014). All the above approaches and measures aim to reduce risk, and are therefore important for the risk calculation, that FLOPROS has the ambition to improve. We therefore suggest that future, expanded versions of the FLOPROS database should also present approaches to include exposure- and vulnerability-reducing measures.
4.2 Comparing the FLOPROS layers
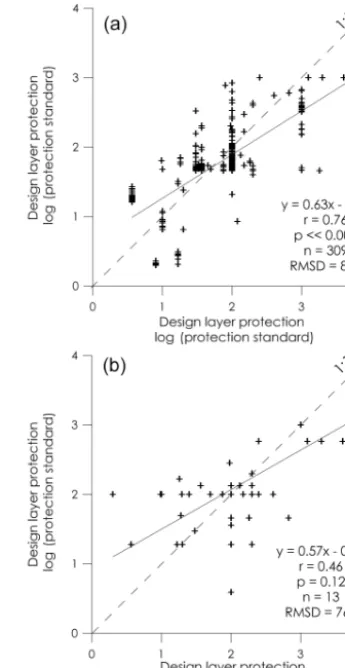
To investigate the coherence of the database in its three lay-ers, we compared the values of protection standards included in the design layer and in the two “proxy” layers, the model and the policy layers. For the sub-country units for which FLOPROS has a protection value for both the design and the model layers, we found highly significant correlation between the two data sets, with both parametric and non-parametric tests (Pearson’s r=0.76; Spearman’s ρ=0.70; p0.001 for both correlation coefficients) (Fig. 5a). Due to the strong positive skewness of the data sets in both the design and model layers, data were log-transformed prior to assessing the correlation with the Pearson’srcoefficient.
The correlation between the log-transformed data sets of the design and policy layers is also positive, but due to the low number of observations (n=13) it does not reach sta-tistical significance (Pearson’sr=0.46 andp=0.12;
Spear-Figure 5. Correlation between data sets of (a) the design and of
the model layers, and (b) the design and the policy layers. A log-transformation was applied to the protection standard values ex-pressed as return periods. The slope and intercept of the regression curves are shown, along with therPearson’s correlation coefficient (with thepvalue of the correlation) and the root-mean-square de-viation (RMSD). When a minimum and maximum protection value were present, the average of the annual exceedance probabilities (the inverse of the return period) was taken.
man’sρ=0.41 and p=0.17) (Fig. 5b), This implies that, for the sub-country units for which both design and pol-icy information was retrieved, enforced protection reflects, to some extent, the policy objectives. On the other hand, the root-mean-square deviation of the policy values (from the de-sign layer ones) is lower than that of the model layer values: 764 instead of 832 (or 0.376 instead of 0.503, for the log-transformed data). This means that overall, the policy layer values are closer to the design layer ones.
or the other hierarchical solution, we emphasise that layers in FLOPROS should be kept separated, and propose that users could make their own decisions regarding how to integrate them to better fit their purposes.
Because the main motivation of FLOPROS is to provide a practical tool to support research in flood risk manage-ment, we focus on its potential applications, such as global hydrological modelling (Bierkens, 2015), and also other do-mains as land use planning (e.g. Aerts et al., 2005). The lay-ers in the database can be utilised independently from each other, based on the scope of the investigation. The hierarchi-cal overlaying of the three layers permits the issue of aggre-gation of heterogeneous information from the layers to be overcome. Therefore, information can be retrieved and used both in the form of single items, represented by single en-tries of the database, and of aggregated information, from more entries and/or from more layers. This possibility espe-cially reflects the necessities of large-scale assessments of flood risk (e.g. Ward et al., 2013). Further, since information of the design and policy layers is presented in the form of maximum and minimum values, the investigator can choose to run the modelling exercise, either under the assumption of high or of low standards of protection.
A number of limitations, however, still persist; in the fol-lowing we discuss them and propose directions to overcome them.
4.3 Outlook to future versions of FLOPROS
As visible in the mapped visualisation of FLOPROS (Fig. 3) on global and European scale, vast and densely populated areas in developing regions such as Africa, South America and the Middle East clearly have less empirical information compared to developed countries. We advance a number of strategies aimed to extend the coverage, resolution and relia-bility of future versions of FLOPROS.
4.3.1 Towards an online platform for FLOPROS
The FLOPROS database could greatly benefit from the sup-port of an online platform. This would serve two functions: (1) to enable and manage the entry of new information by ex-perts; and (2) for users to visualise and download FLOPROS. Regarding point 1, experts, operators and researchers with a project portfolio in the regions of the database where data coverage is scarcer (Fig. 3) are in the position of providing
tributing community and to end users, it is necessary to find a suitable format for its publication. In this regard, a tool should be identified that presents at least three main charac-teristics. (1) It should be free and open-source, and therefore readily available to any user worldwide; (2) it should provide the possibility for straightforward and structured update of information from the community, for example by including a form that can be filled in online, such as proposed in Ta-ble S2 in the Supplement for this manuscript; (3) it should permit quality control of information by the custodians of the database; and (4) it should permit information at differ-ent spatial scales: river basin and sub-basin, administrative and also hybrid units.
Further, another interesting potential of an online platform for FLOPROS is the potential to enable crowdsourcing of information about actual dikes and levees, for example using volunteered geographical information data sets (e.g. Haklay and Weber, 2008; Haklay et al., 2014). This could provide the necessary parameters to convert the presence of dams and reservoirs from the GRanD database (Lehner et al., 2011) into protection standards, as described below.
4.3.2 Protection from dams and reservoirs
A database of existing dams and reservoirs with a global coverage currently exists, the GRanD database4 (Lehner et al., 2011). The database is nearly exhaustive and comprises 6862 dams and 6824 associated reservoirs. We envision the following strategy to extract flood protection information from GRanD.
For each dam and reservoir in GRanD, it is specified whether flood control is its main or its secondary use. A con-servative estimate of the amount of flood storage, available through dam operation, can therefore be made, assuming that a portion of the flood control reservoirs is available for this purpose. Consequently, a conservative estimate of their ef-fect on flood hazard levels, and thus the standard of flood protection they offer, can be assigned to the associated river stretches and to the main cities downstream in the proxim-ity (flood protection typically reduces further downstream of the dam, as more tributaries enter the river). Expert judg-ment could be employed to determine the general standards of flood protection associated with dams and reservoirs, and the extent of the protected area downstream. Alternatively,
basin-specific hydrological modelling (e.g. Aerts et al., 1999) with and without consideration of this available flood storage could yield more accurate estimations of protection. 4.3.3 Using statistical correlations
While we envision that with the community’s collaboration, a better spatial coverage of the design and policy layers can be achieved in the future, we nevertheless expect that for many areas, empirical and normative information might neither be retrieved, nor exist. A strategy to achieve global coverage and fill the persistent gaps, alternative to the approach devised for the model layer, is to compute correlations between standards of protection in FLOPROS (using information from the de-sign and policy layers), and socioeconomic indices, at vari-ous scales. If a suitable multiple regression model is found, it could then be applied to infer index-derived protection stan-dards for those missing regions.
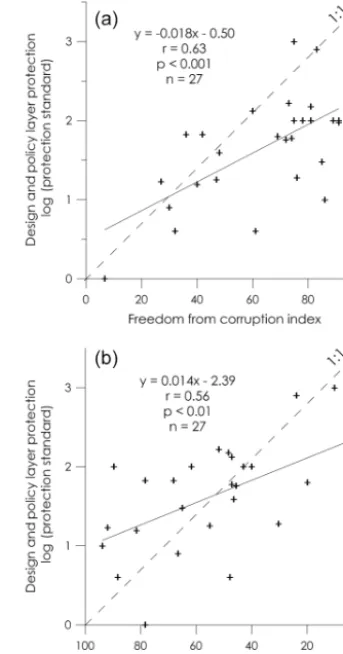
This is not a trivial exercise, and a relationship between wealth of cities and protection standards has been postulated before (e.g. Nicholls et al., 2008). Linham et al. (2010) ex-plored the correlations between their 36 coastal cities pro-tection data set versus country GDP/capita and exposed pop-ulation, with poor results. They did show that the “demand for safety” metric of the DIVA impact model could predict the protection standard within a factor of 10. Later, Feyen et al. (2012) used GDP to infer protection standards on an EU scale. Jongman et al. (2015) provided global empirical evi-dence on a general relationship between GDP and vulnerabil-ity, but did not relate this specifically to protection standards. An in-depth investigation of some African countries, used as case studies, suggested political and economic conditions that foster action towards disaster risk management (CCAPS, 2014). Our new database enables an extensive exploration of the socioeconomic determinants of flood protection (Cut-ter and Finch, 2008). Our preliminary results indicate that at the country scale, significant correlations appear to ex-ist between the protection standard in the design and pol-icy layers and certain economic and governance indicators. For instance, the “government spending” index accounts for the total expenditure of governments as a proportion of the country’s GDP, while the “freedom from corruption” index reflects experts’ opinion on local perception of corruption in most countries (using Transparency International’s Corrup-tion PercepCorrup-tions Index) (The Heritage FoundaCorrup-tion, 20145; and references therein) (Fig. 6). The significant correlations suggest that countries with higher public spending, and coun-tries where corruption is less widespread, tend to have higher flood protection standards, as included in the country-scale entries of our design and policy layers. Future research could focus on further examining such relationships in greater de-tail.
5http://www.heritage.org/index/book/methodology
Figure 6. Examples of correlation of flood protection standards,
as from our design and policy layer, with economic and policy indexes: (a) with the “government spending” index (note that the axis is reversed, because a 100 value of the index indicates min-imum government spending, and conversely), and (b) with the “freedom from corruption” index (The Heritage Foundation, 2014 (http://www.heritage.org/index/book/methodology); and references therein). For clarity, more freedom from corruption and more gov-ernment spending correspond to higher flood protection standards.
5 Conclusions
The Supplement related to this article is available online at doi:10.5194/nhess-16-1049-2016-supplement.
Author contributions. Paolo Scussolini, Jeroen C. J. H. Aerts, Philip J. Ward, Laurens M. Bouwer, Hessel C. Winsemius and Brenden Jongman designed the study. Paolo Scussolini collected information in the design layer of the database. Philip J. Ward and Brenden Jongman created the model layer of the database. Paolo Scussolini, Jeroen C. J. H. Aerts and Philip J. Ward prepared the manuscript with contributions from all co-authors.
Acknowledgements. This research was funded as part of the Aqueduct Global Flood Analyzer project, via subsidy 5000002722 from the Netherlands Ministry of Infrastructure and the En-vironment. The project is convened by the World Resources Institute. Philip J. Ward received additional funding from the Netherlands Organisation for Scientific Research (NWO) in the form of a VENI grant (grant no. 863-11-011). Jeroen C. J. H. Aerts acknowledges support of NWO VICI grant 453-14-006. The work has further benefitted from support of the ECONADAPT and RISES-AM- projects, under EU FP7: grant agreement no. 603906 (ECONADAPT), and no. 603396 (RISES-AM-). We are grateful to Corine Ten Velden, Dennis Wagenaar, Qian Ke and many colleagues at the Institute of Environmental Studies (Vrije Universiteit Amsterdam) and at Deltares for contributing information to the database.
Edited by: T. Glade
Reviewed by: L. Alfieri and one anonymous referee
References
Aerts, J. C. J. H., Kriek, M., and Schepel, M.: STREAM (Spatial tools for river basins and environment and analysis of manage-ment options): ’set up and requiremanage-ments’, Phys. Chem. Earth B, 24, 591–595, doi:10.1016/S1464-1909(99)00049-0, 1999. Aerts, J. C. J. H., Van Herwijnen, M., Janssen, R., and
Stew-art, T.: Evaluating Spatial Design Techniques for Solving Land-use Allocation Problems, J. Environ. Pl. Manage., 48, 121–142, doi:10.1080/0964056042000308184, 2005.
Aerts, J. C. J. H., Botzen, W. J. W., Emanuel, K., Lin, N., de Moel, H., and Michel-Kerjan, E. O.: Evaluating Flood Re-silience Strategies for Coastal Megacities, Science, 344, 473– 475, doi:10.1126/science.1248222, 2014.
Bouwer, L. M., Bubeck, P., Wagtendonk, A. J., and Aerts, J. C. J. H.: Inundation scenarios for flood damage evaluation in polder areas, Nat. Hazards Earth Syst. Sci., 9, 1995–2007, doi:10.5194/nhess-9-1995-2009, 2009.
Bubeck, P., de Moel, H., Bouwer, L. M., and Aerts, J. C. J. H.: How reliable are projections of future flood damage?, Nat. Hazards Earth Syst. Sci., 11, 3293–3306, doi:10.5194/nhess-11-3293-2011, 2011.
CCAPS: Institutional capacity for natural disasters: case studies in Africa, in: Climate Change and African Political Stability, edited by: Bussell, J., Robert S. Strauss Center for International Secu-rity and Law, Austin, Texas, 216 pp., 2014.
Cheong, S.-M., Silliman, B., Wong, P. P., van Wesenbeeck, B., Kim, C.-K., and Guannel, G.: Coastal adaptation with ecological engineering, Nat. Clim. Change, 3, 787–791, doi:10.1038/nclimate1854, 2013.
City of Copenhagen: Cloudburst Management Plan, http://kk.sites. itera.dk/apps/kk_pub2/pdf/1019_81lSkHGSvS.pdf (last access: November 2014), 2012.
Cutter, S. L. and Finch, C.: Temporal and spatial changes in social vulnerability to natural hazards, P. Natl. Acad. Sci. USA, 105, 2301–2306, doi:10.1073/pnas.0710375105, 2008.
Dankers, R., Arnell, N. W., Clark, D. B., Falloon, P. D., Fekete, B. M., Gosling, S. N., Heinke, J., Kim, H., Masaki, Y., Satoh, Y., Stacke, T., Wada, Y., and Wisser, D.: First look at changes in flood hazard in the Inter-Sectoral Impact Model Intercompari-son Project ensemble, P. Natl. Acad. Sci. USA, 111, 3257–3261, doi:10.1073/pnas.1302078110, 2014.
DEFRA: Flood and Coastal Defence Project Appraisal Guidance Economic Appraisal, FCDPAG3, Department for Environment, Food and Rural Affairs, 102 pp., 1999.
de Moel, H., van Alphen, J., and Aerts, J. C. J. H.: Flood maps in Europe – methods, availability and use, Nat. Hazards Earth Syst. Sci., 9, 289–301, doi:10.5194/nhess-9-289-2009, 2009. de Moel, H., Jongman, B., Kreibich, H., Merz, B.,
Penning-Rowsell, E., and Ward, P. J.: Flood risk assessments at different spatial scales, Mitig. Adapt. Strateg. Glob. Change, 20, 865–890, doi:10.1007/s11027-015-9654-z, 2015.
Dunne, T. and Leopold, L.: Water in environmental planning, W. H. Freeman & Co., San Francisco, 818 pp., 1978.
EU OURCOAST Project: http://ec.europa.eu/ourcoast/print.cfm? articleID=9, last access: November 2014.
Feyen, L., Dankers, R., Bódis, K., Salamon, P., and Barredo, J.: Flu-vial flood risk in Europe in present and future climates, Climatic Change, 112, 47–62, doi:10.1007/s10584-011-0339-7, 2012.
Haklay, M. and Weber, P.: OpenStreetMap:
Haklay, M., Antoniou, V., Basiouka, S., Soden, R., and Mooney, P.: Crowdsourced geographic information use in government, Re-port to World Bank GFDRR, London, UK, 76 pp., 2014. Hall, J. W.: Editorial: steps towards global flood risk modelling, J.
Flood Risk Manage., 7, 193–194, doi:10.1111/jfr3.12119, 2014. Hall, J. W., Brown, S., Nicholls, R. J., Pidgeon, N. F., and Watson, R. T.: Proportionate adaptation, Nat. Clim. Change, 2, 833–834, 2012.
Hallegatte, S., Green, C., Nicholls, R. J., and Corfee-Morlot, J.: Fu-ture flood losses in major coastal cities, Nat. Clim. Change, 3, 802–806, doi:10.1038/nclimate1979, 2013.
Hanson, S., Nicholls, R., Ranger, N., Hallegatte, S., Corfee-Morlot, J., Herweijer, C., and Chateau, J.: A global ranking of port cities with high exposure to climate extremes, Climatic Change, 104, 89–111, doi:10.1007/s10584-010-9977-4, 2011.
Hinkel, J. and Bisaro, A.: A review and classification of analytical methods for climate change adaptation, Wiley Interdisciplinary Reviews: Climate Change, 6, 171–188, doi:10.1002/wcc.322, 2015.
Hinkel, J., van Vuuren, D., Nicholls, R., and Klein, R. T.: The effects of adaptation and mitigation on coastal flood impacts during the 21st century. An application of the DIVA and IMAGE models, Climatic Change, 117, 783–794, doi:10.1007/s10584-012-0564-8, 2013.
Hinkel, J., Lincke, D., Vafeidis, A. T., Perrette, M., Nicholls, R. J., Tol, R. S. J., Marzeion, B., Fettweis, X., Ionescu, C., and Lever-mann, A.: Coastal flood damage and adaptation costs under 21st century sea-level rise, P. Natl. Acad. Sci. USA, 111, 3292–3297, doi:10.1073/pnas.1222469111, 2014.
Hirabayashi, Y., Mahendran, R., Koirala, S., Konoshima, L., Ya-mazaki, D., Watanabe, S., Kim, H., and Kanae, S.: Global flood risk under climate change, Nature Clim. Change, 3, 816–821, doi:10.1038/nclimate1911, 2013.
IPCC: Climate Change 2014: Impacts, Adaptation, and Vulnera-bility. Part A: Global and Sectoral Aspects, in: Contribution of Working Group II to the Fifth Assessment Report of the Inter-governmental Panel on Climate Change, edited by: Field, C. B., Barros, V. R., Dokken, D. J., Mach, K. J., Mastrandrea, M. D., Bilir, T. E., Chatterjee, M., Ebi, K. L., Estrada, Y. O., Genova, R. C., Girma, B., Kissel, E. S., Levy, A. N., MacCracken, S., Mas-trandrea, P. R., and White, L. L., Cambridge University Press, Cambridge, UK and New York, NY, USA, 1132 pp., 2014. Jongman, B., Ward, P. J., and Aerts, J. C. J. H.: Global
ex-posure to river and coastal flooding: Long term trends
and changes, Global Environ. Change, 22, 823–835,
doi:10.1016/j.gloenvcha.2012.07.004, 2012.
Jongman, B., Hochrainer-Stigler, S., Feyen, L., Aerts, J. C. J. H., Mechler, R., Botzen, W. J. W., Bouwer, L. M., Pflug, G., Ro-jas, R., and Ward, P. J.: Increasing stress on disaster-risk fi-nance due to large floods, Nat. Clim. Change, 4, 264–268, doi:10.1038/nclimate2124, 2014.
Jongman, B., Winsemius, H. C., Aerts, J. C. J. H., Coughlan de Perez, E., van Aalst, M. K., Kron, W., and Ward, P. J.: Declining vulnerability to river floods and the global benefits of adaptation, P. Natl. Acad. Sci. USA, 112, E2271–E2280, doi:10.1073/pnas.1414439112, 2015.
Jonkman, S. N.: Advanced flood risk analysis required, Nat. Clim. Change, 3, 1004–1004, doi:10.1038/nclimate2031, 2013.
Kron, W.: Flood Risk=Hazard·Values·Vulnerability, Water Int., 30, 58–68, doi:10.1080/02508060508691837, 2005.
Kundzewicz, Z. W., Kanae, S., Seneviratne, S. I., Handmer, J., Nicholls, N., Peduzzi, P., Mechler, R., Bouwer, L. M., Arnell, N., Mach, K., Muir-Wood, R., Brakenridge, G. R., Kron, W., Benito, G., Honda, Y., Takahashi, K., and Sherstyukov, B.: Flood risk and climate change: global and regional perspectives, Hydrolog. Sci. J., 59, 1–28, doi:10.1080/02626667.2013.857411, 2013. Lehner, B., Liermann, C. R., Revenga, C., Vörösmarty, C., Fekete,
B., Crouzet, P., Döll, P., Endejan, M., Frenken, K., Magome, J., Nilsson, C., Robertson, J. C., Rödel, R., Sindorf, N., and Wisser, D.: High-resolution mapping of the world’s reservoirs and dams for sustainable river-flow management, Front. Ecol. Environ., 9, 494–502, doi:10.1890/100125, 2011.
Linham, M., Green, C., and Nicholls, R.: Costs of adapta-tion to the effects of climate change in the world’s large port cities, Work stream 2, Report 14 of the AVOID pro-gramme, 238 pp., http://www.metoffice.gov.uk/media/pdf/k/s/ AVOID_WS2_D1_14_20100701.pdf (last access: April 2016), 2010.
Merz, B., Aerts, J., Arnbjerg-Nielsen, K., Baldi, M., Becker, A., Bichet, A., Blöschl, G., Bouwer, L. M., Brauer, A., Cioffi, F., Delgado, J. M., Gocht, M., Guzzetti, F., Harrigan, S., Hirschboeck, K., Kilsby, C., Kron, W., Kwon, H. H., Lall, U., Merz, R., Nissen, K., Salvatti, P., Swierczynski, T., Ulbrich, U., Viglione, A., Ward, P. J., Weiler, M., Wilhelm, B., and Nied, M.: Floods and climate: emerging perspectives for flood risk assess-ment and manageassess-ment, Nat. Hazards Earth Syst. Sci., 14, 1921– 1942, doi:10.5194/nhess-14-1921-2014, 2014.
Miller, A., Jonkman, S. N., and Van Ledden, M.: Risk to life due to flooding in post-Katrina New Orleans, Nat. Hazards Earth Syst. Sci., 15, 59–73, doi:10.5194/nhess-15-59-2015, 2015.
Milly, P. C. D., Wetherald, R. T., Dunne, K. A., and Delworth, T. L.: Increasing risk of great floods in a changing climate, Nature, 415, 514–517, 2002.
Min, S.-K., Zhang, X., Zwiers, F. W., and Hegerl, G. C.: Human contribution to more-intense precipitation extremes, Nature, 470, 378–381, 2011.
Mokrech, M., Kebede, A. S., Nicholls, R. J., Wimmer, F., and Feyen, L.: An integrated approach for assessing flood impacts due to future climate and socio-economic conditions and the scope of adaptation in Europe, Climatic Change, 128, 245–260, doi:10.1007/s10584-014-1298-6, 2015.
Munich Re: Munich Reinsurance Company Geo Risks Research: NatCatSERVICE Database, 2013.
Nicholls, R. J.: Coastal flooding and wetland loss in the 21st century: changes under the SRES climate and socio-economic scenarios, Global Environ. Change, 14, 69–86, doi:10.1016/j.gloenvcha.2003.10.007, 2004.
Nicholls, R. J., Hanson, S., Herweijer, C., Patmore, N., Hallegatte, S., Corfee-Morlot, J., Château, J., and Muir-Wood, R.: Rank-ing Port Cities with High Exposure and Vulnerability to Cli-mate Extremes: Exposure EstiCli-mates, OECD Publishing, 63 pp., doi:10.1787/011766488208, 2008.
corrected regional climate simulations, J. Geophys. Res.-Atmos., 117, D17109, doi:10.1029/2012JD017461, 2012.
Rojas, R., Feyen, L., and Watkiss, P.: Climate change and river floods in the European Union: Socio-economic consequences and the costs and benefits of adaptation, Global Environ. Change, 23, 1737–1751, doi:10.1016/j.gloenvcha.2013.08.006, 2013. Sadoff, C. W., Hall, J. W., Grey, D., Aerts, J. C. J. H., Ait-Kadi,
M., Brown, C., Cox, A., Dadson, S., Garrick, D., Kelman, J., McCornick, P., Ringler, C., Rosegrant, M., Whittington, D., and Wiberg, D.: Securing Water, Sustaining Growth: Report of the GWP/OECD Task Force on Water Security and Sustainable Growth, University of Oxford, Oxford, UK, 180 pp., 2015. Sayers, P., Li, Y., Galloway, G., Penning-Rowsell, E., Shen, F., Wen,
K., Chen, Y., and Le Quesne, T.: Flood Risk Management: A Strategic Approach, UNESCO, Paris, 202 pp., 2013.
te Linde, A. H., Bubeck, P., Dekkers, J. E. C., de Moel, H., and Aerts, J. C. J. H.: Future flood risk estimates along the river Rhine, Nat. Hazards Earth Syst. Sci., 11, 459–473, doi:10.5194/nhess-11-459-2011, 2011.
van Vuuren, D. P., Lucas, P. L., and Hilderink, H.: Downscaling drivers of global environmental change: Enabling use of global SRES scenarios at the national and grid levels, Global Environ. Change, 17, 114–130, doi:10.1016/j.gloenvcha.2006.04.004, 2007.
Ward, P. J., Jongman, B., Salamon, P., Simpson, A., Bates, P., De Groeve, T., Muis, S., de Perez, E. C., Rudari, R., Trigg, M. A., and Winsemius, H. C.: Usefulness and limitations of global flood risk models, Nat. Clim. Change, 5, 712–715, doi:10.1038/nclimate2742, 2015.
Winsemius, H. C., Van Beek, L. P. H., Jongman, B., Ward, P. J., and Bouwman, A.: A framework for global river flood risk assessments, Hydrol. Earth Syst. Sci., 17, 1871–1892, doi:10.5194/hess-17-1871-2013, 2013.
Winsemius, H. C., Aerts, J. C. J. H., van Beek, L. P. H., Bierkens, M. F. P., Bouwman, A., Jongman, B., Kwadijk, J. C. J., Ligtvoet, W., Lucas, P. L., van Vuuren, D. P., and Ward, P. J.: Global drivers of future river flood risk, Nat. Clim. Change, 6, 381–385, doi:10.1038/nclimate2893, 2016.