3084
Geolocation Based Decision Making For
Appropriate Land Use Using Machine Learning
Model
Shampa Banik, Mohammad Rezwanul Huq
Abstract: At present days, population explosion in Bangladesh has caused the land resources very limited for both upcoming industrialization and
urbanization. Here it is common scenario, that a vast amount of farming land or forests are now turned into human settlement or industrial zones which affect the agriculture significantly. Keeping aside the big crowded cities where the land resources are already rare, we focused on Rajshahi the next prospective zone of Bangladesh. Proper land assessment is direly needed to such decision making for new. Our study depicts an interesting mechanism in the field of land assessment using the technological breakthrough of GIS as well as remote sensing technology from which the spatial details can be obtained and analyzed meticulously instead of conventional site visiting that is time consuming. In this high-tech era GIS offers the satellite data that is indeed greatly effective for spatial planning and resource management. The information of LULC (Land Use Land Cover) is crucial for policy making, business and administrative purposes. The current study propounds a new approach that has made use of the remote sensed satellite data, analyzed those by Land Classification which paves the way for remote land assessment and decision making in Rajshahi for future industrialization and urbanization.
Index Terms: Area Estimation, Change Detection, Classification Scheme, Decision Support System, GIS, LULC, Landsat 8, Raster.
—————————— ——————————
1
INTRODUCTION
Currently there prevail various assessment problems of an area for developing a sustainable land use planning and proper decision-making. In general such assessment task incorporated with either site visiting or depending on available information from different sources like Local Govt. Engineering Department or local agencies. Hence, as an alternative of these ways for real time information, Remote sensing and GIS environment can be effectively used as a source or tool for rational planning of any area or region. With the technological breakthrough this remotely sensed data may be used to analyze spatial data. Landuse/landcover assessment is one of most important concepts to plan land resource management very meaningfully [3]. The concept of LULC i.e., Land use and land cover change has become a driving factor in current strategies for managing natural resources and monitoring environmental changes, potential development and nature conservation [1]. Due to rapid growth of industrialization and urbanization significant amount of vegetation rich lands such as forests and wetlands or agricultural lands are hugely converted into human settlements or industrial area [2]. If it continues likewise throughout our country, Bangladesh, for which agriculture is the backbone, the food supply will be threatened in very near future. As this is a small country burdened with Millions of population, so we should think in constructive way that is how to use our available unoccupied land properly in upcoming days.
Hence, our goal of this study is to come up with an innovative idea for Land cover assessment and thereby taking spatial planning for new urbandevelopment which may serve as new settlement with an aim to reduce population pressure from the big cities as well as establishing new industrial construction as new door for the unemployment and adding values to the national income.
2
OBJECTIVE
AND
STUDY
AREA
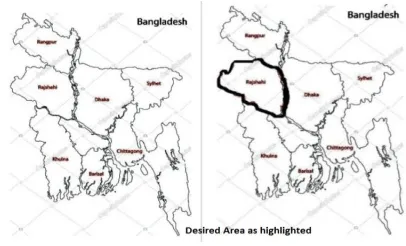
The principle objective of this study is to detect, assess and predict the trend in land use and land cover changes in the region of Rajshahi [1]. An attempt has been made to capture six land use and land cover classes accurately. The six classes were distinctly produced for the study year but with more emphasis on urban area and plantation as it reflect the impact of anthropogenic activities. In achieving this, accuracy assessment using Kappa Coefficient is also introduced into the research work to evaluate the performance of two algorithms. By comparison, result produced in the maximum likelihood classification was acceptable with kappa coefficient of 61.58% than the ISO classification. This study demonstrates LU/LC that is land use identification with the dominant ability of Remote Sensing and GIS in capturing spatio-temporal changes. This area is situated in fertile plains and is lush with greenery, and is therefore an attractive site for people to relocate to [6]. Due to this there has been a substantial amount of deforestation and urbanization in the region, which has been identified in terms of reduction in the forest area and waste land. The study area of the thesis is Rajshahi Division of Bangladesh. It is situated in the central north western region of Bangladesh. The famous Jamuna River lies across the eastern border of Rajshahi Division and another famous Padma River is on the south part of this division. In the west, this division shares a border with India. It is one of the eight first-level administrative divisions of Bangladesh. The area of this division is about 18,174.4 square kilometers (7,017.2 sq mi) [2] and a population at the 2011 Census of 18,484,858 [3]. Rajshahi Division is comprised of 8 districts, 70 Upazilas (the next lower administrative tier) and 1,092 Unions. This is one of the most valuable divisions of Bangladesh with its excellent rail and road communication _____________________________
• Shampa Banik, M.Sc in Department of Computer Science and Engineering, East West University, Dhaka, Bangladesh, E-mail: [email protected]
3085 infrastructure.
Fig 2.1: Rajshahi is highlighted in the map of Bangladesh as the study area
3
METHODOLOGY
3.1 PROPOSED METHODOLOGY
This section describes the mechanism of the study those are followed for the extensive Geo preprocessing and analysis procedures throughout the thesis. The figure below depicts the methodology of the whole procedure from the very input to the system (getting the satellite dataset) to making decision model system step by step Two independent datasets, namely MODIS 12Q1 and Landsat 8, were primarily used to derive predictor variables for land cover classification [7]. Here all the steps are employed with various kinds of tools and programming logic. The hierarchy illustrates our proposed model in a structured way to the end user like City Planner or Industrialist. The methodology is accomplished by the following steps in order to outline the analysis and processing tasks in Fig 3.1.
DATA ACQUISITION: In this study, several satellite data and local maps were collected from various sources such as the Earth explorer website (earthexplorer.usgs.gov) of USGS (United State Geological Survey). The MODIS-12Q1 images were acquired in during winter time (July 2018-July 2019), while Landsat 8 Operational Land Imager (OLI) captured the study area in early winter (September 2018-September 2019). These satellite sensors were designed to collect reflected radiation from the earth’s surface features in the visible, near-infrared and thermal near infrared portions of the electronic spectrum. Both acquired images are nearly cloud free (<10% cloud cover).
Fig 3.1: Methodological Flowchart of the System
DATA PROCESSING: After the data acquisition phase the images
are processed in ArcGIS 10.5 GIS software. These images were pre-processed and performed in ArcGIS 10.5 for clipping the study area by taking geo-referenced boundary of the Rajshahi map as Area of Interest (AOI). Landsat 8 and MODIS data were geometrically corrected using an independent set of ground control points while radiometric, atmospheric and color composites were implemented in ArcGIS 10.5 software to produce a consistent form of the datasets. Also, Landsat 8 level-8 imagery was processed to standard parameters included co-registered images and referenced coordinate systems. In this phase the Landsat 8 dataset comprised of 8 bands is processed by using the Composite Bands in Data Management Tool. The composed dataset is initially comprised with Band 1, Band2 and Band 3 for Red, Green, Blue respectively.
CLASSIFICATION: This study initially identified seven land cover
classes (agriculture, urban distribution, forest/wet land distribution, water cover and bare land and sandy land) based on band composites, supervised and unsupervised classifications and area calculation. However, during the field trip it was observed that the area of forest accounted for only small portion and noticeably mixed sparsely, while shrubs and agriculture are not clearly distinguished on the ground, which made it challenging to separate forest and farm land. Similarly, the separation of wet land and water body by the classification algorithm is not easy due to similar spectral characteristics of features. Therefore, forest and wet land were treated as forest in the classification scheme. Six land cover/land-use categories were finally identified in the study area namely agriculture, forest/wet land, sandy land, urban/built-up and water body [Table 3.1].
Table 3.1: Land Class Description
Different Land Classes Description Urban/Built Up
Rural houses and urban buildings, Industrial zones, commercial complexes and current construction areas.
Agriculture Crop and pasture Orchards, groves, nurseries and horticultural areas Other farming land Forest Deciduous, evergreen forests, shrubs and
mixed forests
Water Streams, rivers, canals, and reservoirs Lakes and ponds
Bare land Area which is still unoccupied either by urban or any farming i.e.; barren.
Sandy Land Area that is nearby river and contains sand only.
ACCURACY ASSESSMENT: The accuracy assessment involves
3086 accuracy, Kappa statistic and producers’ and users’ accuracy.
Overall accuracy (OA) for a particular classified image was calculated by assuming the number of correctly classified pixels and dividing the total number of pixels that are located along diagonal from the upper-left to lower-right position of the confusion matrix.
DECISION SUPPORT SYSTEM: A Decision Support System is a decision tree, classification procedure that recursively partitions a data set into smaller subsets based on a test defined at each branch (or node) of the tree. The tree is composed of a starting node (root), a set of internal nodes (splits), and a set of terminal nodes (leaves). Through the tree, the observations are sequentially divided by the tree, and each observation will be finally assigned a class label according to the leaf node it reaches.
4
IMPLEMENTATION
4.1 IMAGE CLASSIFICATION IN REMOTE SENSING Image
classification refers to the task of extracting information classes from a multiband raster image that results in training sets. The resulting raster or training sets from image classification can be used to create thematic maps. There are two types of classification: supervised and unsupervised based on the interaction between the analyst and the computer during classification.
4.1.2 SUPERVISED CLASSIFICATION OF THE SATELLITE IMAGERY
Remotely sensed images are applied in a wide assortment of applications like reconnaissance, creation of mapping, military and civil applications, assessment of environmental damage, land use monitoring, radiation monitoring, urban planning, growth regulation, soil evaluation, and crop yield assessments [6].Maximum likelihood classification (MLC) is most widely used supervised classification and used in a variety of applications. In MLC, a pixel is assigned to a class according to its probability of belonging to a particular class whose mean and covariance are modeled as forming a normal distribution in multispectral feature space.
MAXIMUM LIKELIHOOD CLASSIFICATION IS DONE IN THREE STAGES
I. Training Stage II. Signature File Stage III. Classification Stage
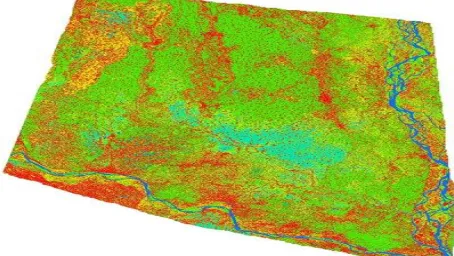
Fig 4.1: The input file (Composed Bands) of study area
Fig 4.2: Supervised Classified (ML) image
Fig 4.3: LULC map using Supervised Classification
4.1.3UNSUPERVISED CLASSIFICATION OF THE SATELLITE IMAGERY
In the context of land-cover classification with multispectral satellite data unsupervised classification that finds spectral classes (or clusters) in a multiband image without the analyst’s intervention. The Image Classification toolbar aids in unsupervised classification by providing access to the tools to create the ISO clusters, capability to analyze the quality of the clusters, and access to classification tools. It is different because it does not provide sample classes. First, how many classes to generate are identified by the user and which bands to use. Then, the software makes clusters of pixels into set number of classes. At final stage, the user identifies the land cover classes.
UNSUPERVISED ISODATA: ITERATIVE SELF-ORGANIZING DATA
ANALYSIS TECHNIQUE A
The ISO cluster algorithm is an iterative process that starts with arbitrary means being assigned by the software, one for each cluster for computing the minimum Euclidean distance when assigning each candidate cell to a cluster. Each cell is assigned to the closest of these means (all in the multidimensional attribute space).
UNSUPERVISED CLASSIFICATION (ISO) IS DONE IN THREE STAGES
3087 Fig 4.4: ISO 25 clusters in Unsupervised Classification
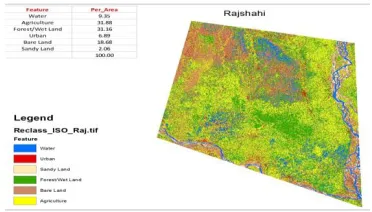
Fig 4.5: Reclassify the ISO clusters into 6 classes
Fig 4.6: LULC map using Unsupervised Classification
4.2RESULT AND DISCUSSION:
4.2.1AREA ESTIMATION:SUPERVISED CLASSIFICATION:
Table 4.1: Area of Supervised Classification
VALUE COUNT FEATURE AREA_SQ
1 1275333 Urban 114.78 8 194777 Vegetation 175.30 9 90422 Barren Land 81.38 13 12188 Water 10.97 22 27211 Low/Wet Land 24.49
4.2.2AREA ESTIMATION:UNUPERVISED CLASSIFICATION:
Table 4.2: Area of Unsupervised Classification
Value Count Feature Per_Area
1 2378634.00 Water 9.35 2 8112446.00 Agriculture 31.88 3 7929088.00 Forest/Wet Land 31.16
4 1752214.00 Urban 6.89 5 4752935.00 Bare Land 18.68 6 524100.00 Sandy Land 2.06
100.00
4.3 PERFORMANCE EVALUATION:ACCURACY ASSESSMENT:
In processing of remote sensing data correction making is a major part that includes accuracy assessment or validation is a significant step. Prospective utilization of Geodata is only possible if the quality of the data is known in reference with the data gained from earth engine. The overall accuracy of the classified image is referred by comparing each of the classified pixels with the definite land cover conditions which is obtained from their corresponding ground truth data. Producer’s accuracy calculates errors of omission, which is a measure of how well real-world land cover types can be classified. User’s accuracy measures errors of commission, which represents the likelihood of a classified pixel matching the land cover type of its corresponding real-world location like from Google Earth Pro [5]. The error matrix and kappa coefficient estimation have become a standard means of accuracy assessment of image classification accuracy. Furthermore, error matrix that is sometimes dubbed as confusion matrix in GIS terminology has been used in numerous land classification studies and were a crucial component of this research. The objective of this research is evolved with the classification of the study area using remote sensing and Geospatial Information System (GIS) techniques to carry out accuracy assessment in order to find out how well this procedure can pave the way to make a new approach for a decision maker [13]. The assessments’ results of are represented by error matrices presenting the overall accuracy, the user and producer accuracies in each category, as well as the kappa coefficients. In this stage of performance evaluation two steps are employed to determine the error percentage as follows.
4.3.1.RANDOM POINTS AND GROUND TRUTHS: The ground truths are obtained from the random values that are performed by special tool named as Create Random Points in Data Management toolset in ArcGIS software. For post-classification accuracy assessment the randomly sampled points have been created. It is somewhat a common practice to randomly select hundreds of points and label their classification types by referencing reliable sources, such as field work or human interpretation of high-resolution imagery. By taking the advantage of world imagery basemap the reference points are then compared with the classification results at the same locations.
3088 Fig 4.8: Comparing the ground truths in Google Earth Pro
Fig 4.9: Ground Truth Values
Fig 4.10: ISO Truth Percentage
4.3.2 ERROR MATRIX: Finally we calculate the error matrix by using the accuracy assessment formula done in classified raster data. Afterwards comparing the ground values with Google Earth Pro we can easily determine the total classified and total pixels from which three accuracy can be found namely
USER ACCURACY %= No of correct pixel in each category/ total no of classified pixels (row total)
PRODUCER ACCURACY %=No of correct pixel in each category/ total no of reference pixels (column total)
OVERALL ACCURACY %=Total No of correct classified pixels (diagonal)/total no of reference pixels (column total)
KAPPA COEFFICIENT (T)%= (total accuracy – random accuracy) / (1- random accuracy)
The final calculation Kappa Coefficient, the statistic that is used to control only those instances that may have been correctly classified by chance. This can be calculated using both the observed (total) accuracy and the random accuracy. Kappa can be calculated as:
Kappa Coefficient(T)%=((TS*TCS)-∑(Col.total*Row.total))/(TS2 -∑(Col.total*Row.total))
In essence, the Kappa statistic is a measure of how closely the
instances classified by the machine learning classifier matched the data labeled as ground truth, controlling for the accuracy of a random classifier as measured by the expected accuracy.
ACCURACY ASSESSMENT (SUPERVISED MLECLASSIFICATION):
Table 4.3: Accuracy Assessment of MLE
CLASS TRUTH1 TRUTH2 TRUTH3 TRUTH4 TRUTH5 TOTAL USER ACCURACY %
Urban 12 0 0 0 0 12 100
Agriculture 2 17 1 0 1 21 80.95
Bare Land 0 1 23 2 10 36 63.88
Water 1 1 9 12 2 25 48
Low/Wet Land 1 0 3 0 15 19 78.95
TOTAL 16 19 36 14 28 113
75.00 89.47 63.88 85.71 53.57
PRODUCER ACCURACY % 70
OVERALL ACCURACY %
Kappa Co-efficient of MLE
Kappa Coefficient (T)%=((TS*TCS)∑(Col.tot*Row.tot))/(TS2 -∑( Col.tot*Row.tot)) = 61.58%
ACCURACY ASSESSMENT (UNSUPERVISED ISOCLASSIFICATION):
Table 4.4: Accuracy Assessment of ISO
PREDICTED CLASS TRUTH1 TRUTH2 TRUTH3 TRUTH4 TRUTH5 TRUTH6 TOTAL USER ACCURACY %
1 Water 11 1 1 0 2 0 15 73.33
2 Agriculture 0 15 8 3 4 0 30 50.00
3 Forest/Wet Land 0 2 19 0 5 2 28 67.86
4 Urban 1 1 1 6 2 0 11 54.55
5 Bare Land 0 4 1 0 24 2 31 77.42
6 Sandy Land 0 0 0 0 0 10 10 100.00
TOTAL 12 23 30 9 37 14 125
91.67 65.22 63.33 66.67 64.86 71.43
PRODUCER ACCURACY %
68.00
OVERALL ACCURACY %
Kappa Co-efficient of MLE
Kappa Co-efficient (T) %=( (TS*TCS)-∑(Col.tot*Row.tot))/(TS2 -∑( col.tot*Row.tot)) =60.1%
4.4DECISION SUPPORT MODEL FOR APPROPRIATE LANDUSE:
3089 placing emphases on different aspects and goals (Carbonell et
al., 1983). In this study, we focus on one type of learning technology, inductive learning and its application in building knowledge bases for image analysis expert systems.
The steps of spatial analysis for the Decision Support System based on Machine Learning are as follows:
Preparing the Sample Set Generating Classification Rules
Generating a Decision Tree and Transforming to Rules
Determining Attributes Determining Attributes:
Two Parameters are considered as follows: Pixel count per polygon
Distance from River
Applying Decision Learning Method
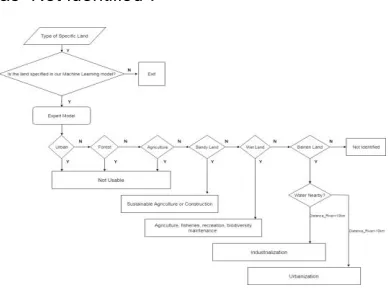
Now in the final stage, the proposed model has been introduced to make an expert intelligent decision for prospective development (Urban, Industrial constructions etc.) by using multi-band Landsat 8 images and ancillary GIS data for detecting the Land cover and Land use in Rajshahi is illustrated in Figure 4.15.
THE SUGGESTION ORIENTED DECISION TREE:
The process of applying the decision-tree method to multi-temporal Landsat 8 images and ancillary GIS data for taking decision for future development such as urbanization or industrialization in Rajshahi division is summarized by Figure 4.15.
As first step the proposed Expert System validates whether the land is specified in our model or not. After accomplishing the classification procedure the system would detect the type of land use or land cover.
If the land is classified as Urban, Forest or Agriculture counted by number of pixels from the processed raster image, the system will suggest as ―Not Usable‖ since these are already occupied, if the land is identified as Sandy Land the model will suggest for ―Sustainable Agriculture or Construction‖ as well as for Wet Land suggestion could be ―Agriculture, fisheries, recreation, biodiversity maintenance‖.
Now in context of identified Barren Land which is our main focus type of Land to make useable is categorized by the condition of Water Nearby? Or Not? Here to determine this condition one parameter called Distance from River is measured by steps of spatial analysis.
To come to an end of the decision, this ―Distance_River‖ is counted. If the Bare land is not far from (<10 km) the nearest river or water bodies then it is suggested as suitable for ―Industrialization‖ that requires substantial amount of water flows, on the other hand if the bare land is far from(>10 km) the nearest river or water bodies is suggested favorable for ―Urbanization‖. If any other land type which may not fall into these stated categories would be declared
as ―Not Identified‖.
Fig 4.11: Decision Tree of the prospective use of specific land based on Remote Sensing Model
5
CONCLUSION:
In this thesis, we addressed the problem of recognition of area coverage in Rajshahi using remote sensing technology. A discussion on different representations of different pixel values has been provided. In particular, we proposed representations of different pixels in both the discrete and continuous domains. To the matching some of the constraints imposed could be introduced directly in the representations. Three types of accuracy functions have been presented. The region of Rajshahi has been detailed, and each of its steps has been analyzed in terms of raster classification statistics and error estimation. An expert intelligent model of this algorithm is proposed for the decision support system. This contribution allows us to use remote sensing in the field of mass development in a developed country like Bangladesh which gives broad sense to solve problems with the help of Geospatial data analysis technology. The ultimate goal of our study is to devise a new model based on Machine Learning Algorithm to make decision of possibility for future advancement through urbanization and industrialization in Rajshahi division by identifying the current Land Cover and Land Use by means of remote sensing technology.
5.1
LIMITATIONS: The Remote Satellite data are sometimes vague to identify the real area coverage.
The accuracy is not 100% guaranteed by any means in remote sensing because of its inadequate Spatial Analysis.
Decision can be taken based on the pixel representation which may be somehow overlapped to each other, that results in making confusion among the user.
Getting the satellite imagery without cloud is sometimes challenging as it takes lot of time and toil to get rid of the cloud for clean image composed with multi-bands data.
The Supervised Classification is more time consuming in comparison with Unsupervised Classification.
6
ACKNOWLEDGMENT
3090 Chairperson, Associate Prof., Dept. of Computer Science and
Engineering, East West University.
7
REFERENCES
[1] Pai & Shenoy (2015), Land Use Land Cover Pattern in the Vicinity of Mannapalla Lake, Manipal. Aquatic Procedia 4 (2015) 1405 – 1412.
[2] Ganasri & Dwarakish (2015), Study of land use/land cover dynamics through classification algorithms for Harangi catchment area, Karnataka State, INDIA. Aquatic Procedia 4 (2015) 1413 – 1420.
[3] Rawat & Kumar (2015), Monitoring land use/cover change using remote sensing and GIS techniques: A case study of Hawalbagh block, district Almora, Uttarakhand, India. The Egyptian Journal of Remote Sensing and Space Sciences (2015) 18, 77–84.
[4] Huang and Jensen (10, October 1997), A Machine-Learning Approach to Automated Knowledge-Base Building for Remote Sensing Image Analysis with GIs Data, Vol. 63, No. 10, October 1997, pp. 1185-1194.
[5] L and Mohammed-Aslam (2015), Crop Pattern Mapping of Tumkur Taluk using NDVI Technique: A Remote Sensing and GIS Approach, Aquatic Procedia 4 (2015) 1397 – 1404. [6] Mengistu and Salami (24 September, 2007), Application of remote sensing and GIS inland use/land cover mapping and change detection in a part of south western Nigeria, African Journal of Environmental Science and Technology, Vol. 1 (5), pp. 099-109, December, 2007.
[7] Ha, Tuohy, Irwin and Tuan (5 July 2018), Monitoring and mapping rural urbanization and land use changes using Landsat data in the northeast subtropical region of Vietnam. [8] Petr and Martin (January 2013), Using GIS and maximum
likelihood classification to model forest altitudinal zones, DOI:10.13140/RG.2.1.3707.6969.
[9] Rwanga, S.S. and Ndambuki, J.M. (2017), Accuracy Assessment of Land Use/Land Cover Classification Using Remote Sensing and GIS. Inter-national Journal of
Geosciences, 8, 611-622,
https://doi.org/10.4236/ijg.2017.84033.
[10]Sisodia, Tiwari and Anil Kumar (2014), Analysis of Supervised Maximum Likelihood Classification for Remote Sensing Image, IEEE International Conference on Recent Advances and Innovations in Engineering (ICRAIE-2014). [11]Acharya, Yang and Lee (10 November 2015), Application of
J48 Decision Tree for the Identification of Water bodies Using Landsat 8 OLI Imagery, Conference Proceedings Paper – Sensors and Applications.
[12]Huang and Jensen (1997), A Machine-Learning Approach to Automated Knowledge-Base Building for Remote Sensing Image Analysis with GIs Data, Photogrammetric Engineering & Remote Sensing, Vol. 63, No. 10, October 1997, pp. 1185-1194.
[13]Agyemang, Heblinski, Schmieder, Sajadyan and Vardanyan (2011), Accuracy Assessment of Supervised Classification of Submersed Macrophytes Using GIS and Error Matrices: The Case of Lake Sevan, Armenia, EOMAP GmbH & Co. KG, Sonderflughafen Oberpfaffenhofen, Gilching, Germany, [email protected].
[14]Liu, Li, Shi, and Wang (2008), Monitoring Mangrove Forest Changes using Remote Sensing and GIS Data with Decision Tree Learning, WETLANDS, Vol. 28, No. 2, June 2008, pp. 336–346.