www.ocean-sci.net/8/859/2012/ doi:10.5194/os-8-859-2012
© Author(s) 2012. CC Attribution 3.0 License.
Ocean Science
Evaluation of Release-05 GRACE time-variable gravity coefficients
over the ocean
D. P. Chambers and J. A. Bonin
College of Marine Science, University of South Florida, St. Petersburg, FL, USA Correspondence to: D. P. Chambers ([email protected])
Received: 9 May 2012 – Published in Ocean Sci. Discuss.: 13 June 2012
Revised: 10 August 2012 – Accepted: 16 September 2012 – Published: 12 October 2012
Abstract. The latest release of GRACE (Gravity Recovery and Climate Experiment) gravity field coefficients (Release-05, or RL05) are evaluated for ocean applications. Data have been processed using the current methodology for Release-04 (RLRelease-04) coefficients, and have been compared to output from two different ocean models. Results indicate that RL05 data from the three Science Data Centers – the Center for Space Research (CSR), GeoForschungsZentrum (GFZ), and Jet Propulsion Laboratory (JPL) – are more consistent among themselves than the previous RL04 data. Moreover, the vari-ance of residuals with the output of an ocean model is 50– 60 % lower for RL05 data than for RL04 data. A more op-timized destriping algorithm is also tested, which improves the results slightly. By comparing the GRACE maps with two different ocean models, we can better estimate the un-certainty in the RL05 maps. We find the standard error to be about 1 cm (equivalent water thickness) in the low- and mid-latitudes, and between 1.5 and 2 cm in the polar and subpolar oceans, which is comparable to estimated uncertainty for the output from the ocean models.
1 Introduction
Several versions of mapped ocean bottom pressure (OBP) anomalies determined from GRACE (Gravity Recovery and Climate Experiment) time-variable gravity coefficients have been provided to the scientific community via the GRACE Tellus website at Jet Propulsion Laboratory (JPL) (http:// grace.jpl.nasa.gov/) from the two central GRACE Science Data System (SDS) centers (the Center for Space Research (CSR) and Helmholtz Centre Potsdam GFZ German Re-search Centre for Geosciences (GFZ)). The grids are based
on Release-04 (RL04) coefficients (Bettadpur, 2007) and are post-processed to reduce correlated errors which ap-pear as north–south stripes in the data (Swenson and Wahr, 2006), using either an ad hoc destriping algorithm and addi-tional Gaussian smoothing that was optimized for the ocean (Chambers, 2006), or by projecting GRACE data onto em-pirical orthogonal functions (EOFs) from an ocean model (Chambers and Willis, 2010). Uncertainty of the mapped data has been estimated to be between 2 and 3 cm root-mean-square (RMS) depending on the type of processing, based on comparison to steric-corrected altimetry (Chambers, 2006; Chambers and Willis, 2010), output from an ocean model (Ponte et al., 2007; Quinn and Ponte, 2010), or bottom pres-sure recorders (Morison et al., 2007; Park et al., 2008). Even with this level of uncertainty, however, the mapped OBP data from GRACE have proven useful in a number of studies as disparate as, for example, studying low-frequency changes in the Arctic (Morison et al., 2007) or the North Pacific (bers and Willis, 2008; Song and Zlotnicki, 2008; Cham-bers, 2011), variability of the Antarctic Circumpolar Cur-rent transport (Zlotnicki et al., 2007; Boening et al., 2010; Bergmann and Dobslaw, 2012), exchange of mass between basins (Ponte and Quinn, 2009; Chambers and Willis, 2009), or record anomalous pressure changes in the Southern Ocean (Boening et al., 2011).
860 D. P. Chambers and J. A. Bonin: Release-05 GRACE time-variable gravity coefficients
de-aliasing models for Level-2 processing. The goal of this article is to analyze these new GRACE data over the ocean in a similar fashion as the older data and quantify the im-provement of RL05 data over RL04. This will be done by comparing GRACE OBP with that output from two differ-ent ocean models. This should give a more accurate un-certainty estimate than comparing to OBP derived from al-timetry corrected for either seasonal steric variations (Cham-bers, 2006) or monthly steric fluctuations (Chambers and Willis, 2010), as these data tend to have unresolved interan-nual steric fluctuations and/or sample mesoscale eddies that are far larger than OBP variations. Moreover, recent studies comparing RL04 GRACE data to ocean models have shown better agreement than earlier studies (e.g., Quinn and Ponte, 2010), suggesting models are now producing more reason-able low-frequency OBP variations. By comparing GRACE to two different models and by comparing the models to one another, we will show a method to estimate uncertainty in the GRACE maps as well as those from the models.
After demonstrating that the RL05 data are significantly improved over the RL04 data using the same post-processing methods, we will further investigate whether the parameters of the destriping algorithm can be relaxed for the RL05 data and still allow for similar or lower uncertainty. Section 2 will give an overview of the post-processing steps and ocean models used for the analysis, Sect. 3 will present the compar-ison between RL04 and RL05 maps and the error analysis, Sect. 4 will examine whether the destriping algorithm can be relaxed without increasing uncertainty, and Sect. 5 will sum-marize the optimal processing of GRACE RL05 gravity data when examining ocean bottom pressure.
2 Review of Release-04 data processing and ocean models
Details of the post-processing of released GRACE grav-ity coefficients to produce de-striped coefficients for ocean applications, and converting from gravity coefficients to mapped OBP in terms of equivalent sea level can be found in Chambers (2006) and Chambers and Schr¨oter (2011). Here, we will review steps and point out improvements that are used in the current RL04 post-processing, implemented af-ter Chambers (2006).
First, a long-term mean gravity field is removed from the coefficients to remove the time-invariant signal related to the solid earth gravity. This is done by averaging the monthly gravity coefficients reported by CSR, GFZ, and JPL be-tween January 2005 and December 2010, and removing the mean coefficient from each month to compute anomalies. The monthly degree 2, order 0 coefficients estimated with GRACE are replaced with those from a satellite laser ranging analysis (Cheng and Tapley, 2004), due to significant errors in observing that coefficient with GRACE. Monthly geocen-ter estimates based on the method of Swenson et al. (2008)
have been applied, as GRACE does not detect these. The method is based on a combination of GRACE gravity coeffi-cients over the land and ice sheets and OBP from a model, in-cluding mean ocean mass variability. A correction for glacial isostatic adjustment (GIA) has been applied based on the model by Paulson et al. (2007), in order to remove the sec-ular trend in the gravity field that is not due to the recent redistribution of water over the Earth’s surface (Chambers et al., 2010).
The GRACE coefficients have correlated errors that map into vertical stripes as first described by Swenson and Wahr (2006). In Chambers (2006), we modified the algorithm pro-posed by Swenson and Wahr (2006) to make it more appli-cable to the longer-wavelength, small amplitude OBP varia-tions and tested it on RL02 data. In processing the RL04 data, we found that several parameters in the filter could be relaxed and still provide maps without significant stripes. The filter that has been implemented for RL04 coefficients is gener-ally the same as the one described in Chambers (2006) ex-cept that it keeps the lower 11×11 portion of the coeffi-cients unchanged (increased from the lower 7×7) as well as all order 0 and order 1 coefficients. A 5th order polyno-mial is fit as a function of even or odd degree (n) to the re-maining coefficients (reduced from a 7th order polynomial) for each order (m) greater than 2 fromn=12 (orn=mif
m >11) up ton=60. Only one polynomial is computed for each odd or even set for a given order unlike the method of Swenson and Wahr (2006), which calculates multiple poly-nomials for each series as a running computation. Only coef-ficients up tom=40 are de-striped. Every coefficient above
n=40,m=40 is set to zero (reduced from n=80). The max-imum order has been reduced from the filter in Chambers (2006) because CSR RL04 coefficients were only solved to
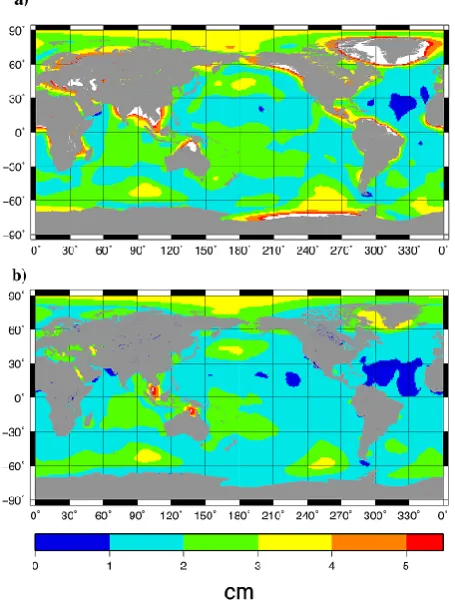
n=60, m=60, and there is little difference in OBP over the open ocean from a model truncated at degree/order 40 compared to full resolution, provided the data are not fur-ther smoothed with a Gaussian with a radius longer than ap-proximately 500 km (Fig. 1). Although differences in shallow water are larger due to shorter-wavelength barotropic fluctu-ations, GRACE will have problems observing these due to leakage of much larger land hydrology fluctuations, so the al-gorithm is optimized for finding long-wavelength open ocean OBP variations. The filter is applied to the coefficients of each month and each center separately, as the correlated er-rors differ from month-to-month and center-to-center.
Fig. 1. Standard deviation of differences between unsmoothed OBP from JPL ECCO and (a) JPL ECCO OBP truncated to spherical harmonic degree/order 40 and smoothed with a 300 km Gaussian, (b) JPL ECCO OBP truncated to degree/order 40 and smoothed with a 500 km Gaussian, and (c) JPL ECCO OBP truncated to de-gree/order 40 and smoothed with a 750 km Gaussian.
the combination reflects the unaliased monthly OBP that would have been sensed by GRACE if no model was used (Chambers and Willis, 2009).
Due to the large-scale smoothing used to extract the small amplitude OBP variations, larger variations from land hy-drology and ice mass loss will leak into the ocean near the land-ocean boundary, extending out by about 500 km (Fig. 2). In Chambers (2006), we simply masked these data out. For the Release-04 processing, however, we used a method first proposed by Wahr et al. (1998) to use GRACE observations over land as a model of the land mass
variabil-Fig. 2. Standard deviation of OBP from GRACE (CSR RL05) (a) without leakage correction and (b) with leakage correction.
ity to compute and remove the leaked signal. We could have used output from a land hydrology model, but this has sev-eral deficiencies. First, no global hydrology model contains the mass losses from the ice sheets or glaciers, which are now the largest mass fluctuations in the GRACE observations. Second, hydrology models tend to model soil moisture and snow fairly well, but not surface water or groundwater. Since GRACE will observe both the ice losses and combined hy-drology variations, it provides a better estimate of the signals than just a hydrology model. To compute the leaked signals, we first compute the gridded mass densities from GRACE data with no filtering. Then we mask out ocean areas and convert the land-only mass variations back to gravity coeffi-cients. These are then destriped and smoothed identically to the processing used to compute the OBP maps, and the val-ues over the ocean are subtracted to remove the leaked sig-nal. The method removes the majority of the leakage around continents (Fig. 2), although there is some residual leakage left around Greenland and the Alaskan glaciers that even this method cannot fully reduce.
862 D. P. Chambers and J. A. Bonin: Release-05 GRACE time-variable gravity coefficients
(ECCO) consortium. We use monthly values of ocean bot-tom pressure derived from version kf080 that is available at http://grace.jpl.nasa.gov. This version of JPL ECCO is a baroclinic model forced by winds, pressure, and heat and freshwater fluxes from the National Center for Environmen-tal Prediction (NCEP) operational analyzes products and also assimilates satellite altimetry (Fukumori, 2002; Kim et al., 2007). The JPL ECCO model extends only between±78◦ latitude; therefore, does not model OBP fluctuations in the Arctic Ocean or near Antarctica. Large differences between GRACE and JPL ECCO at these boundaries should probably be considered errors in the model because of this limitation.
The GRACE project uses output from the Ocean Model for Circulation and Tides (OMCT) to compute high-frequency OBP in order to de-alias GRACE data during processing (Thomas, 2002; Flechtner, 2007). Similar to ECCO, this is a baroclinic model forced by winds, pressure, and heat and freshwater fluxes from the ECMWF operational analyzes. Unlike JPL ECCO, OMCT models the entire ocean, includ-ing the Arctic and Antarctic. The monthly average OBP from this model (combined with overlying atmospheric pressure and estimated only over days when GRACE data was avail-able) is distributed as GAD files along with the GRACE grav-ity coefficients. There are significant differences between the RL04 version of the OMCT model and the RL05 version, mainly to improve resolution and incorporate changes in pa-rameterization that allowed better matches with in situ ob-servations not available when the original version was held fixed for GRACE processing. One aspect that has improved is the high-frequency variability, which is important for de-aliasing. The RL04 version has been shown to have signifi-cant deficiencies at periods less than a month in two recent studies (Bonin and Chambers, 2011; Quinn and Ponte, 2011, 2012). For this analysis, we will use the RL05 version, based on the distributed GAD files.
Neither ECCO nor OMCT model the time-variable global mean fluctuation in OBP caused by the exchange of water mass among the land, ocean, and atmosphere which GRACE does measure (e.g., Chambers et al., 2004, 2010). If this dif-ference was not accounted for, the RMS of difdif-ferences would be biased high due to missing this nearly 1 cm annual sig-nal. In order to make the models consistent with the GRACE observed OBP, we add the GRACE observation of monthly mean ocean mass to the JPL ECCO and OMCT grids before computing statistics. Moreover, JPL ECCO does not con-tain the time-variable global mean fluctuation in OBP due to changes in the mean atmospheric pressure over the ocean (e.g., Ponte et al., 2007), which is a 0.6 cm seasonal varia-tion. This is included in the GAD coefficients (and so is also included in the GRACE observations). To make data consis-tent, we add the monthly mean pressure from the GAD data to JPL ECCO.
3 Analysis of Release-05 data
The new RL05 coefficients were initially processed exactly as the RL04 coefficients described in Sect. 2, with the excep-tion that the geocenter estimates are based on RL05 GRACE gravity data combined with RL05 Atmosphere-Ocean De-aliasing (AOD) OBP from the GAD files using the method described in Swenson et al. (2008). The C2,0coefficients in
the GFZ RL05 solutions are considerably closer to the SLR estimates than either the CSR RL05 or JPL RL05 solutions, likely because GFZ uses a background time-variable gravity model based on RL04 coefficients where the C2,0value had
been replaced with that from SLR. We tested statistics with and without replacing the C2,0coefficient in the GFZ RL05
data, and found they were not significantly better. Since re-placing the C2,0 coefficient is still required for CSR RL05
and JPL RL05, we chose to replace the coefficient for con-sistency.
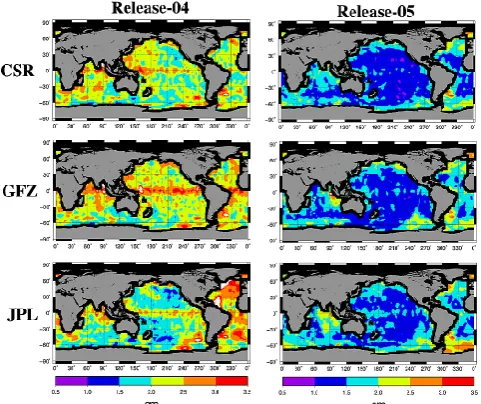
To demonstrate the reduced uncertainty in the RL05 data, the JPL ECCO OBP maps (unsmoothed) are subtracted from the destriped and 300 km smoothed RL04 and RL05 OBP maps and the standard deviation of the residuals are com-puted (Fig. 3). Note that for the rest of the analysis, we mask out areas within 500 km of coastlines. This is to focus at-tention on the deep ocean where OBP variations are longer-wavelength and more resolvable by GRACE, and to quantify accurate statistics for the deeper ocean areas that are unbi-ased by higher errors near the coast. Coastal regions have very large, short-wavelength signals related to baroclinic in-teractions with the shelves, which are present to some extent in the JPL ECCO data (Fig. 1), but will never be resolvable in GRACE. Additionally, even with the leakage correction de-scribed in Sect. 2, GRACE data still have higher uncertainty in near-coastal waters.
The improvement in the RL05 maps is obvious. The stan-dard deviation of RL05 residuals is generally less than 2 cm throughout the ocean, and often less than 1.5 cm. Compare that with RL04 residuals, where the standard deviation is generally greater than 2 cm, and often more than 3 cm. The maps from the three processing centers are also more consis-tent in RL05 than RL04. GFZ RL04 was generally noisier in the mid-latitudes than either CSR RL04 or JPL RL04, and JPL RL04 had very large errors in the Atlantic Ocean (pre-viously noted by Quinn and Ponte, 2010). To better quantify improvement we compute the variance reduction (1var) as
1var=100×var(1RL04-ECCO)−var(1RL05-ECCO)
var(1RL04-ECCO)
, (1) where var(1RL04-ECCO) is the variance of the residuals
between RL04 maps and JPL ECCO maps in each grid, var(1RL05-ECCO) is the variance of the residuals between
Fig. 3. Standard deviation of differences between unsmoothed OBP from JPL ECCO and GRACE mapped OBP (destriped, 300 km Gaussian) for Release-04 (left column) and Release-05 (right col-umn), using coefficients processed by CSR (top), GFZ (middle), and JPL (bottom).
indicating an improvement, while if it is negative, RL05 maps are more different from JPL ECCO than RL04. Val-ues are plotted in Fig. 4. The overall improvement, in terms of variance reduction relative to RL04 residuals, is between 50 % and 80 % over the majority of the ocean. The correla-tion between OBP from RL05 and that of JPL ECCO is also significantly higher, with most values above 0.7 and many above 0.8 (Fig. 5).
As the JPL ECCO model does not include the Arctic, this area will be examined using in situ data from a pair of Arc-tic bottom pressure recorders (ABPR) deployed at the North Pole by the North Pole Environmental Observatory pro-gram (Morison et al, 2007; data available from http://psc.apl. washington.edu/northpole/Data.html). Recorder ABPR1 (lo-cation: 89◦15.260N, 60◦21.580E) reported continually from 2005–2010. ABPR3 (location: 89◦14.850N, 148◦7.540E) re-ported continually from 2005–2008. The data were aver-aged over the first three years, detrended, and de-tided as explained by Peralta-Ferriz et al. (2011). The ABPR series is averaged into monthly points, to match the GRACE time resolution.
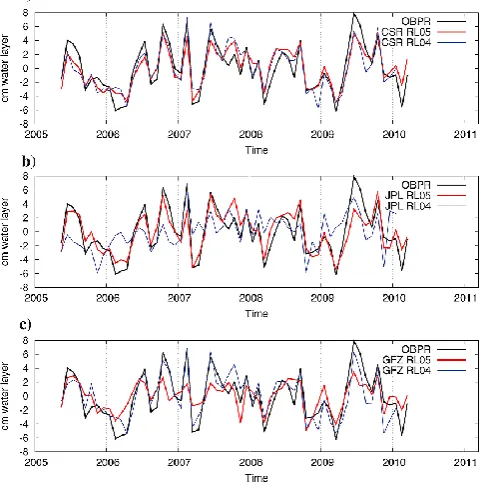
Average OBP from RL04 and RL05 GRACE data from CSR, JPL, and GFZ were computed in a 5◦ cap around the North Pole and compared to the ABPR data (Fig. 6). Correlations of the APBR data with GRACE are generally high. The correlation of APBR with CSR RL04 was 0.86, which altered only slightly (to 0.89) upon updating to RL05. JPL’s correlation with the APBR improved from 0.48 (RL04) to 0.87 (RL05). However, the correlation between the GFZ arctic data and the APBR decreased slightly from 0.87 for
Fig. 4. Percent of variance reduced in Release-05 residuals com-pared to Release-04 residuals for coefficients processed by CSR (top), GFZ (middle), and JPL (bottom). Positive values mean the Release-05 residual variance is reduced, negative values mean that variance is increased relative to Release-04. All GRACE data were destriped and smoothed with a 300 km Gaussian. Please see text and Eq. (1) for details of the calculation.
RL04 to 0.77 for RL05. Additionally, the variability of the GFZ RL05 Arctic signal (2.0 cm) is only 70 % of the size of the other two RL05 GRACE signals (2.8 cm for CSR, 2.9 cm for JPL) and 58 % of the size of the ABPR vari-ability (3.5 cm). The standard deviation of the residuals with the ABPR are 1.6 cm (CSR RL05), 1.7 cm (JPL RL05), and 2.3 cm (GFZ RL05). These results suggest an unexplained reduction in real OBP variability in the GFZ RL05 data that is not seen in either the CSR or JPL solutions. This is sur-prising, considering that the GFZ results are consistent with JPL and CSR in other basins (e.g., Fig. 4). One major differ-ence between the CSR, JPL, and GFZ RL05 processing is the use of background ocean tide models. CSR and JPL use the GOT4.8 model, while GFZ uses the EOT11a version. This may be the source of the difference, and should be investi-gated further by the processing centers.
864 D. P. Chambers and J. A. Bonin: Release-05 GRACE time-variable gravity coefficients
Fig. 5. Correlation between unsmoothed OBP from JPL ECCO and GRACE mapped OBP (destriped, 300 km Gaussian) for Release-04 (left column) and Release-05 (right column), using coefficients processed by CSR (top), GFZ (middle), and JPL (bottom). Only values greater than 0.4 (the 99 % significance level) are shown.
Arctic, for the remainder of this study, we will utilize only the CSR RL05 grids to assess uncertainty and optimal smooth-ing. Although we do not show it, the results using the GFZ and JPL coefficients for the following tests are essentially the same, so our conclusions will apply to the new data from either CSR, GFZ, or JPL.
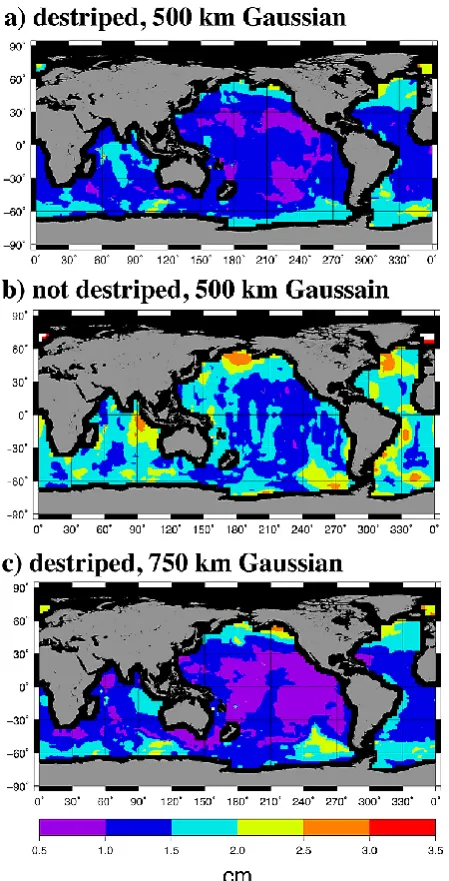
The RL04 maps on the GRACE Tellus website are cur-rently produced using three different Gaussian smoothers in addition to the destriping algorithm (300 km, 500 km, 750 km). An analysis by Ponte et al. (2007) concluded that the 750 km version had lowest residuals with another ver-sion of the ECCO model. If we compare the RL05 data smoothed with different Gaussian smoothers to the un-smoothed JPL ECCO OBP, we find that 500 km un-smoothed maps have significantly lower standard deviations (Fig. 7), compared to either the 300 km (shown in Fig. 3) or 750 km smoothing. The 300 km smoothing is still likely noisier, as evidenced by higher residuals in the tropics where the sig-nal is low, while the 750 km sigsig-nal is likely a more attenu-ating signal, as evidenced by an increase in residuals in the high-latitudes where OBP variability is highest in both the RL05 residuals (Fig. 7), and in residuals of the JPL ECCO model smoothed with various Gaussians (Fig. 1). However, the 750 km smoother does noticeably reduce noise in the tropics where the signal is lower. We have examined ad-ditional smoothing radii between 300 km and 600 km, and 500 km does have a near minimum mean standard deviation of residuals of 1.3 cm, compared to 1.6 cm for 300 km. Note that some sort of destriping algorithm is still required; simply smoothing the coefficients with a 500 km Gaussian results in
Fig. 6. Time series of OBP at the North Pole measured by a BPR (black line) and (a) CSR RL04 & CSR RL05, (b) JPL RL04 & JPL RL05, and (c) GFZ RL04 & GFZ RL05.
residuals with a mean standard deviation of 1.7 cm and dif-ferences that are larger than destriping and smoothing with a 300 km Gaussian (Fig. 7).
We can also compare the RL05 maps with the new de-aliasing model (Fig. 8). Note the significantly larger residu-als at the higher latitudes in the Southern Ocean than when compared to JPL ECCO. This is the area where the older de-aliasing model was shown to be deficient (e.g., Bonin and Chambers, 2011). Apparently, the new OMCT model still has issues in this region, but it appears that the GRACE data have corrected it so that they agree better with JPL ECCO. JPL ECCO likely performs better here because it assimilates altimetry, and these regions have strong barotropic signals that are reflected in sea level.
If we assume uncorrelated error between the GRACE data and ocean models and between the models, we can use the standard deviation of the residuals (σ ) computed between the three different mapped data sets (JPL ECCO, AOD, and GRACE) to estimate standard error (ε)in each set of data:
σE-A2 =ε2E+ε2A σG-E2 =ε2G+εE2 σG-A2 =ε2G+εA2 εG=
q
σG-A2 +σG-E2 −σE-A2
2
εE=
q
σG-E2 −εG2 εA=
q
σG-A2 −ε2G
Fig. 7. Standard deviation of differences between unsmoothed OBP from JPL ECCO and CSR RL05 mapped OBP for (a) destriping and 500 km Gaussian, (b) no destriping and 500 km Gaussian, and (c) destriped and 750 km Gaussian.
where E, A, and G represent JPL ECCO, AOD (i.e., OBP from GAD files), and GRACE, respectively. The two mod-els share some common heritage, in the form of the starting primitive equations, and so will have some common errors. This means that the assumptions underlying Eq. (2) are not strictly valid. However, there are substantial differences in the models, such as the fact that JPL ECCO assimilates data while AOD is simply a forced run, the winds, heat and fresh-water fluxes come from two very different numerical weather prediction models, and parameterization of smaller-scale fea-tures (eddies, bathymetry) are different. Thus, we believe that
Fig. 8. Standard deviation of differences between unsmoothed OBP from RL05 AOD model and CSR RL05 mapped OBP that has been destriped and smoothed with a 500 km Gaussian.
the differences are far larger than the potential common er-rors, and that Eq. (2) is a reasonable approximation to com-puting a better standard error in the GRACE maps then sim-ply using the difference between GRACE and any one model, since this assumes no error in the model. The largest differ-ences between the models are found in shallow waters and at high latitudes, while the smallest differences are found in the tropics where there are no significant OBP variations. The small difference in the tropics means that the computation of eitherεA orεEsometimes results in a negative sign. When
this happens, we assume uncertainty isσE-A(the difference
between the models), which is an upper bound of the uncer-tainty, as it assumes one model has no error. The computation forεGdoes not suffer from this problem, but when the value
ofεAorεEis replaced, we also replace the value ofεG
com-puted in Eq. (2) withσG-E(the difference between GRACE
and JPL ECCO), which again represents an upper bound of the error. This occurs in less than 5 % of the grids, all in the tropics.
866 D. P. Chambers and J. A. Bonin: Release-05 GRACE time-variable gravity coefficients
Fig. 9. Estimated standard error in mapped OBP based on Eq. (1) for (a) CSR RL05 (destriped, 500 km Gaussian), (b) JPL ECCO (unsmoothed), and (c) RL05 AOD (unsmoothed).
Antarctica), likely due to leakage of the large mass loss trends into the ocean. GRACE OBP in these areas should be used with caution.
We have also evaluated the GRACE OBP maps after pro-jecting onto EOFs from a model, which has been used pre-viously to reduce noise even further (Chambers and Willis, 2010). We tested using EOFs from both the new RL05 AOD model and JPL ECCO, and ranging from using 10 EOF modes to 20 EOF modes. We found a minimum uncertainty estimate using 15 EOFs and patterns from the AOD model. This suggests that although the magnitude and variability of
the AOD model OBP on monthly scales may not be as con-sistent with GRACE as JPL ECCO is, the patterns of where the variability occurs is. Moreover, using the AOD model al-lows for the recovery of Arctic Ocean variability. The un-certainty of the EOF reconstructed (EOFR) OBP maps from GRACE is significantly lower than using the destriping al-gorithm alone, with a mean of 0.7 cm (Fig. 10). Uncertainty was computed using Eq. (2); the uncertainty estimated for JPL ECCO and AOD is not shown as it is almost identical to that computed with the destriping algorithm (Fig. 9). Us-ing the EOFR filterUs-ing reduces the error around ice sheets and glaciers dramatically, and also reduces noise in the mid-latitudes where OBP variability is low.
4 Tests of destriping algorithm
Now that the Release-05 data have been shown to be more accurate than Release-04 data using the same destriping al-gorithm, we test whether changing parameters of the algo-rithm will further reduce the uncertainty. For these tests, we will always truncate coefficients to degree/order 40 and use an additional 500 km smoother, as these have been shown to not significantly attenuate expected OBP variability in the deep ocean (Fig. 1), and give the lowest residuals with the current algorithm.
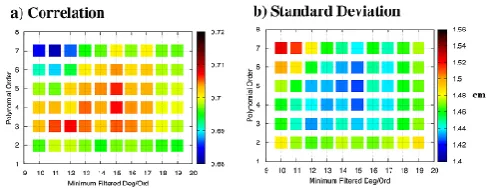
This leaves two parameters to adjust: the choice of lower-degree and order coefficients to leave unmodified, and the order of the polynomial. We compute a variety of destriped CSR RL05 series, varying the onset of destriping from a minimum degree/order of 10 to 19, and the polynomial order from 2 (quadratic) to 7. We then compute the correlation of each 6-yr destriped set of GRACE maps with the unsmoothed JPL ECCO maps, and also compute the standard deviation of the residuals. To determine which combination of destriping parameters best reduces differences between GRACE and JPL ECCO, we examine the average correlation and stan-dard deviation (Fig. 11). For comparison, with no destriping, but only a 500 km Gaussian smoothing applied, the average correlation between CSR RL05 (to maximum degree/order 40) and JPL ECOO is 0.67 and the standard deviation of the residuals is 1.7 cm.
Fig. 10. Estimated standard error in mapped OBP based on Eq. (1) for EOFR filtered CSR RL05 data.
Fig. 11. Statistics comparing different destriping parameterizations with JPL ECCO: (a) correlation, and (b) standard deviation of residuals, both averaged over ocean grids.
this is generally in areas where the variance is already low (standard deviation<1 cm), so a 30 % increase in variance is less than 0.2 cm. We consider this acceptable since the filter reduces variance in many areas where the original variance was high (standard deviation>2 cm).
5 Conclusions
The Release-05 processing is a significant step forward in reducing noise in the GRACE gravity coefficients. For the wavelengths that are most useful for studying ocean bot-tom pressure variations in the deep ocean (>1000 km), an optimal destriping filter plus additional 500 km Gaussian smoother results in OBP that has an estimated standard er-ror of∼1 cm over the mid- and low-latitudes, and between 1.5 and 2 cm at high-latitudes where OBP variations are high and around ice sheets and ocean-terminating glaciers. The uncertainty at high latitudes is slightly higher than that esti-mated for JPL ECCO, but is less than that estiesti-mated for the atmosphere–ocean de-aliasing model used in GRACE pro-cessing. Applying a further filter by projecting the data onto EOF modes from a model reduces the uncertainty to a point where it is comparable to that estimated for JPL ECCO.
Fig. 12. Percent of variance reduced using new optimal destrip-ing parameters and 500 km smoothdestrip-ing compared to those used for RL04, also using 500 km Gaussian smoothing. Positive values mean the variance with the new algorithm is reduced, negative values mean that variance is increased.
Results are virtually the same for data from all three processing centers (CSR, GFZ, JPL) except in the Arctic, where there is evidence that GFZ has lower signal than ex-pected, but CSR and JPL have similar variability as a bot-tom pressure recorder. Although the modified destriping fil-ter that is proposed does increase variance of residuals with JPL ECCO in some areas, the overall average reduction is positive (especially in the Southern Ocean), and we believe it is better to under-filter the GRACE data than to over-filter it.
Acknowledgements. We would like to thank S. Bettadpur, F. Flechtner, B. Tapley, and M. Watkins for comments on early presentations of these results, and for their work to produce the Release-05 gravity solutions. We would also like to thank I. Fukumori for making the output of JPL ECCO available to a wide-community as ocean bottom pressure anomalies, and to J. Morison and C. Peralta-Ferriz for sharing the bottom pressure recorder data with us. This work was funded through a subcontract with the Jet Propulsion Laboratory to support the NASA “Making Earth System Data Records for Use in Research Environments” (MEASURES) Programs. Data described in this paper are available at: http://grace.jpl.nasa.gov.
Edited by: D. Stevens
References
Bergmann, I. and Dobslaw, H.: Short-term transport vari-ability of the Antarctic Circumpolar Current from satel-lite gravity observations, J. Geophys. Res., 117, C05044, doi:10.1029/2012JC007872, 2012.
868 D. P. Chambers and J. A. Bonin: Release-05 GRACE time-variable gravity coefficients
Bettadpur, S.: UTCSR Level-2 Processing Standards Document for Level-2 Product Release 0005, GRACE 327–742, CSR Publ. GR-12-xx, Rev. 4.0, University of Texas at Austin, 16 pp., 2012. B¨oning, C., Timmermann, R., Danilov, S., and Schr¨oter, J.: On the representation of transport variability of the Antarctic Circum-polar Current in GRACE gravity solutions and numerical ocean model simulations, in: Satellite Geodesy and Earth System Sci-ence, edited by: Flechtner, F., Gruber, T., G¨untner, A., Man-dea, M., Rothacher, M., Sch¨one, T., and Wickert, J., Springer-Verlag, Berlin, Heidelberg, Part 2, 187–199, doi:10.1007/978-3-642-10228-8 15, 2010.
Boening, C., Lee, T., and Zlotnicki, V.: A record-high ocean bot-tom pressure in the South Pacific observed by GRACE, Geophys. Res. Lett., 38, L04602, doi:10.1029/2010GL046013, 2011. Bonin, J. A. and Chambers, D. P.: Evaluation of
high-frequency oceanographic signal in GRACE data: Implica-tions for de-aliasing, Geophys. Res. Lett., 38, L17608, doi:10.1029/2011GL048881, 2011.
Chambers, D. P.: Evaluation of new GRACE time-variable grav-ity data over the ocean, Geophys. Res. Lett., 33, L17603, doi:10.1029/2006GL027296, 2006.
Chambers, D. P.: ENSO-correlated fluctuations in ocean bottom pressure and wind-stress curl in the North Pacific, Ocean Sci., 7, 685–692, doi:10.5194/os-7-685-2011, 2011.
Chambers, D. P. and Willis, J. K.: Analysis of large-scale ocean bottom pressure variability in the North Pacific, J. Geophys. Res., 113, C11003, doi:10.1029/2008JC004930, 2008.
Chambers, D. P. and Willis, J. K.: Low-frequency exchange of mass between ocean basins, J. Geophys. Res., 114, C11008, doi:10.1029/2009JC005518, 2009.
Chambers, D. P. and Willis, J. K.: A Global Evaluation of Ocean Bottom Pressure from GRACE, OMCT, and Steric-Corrected Altimetry, J. Atmos. Ocean. Tech., 27, 1395–1402, doi:10.1175/2010JTECHO738.1, 2010.
Chambers, D. P. and Schr¨oter, J.: Measuring Ocean Mass Vari-ability from Satellite Gravimetry, J. Geodynamics, 52, 333–343, doi:10.1016/j.jog.2011.04.004, 2011.
Chambers, D. P., Wahr, J., and Nerem, R. S.: Preliminary obser-vations of global ocean mass variations with GRACE, Geophys. Res. Lett., 31, L13310, doi:10.1029/2004GL020461, 2004. Chambers, D. P., Wahr, J., Tamisiea, M. E., and Nerem, R. S.: Ocean
mass from GRACE and Glacial Isostatic Adjustment, J. Geo-phys. Res., 115, B11415, doi:10.1029/2010JB007530, 2010. Cheng, M. and Tapley, B. D.: Variations in the Earth’s
oblate-ness during the past 28 years, J. Geophys. Res., 109, B09402, doi:10.1029/2004JB003028, 2004.
Dahle, C., Flechtner, F., Gruber, C., K¨onig, D., K¨onig, R., Micha-lak, G., and Neumayer, K.-H.: GFZ GRACE Level-2 Process-ing Standards Document for Level-2 Product Release 0005, Sci-entific Technical Report – Data, Potsdam, Germany, 20 pp., doi:10.2312/GFZ.b103-12020, 2012.
Flechtner, F.: AOD1B Product Description Document for Product Releases 01 to 04, GRACE 327–750, CSR publ. GR-GFZ-AOD-0001 Rev. 3.1, University of Texas at Austin, 43 pp., 2007. Fukumori, I.: A partitioned Kalman filter and smoother, Mon.
Weather Rev., 130, 1370–1383, 2002.
Kim, S. B., Lee, T., and Fukumori, I.: Mechanisms Control-ling the Interannual Variation of Mixed Layer Temperature Av-eraged over the Ni˜no-3 Region, J. Climate, 20, 3822–3843,
doi:10.1175/JCLI4206.1, 2007.
Marshall, J., Adcroft, A., Hill, C., Perelman, L., and Heisey, C.: A finite-volume, incompressible Navier-Stokes model for studies of the ocean on parallel computers, J. Geophys. Res., 102, 5753– 5766, 1997.
Morison, J., Wahr, J., Kwok, R., and Peralta-Ferriz, C.: Recent trends in Arctic Ocean mass redistribution revealed by GRACE, Geophys. Res. Lett., 34, L07602, doi:10.1029/2006GL029016, 2007.
Park, J., Watts, D., Donohue, K., and Jayne, S.: A comparison of in situ bottom pressure array measurements with GRACE estimates in the Kuroshio Extension, Geophys. Res. Lett., 35, L17601, doi:10.1029/2008GL034778, 2008.
Paulson, A., Zhong, S., and Wahr, J.: Inference of mantle viscosity from GRACE and relative sea level data, Geophys. J. Int., 171, 497–508, doi:10.1111/j.1365-246X.2007.03556.x, 2007. Peralta-Ferriz, C., Morison, J. H., Wallace, J. M., and Zhang,
J.: A basin-coherent mode of sub-monthly variability in Arc-tic Ocean bottom pressure, Geophys. Res. Lett., 38, L14606, doi:10.1029/2011GL048142, 2011.
Ponte, R. M. and Quinn, K. J.: Bottom pressure changes around Antarctica and wind-driven meridional flows, Geophys. Res. Lett., 36, L13604, doi:10.1029/2009GL039060, 2009.
Ponte, R. M., Quinn, K. J., Wunsch, C., and Heimbach, P.: A com-parison of model and GRACE estimates of the large-scale sea-sonal cycle in ocean bottom pressure, Geophys. Res. Lett., 34, L09603, doi:10.1029/2007GL029599, 2007.
Quinn, K. J. and Ponte, R. M.: Uncertainty in ocean mass trends from GRACE, Geophys. J. Int., 181, 762–768, doi:10.1111/j.1365-246X.2010.04508.x, 2010.
Quinn, K. J. and Ponte, R. M.: Estimating high frequency ocean bottom pressure variability, Geophys. Res. Lett., 38, L08611, doi:10.1029/2010GL046537, 2011.
Quinn, K. J. and Ponte, R. M.: High frequency barotropic ocean variability observed by GRACE and satellite altimetry, Geophys. Res. Lett., 39, L07603, doi:10.1029/2012GL051301, 2012. Song, Y. T. and Zlotnicki, V.: Subpolar ocean-bottom-pressure
os-cillation and its links to the tropical ENSO, Int. J. Remote Sens-ing, 29, 6091–6107, doi:10.1080/01431160802175538, 2008. Swenson, S. C. and Wahr J.: Post-processing removal of
corre-lated errors in GRACE data, Geophys. Res. Lett., 33, L08402, doi:10.1029/2005GL025285, 2006.
Swenson S. C., Chambers, D. P., and Wahr, J.: Estimating geocenter variations from a combination of GRACE and ocean model out-put, J. Geophys. Res., 113, B08410, doi:10.1029/2007JB005338, 2008.
Thomas, M.: Ocean induced variations of Earth’s rotation – Results from a simultaneous model of global ocean circulation and tides, Ph. D. diss., Univ. of Hamburg, Germany, 129 pp., 2002. Wahr, J., Molenaar, M., and Bryan, F.: Time-variability of the
Earth’s gravity field: Hydrological and oceanic effects and their possible detection using GRACE, J. Geophys. Res., 103, 30205– 30229, 1998.