www.earth-surf-dynam.net/3/251/2015/ doi:10.5194/esurf-3-251-2015
© Author(s) 2015. CC Attribution 3.0 License.
Decadal-scale soil redistribution along hillslopes in the
Mojave Desert
O. Crouvi1,2, V. O. Polyakov3, J. D. Pelletier2, and C. Rasmussen4 1Geological Survey of Israel, 30 Malkhe Israel St., Jerusalem 95501, Israel 2Department of Geosciences, University of Arizona, Tucson, AZ 85721, USA
3Southwest Watershed Research Center, USDA-ARS, 2000 E. Allen Rd., Tucson, AZ 85719, USA 4Department of Soil, Water, and Environmental Science, University of Arizona, Tucson, AZ 85721, USA
Correspondence to: O. Crouvi ([email protected])
Received: 4 May 2014 – Published in Earth Surf. Dynam. Discuss.: 18 June 2014 Revised: 3 May 2015 – Accepted: 14 May 2015 – Published: 4 June 2015
Abstract. This study estimates the relative magnitude of decadal-scale soil redistribution (i.e., soil loss or gain) by slope wash using137Cs inventories measured in 46 soil profiles at four study sites in the Ft. Irwin area of the Mojave Desert of California, USA. The variability in137Cs inventories on a<5 m scale suggests that even for the same topographic position, there is large variation in runoff generation and flow continuity. Smaller average137Cs inventories that are suggestive of higher relative erosion rates are associated with more gently sloping sites that have a lower percentage of surficial rock-fragment and vegetation coverage. Individual137Cs inventories from all four sites are positively correlated with the percentage of rock fragments in the upper soil profile. The increase in rock-fragment cover (i.e., soil armoring) with increasing slope gradient appears to negate any potential increase in transport effectiveness with increasing slope steepness. This armoring, together with the sandy-loam soil texture characteristic of steeper slopes, hinders runoff and slope-wash erosion. Our findings are supported by soil data that suggest that these patterns are persistent for longer timescales (i.e., centuries and millennia).
1 Introduction
Quantifying soil erosion rates and processes across different types of landscapes is essential to understanding how land-scapes evolve under climatic, tectonic, and anthropogenic forcing. Although soil erosion is a natural process, it has intensified in the last century, mainly due to anthropogenic stressors (Montgomery, 2007). Thus, most efforts to quan-tify soil loss on decadal timescales have been concentrated on agricultural fields, whereas natural, uncultivated regions have been studied less intensively. In addition, soil erosion rates and processes are relatively well known for semiarid to humid regions throughout the world (e.g., Lal, 2001; Near-ing et al., 2005; Verheijen et al., 2009) but have been less well studied in arid environments.
Surface (or slope) wash, induced by overland flow when the rainfall rate exceeds the infiltration capacity, contributes to soil erosion, especially in arid and semiarid regions where
rela-tionship between slope gradient and runoff but found a nega-tive correlation between slope and erosion rates (i.e., steeper slopes yield smaller erosion rates) (Yair and Klein, 1973). This inverse relationship was attributed to a difference in the fraction of the surface covered by rock fragments (herein rep-resented as Rc). Similar findings were reported from semi-arid sites in southeastern Arizona and the Sierra Nevada, California, showing that overland-flow velocities and erosion rates are only partly controlled by slope gradients and, more importantly, are related to differentialRc(Abrahams and Par-sons, 1991; Nearing et al., 1999; Granger et al., 2001; Near-ing et al., 2005), i.e., as Rc increases, the soil erosion rate decreases. Recently, a new compilation of erosion rate data (Cerdan et al., 2010) and a new soil erodibility map (Panagos et al., 2014) have shown the importance of Rc in decreas-ing soil erodibility and erosion rates in Europe, especially in Mediterranean countries. Larger Rc leads to lower ero-sion rates in potentially three ways (Poesen et al., 1994): (1) greater protection against raindrop impact and detachment of soil particles by slope wash, (2) a greater reduction in physi-cal degradation of the underlying soil by hampering soil ag-gregate breakdown, surface sealing, and compaction, and (3) a reduction in flow velocity due to greater hydraulic rough-ness associated with the rock cover.
In contrast to the negative relationship between erosion rate and slope gradient, studies from an arid region in Israel suggest that a positive relationship exists between erosion andRc and show that in areas with more pronounced rock coverage, soil erosion by slope wash increases (Yair and En-zel, 1987; Yair, 1990). Poesen et al. (1994) found that the net effect ofRcon soil erosion by water depends on the temporal and spatial scale considered, in that a negative relationship exists between sediment yield and Rc on the microplot and macroplot scales (4×10⁻⁶–100m2and 101–104m2, respec-tively). However, on the mesoplot scale (10−2–102m2), the relationship betweenRcand sediment yield is more complex, and can be negative or positive depending on the structure of the topsoil and on the vertical position and size of the rock fragments (Poesen et al., 1994). The apparent complexity of the relationship between erosion rates and surface character-istics points to the need for additional data on soil erosion rates across multiple spatial scales in arid environments.
Most of the studies that have demonstrated the importance ofRcfor soil erosion rates were conducted in semiarid to hu-mid regions (i.e., those with a mean annual precipitation of > 250 mm yr−1). In arid regions (< 250 mm yr−1) our infor-mation on processes and rates of soil erosion by water on the hillslope scale is limited (but see Yair and Klein, 1973; Abra-hams et al., 1984; Yair, 1990; Owen et al., 2011). In general, arid regions differ from semiarid regions in how both climatic and surficial properties affect erosion rates. Generally, the de-crease in average annual rainfall across the semiarid to arid transition is accompanied by an even more pronounced de-crease in vegetation coverage and an inde-crease inRc, whereas dust accretion rates are generally high in both regions
(com-pared to more humid climates) but vary locally (Birkeland, 1999; Laity, 2008). Due to these different characteristics, we cannot directly use the findings of prior studies on soil ero-sion rates and processes collected in semiarid to humid re-gions to make inferences about arid rere-gions.
Inventories of the anthropogenic137Cs (t1/2=30.2 years) are widely used as tracers of soil movement in a wide range of environments in different regions of the world (e.g., Walling and He, 1999; Nearing et al., 2005; Kaste et al., 2006; O’Farrell et al., 2007). As the only source for137Cs is nuclear fission (fallout peak in 1963), this fallout nuclide is useful for calculating and tracing soil loss by flowing wa-ter over decadal (∼50-year) timescales. The technique relies on the assumption that137Cs is fixed to clay minerals on de-position, and any redistribution of 137Cs relates to erosion and deposition processes in the landscape. Areas with rela-tively high amounts of137Cs are assumed to be areas of rel-ative sediment accumulation, whereas areas with relrel-atively low amounts of137Cs are assumed to have undergone ero-sion (or less aggradation, if the study area is aggradational). Several models have been developed for relating the vertical distribution of137Cs in soil profiles and the total amounts of 137Cs across the landscape to erosion rates (e.g., Walling and
He, 1999). To successfully relate137Cs profiles and invento-ries to absolute and relative erosion rates several assumptions should be met; the main challenge is finding a non-eroding and non-accumulating reference location to compare to erod-ing or aggraderod-ing sites (Parsons and Foster, 2011; Mabit et al., 2013).
pro-^
_
^
_
^
_
^
_
GM2BRH
EPR3
EPR2
116°30'0"W 116°40'0"W
35
°2
0'
0"
N
35
°1
0'
0"
N
´
0 5
Km
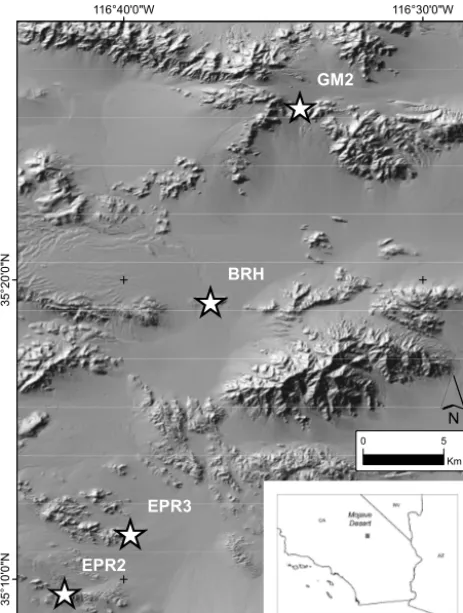
Figure 1.Location map of the four study sites (stars) in the south-ern part of Ft. Irwin, the Mojave Desert, southsouth-ern CA. Topography from the lidar data is presented as shaded relief image.
cesses is likely not accounted for in 137Cs inventories. As such, the decadal-scale137Cs inventories estimated here are mostly due to slope wash.
2 Materials and methods
2.1 Study area
The study area is located in the US Army National Training Center at Ft. Irwin, south-central California, in the western Mojave Desert (Fig. 1). The area is part of the Basin and Range Province, which is characterized by scattered moun-tain ranges rising sharply from wide alluvium-filled basins. Rocks within the study area are variable in lithology and age, but most outcrops are composed of Mesozoic plutonic rocks, which are the focus of this research. The climate of the region is arid, with hot and dry summers and warm and less dry winters. Precipitation is typically scarce and spotty, and varies from 110 to 150 mm yr−1, mostly associated with winter Pacific frontal storms. The annual number of average days of high-intensity precipitation in the Mojave is 2.3 (high intensity is defined as precipitation > 90th percentile of all measurable daily precipitation at a station) (Griffiths et al.,
2006). The major vegetation types in the upland watersheds are the Mojave creosote bush scrub and the blackbrush scrub, which are dominated by creosote bush (Larrea tridentata), white bursage (Ambrosia dumosa), and blackbrush
(Coleog-yne ramosissima) (Fahnestock and Novak-Echenique, 2000).
The soils on upland watersheds are developed in residuum and colluvium from plutonic rocks and are well drained with a coarse sandy-loam to loam texture; they are classified as loamy-skeletal, mixed, superactive, calcareous, thermic Lithic Torriorthents and loamy-skeletal, mixed, mesic Lithic Haplargids (Fahnestock and Novak-Echenique, 2000). The soils exhibit high spatial variability in thickness that ranges from 20 to 150 cm (Crouvi et al., 2013). This variability is ev-ident mostly in moderate to steep slopes (∼> 15◦), in which extreme heterogeneity in soil thickness exists. In the upper and middle parts of these slopes, piles of boulders occur ad-jacent to areas covered with coarse to very coarse gravels (2–5 cm), which in turn cover soil by up to 1 m. The stages of carbonate morphology of the soils vary and range from stage I (undeveloped calcic soil) to stage IV (well-developed calcic soil with an indurated petrocalcic horizon) (Crouvi et al., 2013). The content of aeolian, external sediments in the upland soils is estimated to range from 50 to 100 % of the profiles, considering only the < 2 mm fraction of the soil; When considering the total soil thicknesses, including grav-els (> 2 mm), aeolian materials make up 11 to 33 % of the total soil thickness (Crouvi et al., 2013).
3 Sampling
Table 1.The study sites characteristics.
Site GM2 EPR2 EPR3 BRH
Lithology and geologic Quartz monzonite, Diorite, Granite, Granite,
period∗ Cretaceous Jurassic Cretaceous Jurassic–Cretaceous Average slope (◦), aspect, and 25, NE, 130 16, NW, 130 7, NNE, 65 5, NNW, 125
length (m) of transects 13, SSW, 85 10, SW, 55
Elevation (m) 1260 910 750 780
Average rock cover (Rc) 33±13 27±23 0 0
(>0.5 m) (%) and SD
Average vegetation cover 52±16 39±9 20 10
(%) and SD
∗See Crouvi et al. (2013) for more details.
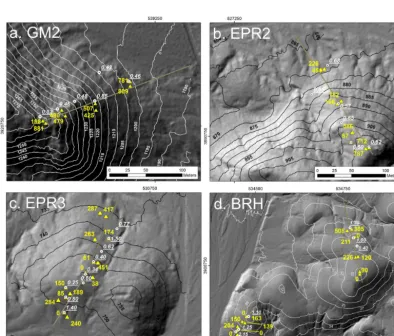
Figure 2.The spatial distribution of total137Cs inventories (Bq m−2) per soil profile for each study site (yellow triangles and numbers):
(a) GM2, (b) EPR2, (c) EPR3, (d) BRH north aspect, (e) BRH southwest aspect. Topographic transects are in yellow lines. Location and
thickness (m) of studied soil pits (dug to bedrock) are represented by white circles and numbers. Topography from the lidar data is presented as contours and as shaded relief images.
of 9 cm. The total number of soil profiles and137Cs samples analyzed in this study is 46 and 138, respectively.
Soil properties, such as total thickness, thickness of A horizon, soluble-salt concentration and depth profile, and the
a. GM2 b. EPR2
c. EPR3 d. BRH north aspect
e. BRH southwest aspect
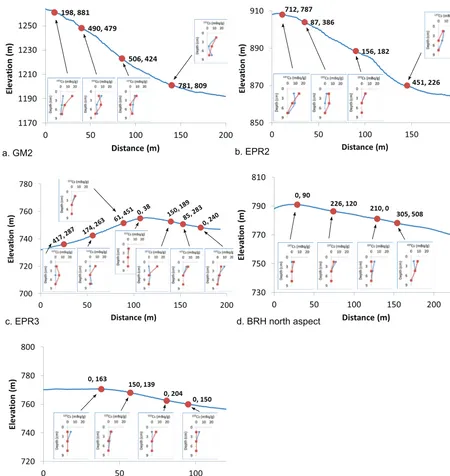
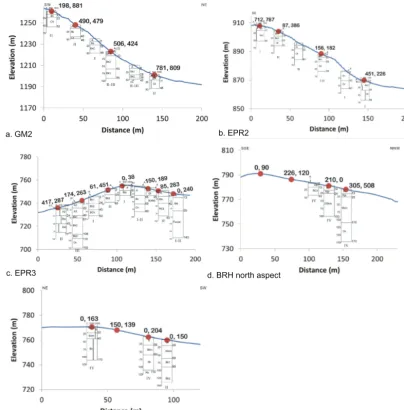
Figure 3.The distribution of total137Cs inventories (Bq m−2) per soil pit along the hillslope for each study site: (a) GM2, (b) EPR2,
(c) EPR3, (d) BRH, north aspect, (e) BRH southwest aspect. Insets show depth profiles in blue and red of137Cs activities (mBq g−1) for the paired soil profiles sampled at each topographic position.
soil pits were dug down to the depth of unweathered bedrock (R horizon) defined as the “depth of refusal”, the point at which soil can no longer be excavated by hand, hydraulic core, or drill (Soil Survey Staff, 1999). The soils were de-scribed and sampled following standard methods (Soil Sur-vey Staff, 1999). At each soil pit location at two of the sites, Rc was estimated by counting the number of rocks > 0.5 m in diameter (both surface clasts and outcrop) in a 1 m inter-val along 50 m transect laid along the topographic contours
carried out using a Beckman Coulter LS 13 320 laser diffrac-tion particle size analyzer, following the procedure described in Crouvi et al. (2013). Organic matter was removed from the soil samples using NaOCl before the PSD analysis. Saturated soil pastes were extracted with the procedure outlined in Soil Survey Laboratory Staff (1999), and EC and pH were deter-mined on saturation extracts immediately after extraction.
4 Analysis of137Cs in soil samples
Soil samples were dried and sieved through a 2 mm screen to break aggregates and homogenize the samples. The con-tent of rock fragments (> 2 mm) by mass (hereinRm) in each soil profile was used as a proxy for the relative Rc ups-lope of the location of the soil profile (Nearing et al., 2005). The samples (< 2 mm) were weighed, placed into 120 mL tin cans in a uniform layer and sealed with an airtight lid. The depth of the samples in the cans was measured in order to calculate sample density. The analysis for 137Cs was per-formed using a gamma ray spectrometry system consisting of two n-type high-purity closed-end coaxial germanium de-tectors (Canberra GC4019), with > 30 % relative efficiency, coupled with an amplifier and a multichannel analyzer (DSA-2000A). The detectors were shielded with a 100 mm thick layer of lead. The system was calibrated using mixed ra-dionuclide reference material IAEA-327 (Dekner, 1996), ob-tained from the International Atomic Energy Agency. The gamma emission spectrum was obtained over a 0–2 MeV range with a resolution of 0.24 keV (8192 channels). Mea-surement and spectrum analysis was conducted using the Genie-2000 Spectroscopy software (Canberra, 2009). The samples were counted for at least 80 000 s. The activity of 137Cs (mBq g−1) was calculated from the 661.6 keV pho-topeak. The analysis included a correction factor for self-attenuation due to the variation in sample volume and den-sity (Quindos et al., 2006). To convert the 137Cs activities (mBq g−1) to137Cs inventories (Bq m−2), we used a uniform bulk density of 1.25±0.16 g cm−3. This value was calcu-lated from the analyses of seven soil samples taken from the B horizon of the studied soils at the study sites (see Crouvi et al., 2013).
5 Estimating the topographical factors at sampling sites
We used a 1 m pixel−1 bare-earth digital elevation model (DEM) derived from airborne lidar to compute slope gradi-ents, curvature values, and contributing areas. Prior to cal-culating these topographic properties using nearest-neighbor pixels, we smoothed the DEM using a moving average with a spatial scale of 5 m in order to partially remove small-scale variability, some of which includes real topographic varia-tions (e.g., small outcrops) and some of which includes the small shrubs that cannot be perfectly differentiated from bare
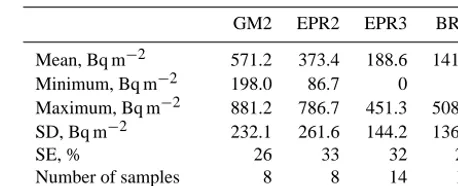
Table 2.The137Cs inventories per soil profile for study sites.
GM2 EPR2 EPR3 BRH
Mean, Bq m−2 571.2 373.4 188.6 141.6
Minimum, Bq m−2 198.0 86.7 0 0
Maximum, Bq m−2 881.2 786.7 451.3 508.2 SD, Bq m−2 232.1 261.6 144.2 136.8
SE, % 26 33 32 27
Number of samples 8 8 14 16
ground. This smoothing procedure greatly reduces the small-scale variability in the DEM without significantly affecting the shape of the landscape on the hillslope scale (Pelletier and Rasmussen, 2009; Pelletier et al., 2011). In the absence of such smoothing, the curvature data especially are entirely dominated by the local microtopography in a way that is un-realistic (i.e., curvature values oscillate wildly between posi-tive and negaposi-tive values independent of topographic position on the hillslope).
For each137Cs sampling location, we extracted the slope gradient and curvature value from the analysis. A positive curvature indicates that the surface is concave in that cell, whereas a negative curvature indicates that the surface is con-vex in that cell. A value of 0 indicates that the surface at the sampling point is locally planar. We calculated the Laplacian curvature using four nearest neighbors (i.e., the curvature in both directions of steepest descent and along-contour) (e.g., Roering et al., 1999). As curvature values calculated from a DEM are known to depend on the grid size (e.g., Heimsath et al., 1999), we examined a 5 m pixel−1curvature map in addition to the 1 m pixel−1 values. According to Heimsath et al. (1999), curvature generally becomes scale independent at grid spacings or on spatial scales larger than 5 m, as most pit-and-mound topography occurs on spatial scales of less than 5 m. We also calculated a topographic proxy for shear stress by overland flow by multiplying the slope gradient by the square root of the contributing area (contributing area was calculated following the multiple-flow-direction algorithm of Freeman, 1991). This combination of slope and contributing area is a reasonable proxy for shear stress by overland flow since it predicts where channels begin, i.e., where incision by overland flow becomes more dominant over diffusive pro-cesses on hillslopes over geologic timescales (Montgomery and Dietrich, 1988).
6 Results
6.1 137Cs inventories
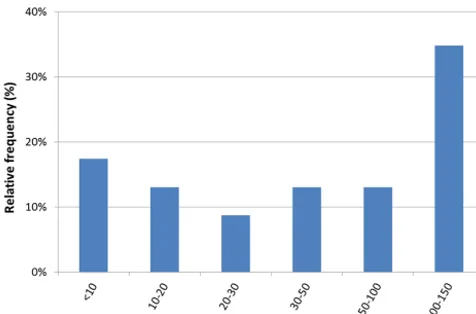
Figure 4.Relative frequency of the difference in standard error of a pair of137Cs inventories measured in the same topographic posi-tion.
In general, site GM2 exhibits the highest mean137Cs in-ventory of all study sites; site EPR2 (diorite) exhibits a lower mean value (Table 2). The two other sites, EPR3 and BRH, exhibit much lower mean values of137Cs inventory, includ-ing soil profiles in which no137Cs was detected. The137Cs depth profiles and total inventories on hillslopes vary within and between study sites (Figs. 2, 3). Differences in 137Cs inventories between sampling pairs (located 1–5 m apart) vary significantly (Fig. 4): whereas half of the pairs shows standard errors less than 50 %, the other half exhibits much higher errors (50–150 %). At site GM2, all soil profile pairs show similar inventories at each topographic position. Most depth profiles exhibit detectable 137Cs even at the shorter sampling interval (6–9 cm) (see insets in Fig. 3a). Some depth profiles are exponential, whereas others decrease from high surficial activities to steady activities at depth. At site EPR2 the two summit soil profiles show similar, high inven-tories; lower inventories are found downslope (Fig. 3b). For half of the soil profiles,137Cs activities were detected only at the uppermost sampling interval (0–3 cm), whereas for the rest, 137Cs activities occur also at a depth of 3–6 cm, with zero to negligible activities at depth of 6–9 cm. Similar to site EPR2, site EPR3 exhibits variability in 137Cs invento-ries in relation to topographic position for part of the profiles (Fig. 3c). Of the 14 profiles studied, 2 revealed no detectable 137Cs activities at all, whereas for seven profiles,137Cs was
detected only at a depth of 0–3 cm. Three profiles revealed detectable137Cs at a depth of 3–6 cm; two profiles exhibited no detectable137Cs at the surface and negligible activities at lower depths, which suggests the loss of the137Cs layer with subsequent deposition or other perturbation. At site BRH the 137Cs inventories vary among topographic positions (Fig. 3d,
e). Depth profiles are different than at the other sites, with overall low inventories found for this site. In 5 profiles out of the 16 studied, no137Cs is detected at all; for seven profiles
Table 3.Content of rock fragments by mass (Rm) (> 2 mm) in the soil profile (0–9 cm) for soils from the study sites.
GM2 EPR2 EPR3 BRH
Mean, % 46.6 26.3 28.5 20.6
Minimum, % 40.3 9.8 16.3 0.9
Maximum, % 55.1 40.7 44.7 38.6
SD, % 5.2 10.2 8.6 10.3
SE, % 9.5 25.1 19.3 26.7
Number of samples 8 8 14 16
137Cs is detected only at the surface. Only in four profiles is 137Cs detected at a depth of 3–6 cm.
7 Effects of topographic factors andRcon soil
redistribution
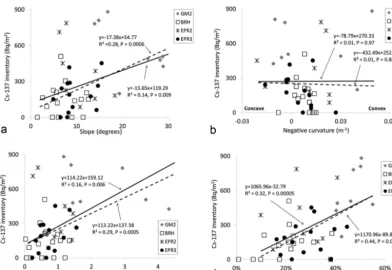
Site GM2 exhibits the steepest topographic slopes at the sam-pling soil pits, ranging from 14 to 29◦; slopes at site EPR2 range from 6 to 18◦, from 5 to 15◦at site EPR3, and from 2 to 12◦at site BRH (Fig. 5a). Average negative curvature is the highest at site GM2 (0.011±0.025 m−1), followed by site EPR2 (0.009±0.018 m−1), site BRH (0.007±0.006 m−1), and site EPR3 (0.005±0.010 m−1) (Fig. 5b). Values of slope×sqrt(contributing area) are mostly < 1.7 m, with a few exceptions at site GM2 (Fig. 5c). Within a given site, we found no significant relationship between137Cs inventories and topographic slope, between137Cs inventories and topo-graphic curvature (both 1 and 5 m), or between137Cs inven-tories and slope×sqrt (contributing area).
Since the number of samples at each study site is rela-tively low (8 to 16), we also examined the potential correla-tions using individual pits from all four study sites together, treating them as one sampling population. In doing so, we found a significant positive relationship between137Cs in-ventories and topographic slope (i.e., steeper slopes cor-related to higher inventories) (n=46; r2=0.14; p<0.01) (Fig. 5a). Moreover, when we perform this regression with-out the data of site EPR2, which is composed of a different (diorite) lithology, the relationship is even stronger (n=38; r2=0.28; p<0.001). Similar positive significant relation-ships were observed between137Cs inventories and slope× sqrt (r2=0.16;p<0.01 for all data;r2=0.29;p<0.001 for all data except for EPR2) (Fig. 5c). On the other hand, re-gressing the topographic curvature data (both 1 and 5 m) with or without the dioritic site against137Cs inventories reveals no significant correlation between these variables (Fig. 5b).
Figure 5.Relationships between total137Cs inventories (Bq m−2) per soil pit and slope (a), curvature (b), slope×sqrt(contributing area)
(c), and rock fragments in soilRm(d). Regressions of all data points appear as a black line; regressions of all data points except from site EPR2 appear as a dashed line. The curvature presented is calculated from 1 m pixel data; similar nonsignificant regressions were observed also for the 5 m pixel curvature data.
we found a significant positive linear relationship (r2=0.32; p<0.0001) (Fig. 5d). As for the slope data, the relationship is even stronger (r2=0.44;p<0.00001) when we do not ac-count for the dioritic site. We should note that we did not ob-serve any clear trend in vegetation coverage along hillslopes within sites.
8 Soil catena characteristics
Site GM2 is characterized by the highest averageRcand veg-etation coverage of all studied sites (33 and 52 %, respec-tively) (Table 1). Most soils have A/Bk/Ck/R or A/Bk/BkC/R profiles; the backslope soil has an A/Bk/R profile. Soil thick-ness is relatively constant (40–50 cm), without a clear downs-lope trend along the 130 m catenary length (Fig. 6a) (the backslope profile is an exception, with 85 cm thick soil). The thickness of the A horizon (and thus the depth to the top of the Bk horizon) is relatively constant and ranges from 7 to 12 cm (except at the backslope profile). The soil texture of the A and Bk horizons changes from sandy loam at the sum-mit to loamy sand at the footslope (Fig. 7). EC values for soil horizons at the summit are between 70 and 100 µS cm−1, whereas at the footslope they are higher and range from 200 to 400 µS cm−1(Fig. 6a). In terms of carbonate morphology, the carbonate stage of the soils is mostly II, with slightly more developed soils (II–III) at the lower part of the slope.
Site EPR2 is characterized by slightly lower averageRc and vegetation coverage than site GM2 (27 and 39%, respec-tively) (Table 1) but has a similar soil profiles. Soil thick-ness slightly increases downslope along the 130 m catenary length from∼50 cm to∼70 cm (Fig. 6b) (see also Crouvi et al., 2013). The A horizon is thin (∼3 cm) and constant in thickness along the transect. The thickness and texture of the Bk horizon change downslope: at the summit the Bk horizon is 14 cm thick and of a loamy-sand to sandy-loam texture, whereas at the footslope it is 31 cm thick and of a sandy-loam texture (Figs. 6b, 8). Similar to the situation at site GM2, the footslope profile horizons accumulated more salts than the summit (25–600 vs. 2–300 µS cm−1, respectively) (Fig. 6b). The soils are relatively cobble- and gravel-poor (10–30 % in the A and B horizons) (Crouvi et al., 2013), are not well de-veloped in terms of carbonate morphology (I–II), and have no clear trend in soil development downslope.
a. GM2 b. EPR2
c. EPR3 d. BRH north aspect
e. BRH southwest aspect
Figure 6.The distribution of total137Cs inventories (Bq m−2) per soil pit along the hillslope for each study site: (a) GM2, (b) EPR2,
(c) EPR3, (d) BRH north aspect, (e) BRH southwest aspect. The distribution of electrical conductivity values (EC) (µS cm−1) with depth is presented for most of the summit and footslope profiles. Note scale difference for EC values at site BRH.
of the Bk horizon also increases from ∼2 cm in the upper parts of the slopes to 40–50 cm at the bottom. The texture of the Btk horizon changes from sandy loam at the summit to clay loam at the base (Fig. 7). Cobble and gravel percent-ages range from 30 to 80 % in the A and B horizons (see also Crouvi et al., 2013). EC values for soil horizons are higher than at previous sites (50–1000 µS cm−1), whereas the summit profile exhibits higher EC values than the footslope (Fig. 6c). The soils show an increasing downslope trend in soil development, mostly with carbonate morphologic stage I in the upper parts of the slope and stages II and III in the lower parts. Most of the soils along the opposite and gently sloping NNE transect have a pronounced Bt horizon. Soil thickness changes from 25 to 80 cm without a clear trend downslope (Fig. 6c); fluvial deposits were observed at the
base of the footslope profile. The depth to the top of the Bk (or Btk) horizon (18–35 cm) and the carbonate morphologic stage (I to II) vary without a clear downslope trend. No PSD data are available for this transect.
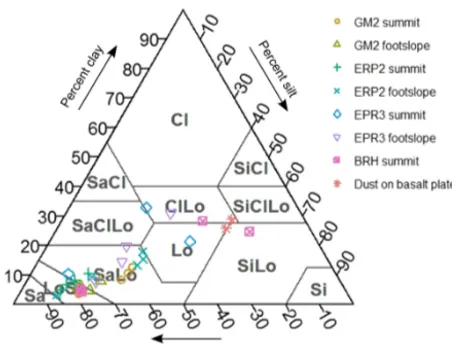
Figure 7. Particle size ternary plots and textural classes for the < 2 mm fraction of A and B horizons of the studied soils. Abbrevi-ations are as follows: Sa – sand; LoSa – loamy sand; SaLo – sandy loam; SaClLo – sandy clay loam; SaCl – sandy clay; Cl – clay; ClLo – clay loam; Lo – loam; SiCl – silty clay; SiClLo – silty clay loam; SiLo – silt loam; Si – silt.
signs of carbonate accumulation. In most soils the A horizons abruptly overlay the hard petrocalcic horizon (Bkm) that rep-resents the greatest degree of carbonate morphology develop-ment found in this study (stages III–IV). At the summit, the soil texture of the A horizon is finer than at the other sites (clay–loam, loam to silt–loam) and resembles the texture of pure aeolian sediments that were sampled on a nearby basalt plateau (Crouvi et al., 2013) (Fig. 7). At this site EC values for the summit profile horizons are the highest measured in this study and range from 1000 to 4000 µS cm−1.
9 Discussion
9.1 Processes that control the spatial patterns of137Cs inventories
The most striking observation is that137Cs inventories vary on all spatial scales: at 1–5 m (in between sampling pairs), at 20–200 m (on hillslopes), and at 5–30 km (between sites). We attribute this variability mainly to sediment transport by slope wash and not to other processes that can potentially transport sediments along hillslopes. Firstly, colluvial ero-sion and the slower downslope movement of soil due to creep and bioturbation are not likely to be captured using 137Cs inventories that represent∼50 years of erosion. This
is strengthened by the fact that we did not find a significant linear relationship between topographic curvature and137Cs inventories, as expected in any case in which soil redistribu-tion is dominated by slope wash (Fig. 5b) (see also Nearing et al., 2005), whereas this relationship is significant when dif-fusive processes dominate (e.g., Heimsath et al., 2005; Roer-ing, 2008; Pelletier and Rasmussen, 2009). Secondly, soil
re-distribution by wind is probably also not an important pro-cess as a) crusted topsoil is evident at all sites, b) upland soils serve as a sink for aeolian sediments (Crouvi et al., 2013), and c) the main sources of eolian sediments in the Mojave Desert are proximal and distal alluvial fans, washes, and playas (and not hillslopes) (e.g., Sweeney et al., 2013). Thirdly, we acknowledge the fact that, as stated above, there is a considerable eolian input to upland soils along the stud-ied hillslopes (Crouvi et al., 2013). Except for unusual cases in which hillslopes are located very close to a localized aeo-lian source, the accumulation rate of dust transported in sus-pension can be and usually is assumed to be uniform unless the hillslope has a strong gradient in vegetation cover (Yan et al., 2011). The slopes we studied have had uniformly sparse vegetation cover (within a given site) since the time 137Cs was deposited, and significant aeolian sources are∼1–10 km from the hillslopes we studied, i.e., much larger than the 20– 200 m scales separating our measurements within each hills-lope. Fourthly, although there is a possibility that soil patches in rocky slopes contain more137Cs due to local wash of137Cs from adjacent outcrops, we think that this process is insignif-icant as the outcrops mostly drain into adjacent crevices. In addition, we sampled the137Cs from a pit that is 10×10 cm in size, and we avoided sampling near large clasts (> 10 cm). We assume that under these circumstances, the addition of wash off from small clasts (< 10 cm) is negligible in relation to a 10×10 cm size sampling area and cannot explain the overall trend in137Cs inventories along hillslopes, and the differences in average inventories between sites.
10 What controls the spatial patterns of137Cs inventories on different spatial scales?
The highly variable soil redistribution patterns are also evident on the 20–200 m scale as there is no clear trend in 137Cs inventories downslope. However, our findings that
in-dividual137Cs inventories from all study sites are positively correlated with Rm implies that as the fraction of the sur-face covered with rock fragments (Rc) increases, soil erosion by water is less effective on average. The positive correla-tion between slope and 137Cs inventories is the opposite of what we expected. We believe this correlation simply repre-sents the fact that steeper slopes generally exhibit higherRm (Pearson’sr=0.57 for all sites and 0.65 for all sites except EPR2; see also Tables 1, 4) (Abrahams et al., 1985; Hirmas et al., 2011). Thus, on steep slopes with abundant surficial rocks soil transport by water is less effective than on gentler slopes with limited abundance of rock fragments (Yair and Klein, 1973; Hirmas et al., 2011). Interestingly, the site with the diorite lithology does not exhibit extreme 137Cs inven-tories; including this site in the analysis only slightly weak-ens the linear relationship between137Cs inventories andRm (Fig. 5d). This suggests that the control ofRcon soil erosion is not limited only to granitic lithology but also relates to less weathering-resistant lithologies.
The positive correlation between slope and Rm has been attributed to past erosion: steeper slopes are believed to have undergone greater erosion in the past that removed fine ma-terial and increased rock cover (Poesen et al., 1998; Govers et al., 2006). Subsequently, an increase in rock cover leads to reduced soil erosion rates, eventually resulting in relatively uniform erosion rates across the hillslope (a state of slope– velocity equilibrium) (e.g., Govers et al., 2006). Thus, the control ofRcon137Cs inventories shown here, together with the apparent independence of direct control of slope gradi-ent over137Cs inventories, are best explained in terms of hy-draulic controls by the rocks and initial conditions of the sites and the associated slope–velocity equilibrium that develops on slopes (Nearing et al., 1999; Nearing et al., 2005). Clearly, the studied landscape did not yet reach a state of slope– velocity equilibrium as137Cs inventories (and hence soil ero-sion rates) vary within and between study sites. One possi-ble reason is that these hillslopes have seen huge changes in the past 20 kyr (and longer) (for example, pinyon and juniper pine trees were abundant at these elevations (800+m) at the Last Glacial Maximum).
Despite the fact that extreme small-scale variability in in-ventories was found that can significantly affect the inven-tories of individual pits, this tends to have less of an ef-fect on the average of 8–16 pits (i.e., per site). Averaging the inventories across study sites reveals that the mean in-ventory is controlled mostly by rock and vegetation cover-age (Tables 1, 2): sites with higherRcand vegetation cover-age exhibit higher137Cs inventories (GM2, EPR2), on aver-age, compared to sites with mostly bare soil (EPR3, BRH). Note that as the mean coverage percentage of rock and veg-etation are positively correlated, we relate the difference in mean 137Cs inventories between sites to the combined
ef-fect of rock and vegetation cover as we cannot differentiate between the two here. However, since we did not observe any downslope change in vegetation cover within sites, veg-etation alone cannot explain the variability in soil erosion rates within sites; thus,our interpretation of the significant relationship between rock fragment content in individual soil profiles vs.137Cs inventories is that these inventories can be explained, at least partly, by rock coverage percentage.
Our interpretation that higherRcand vegetation coverage decreases the magnitude of soil redistribution by slope wash is in agreement with previous studies that were performed in more humid climates (Poesen et al., 1994; Riebe et al., 2000; Cerda, 2001; Granger et al., 2001; Nearing et al., 2005). However, studies from a different arid region (Israel) (Yair and Enzel, 1987; Yair, 1990) found a positive relationship betweenRc and soil erosion by water, the opposite of our findings. The reason for this discrepancy is most likely re-lated to a difference in lithology and subsequently in surficial rock size and position in the soil (see Fig. 7 in Poesen et al., 1994). On the hillslopes studied here 1) most of the plutonic rocks are not well embedded in the soil, creating large spaces in between boulders and crevices, which favors a high infil-tration rate, and 2) the topsoil texture is mostly sandy loam (with 60–75% sand; Fig. 7) which originates from the in situ weathering of the rocks and from aeolian input from sand-rich washes, promoting infiltration and depressing runoff as compared to surfaces with a silt-rich crust (e.g., Kidron et al., 2012). On the other hand, in the Negev Desert the car-bonate bedrock is usually well embedded in the soil, and the soil is composed mostly of pure silt-sized dust particles with a loamy texture.
11 Implications for soil development on arid hillslopes
Our results suggest that the spatial variability137Cs invento-ries that represent decadal-scale soil transport by slope wash are also manifested in the soil catena data. In general, low 137Cs inventories suggest high soil erosion rates, relatively
high runoff, and low infiltration, resulting in less water infil-trating the soil compared with soils located in areas with high 137Cs inventories (i.e., low erosion rates). Limited water
inventories. At the dioritic site (EPR2), soil characteristics do not change dramatically downslope and are in agreement with the relatively uniform137Cs inventories, which are in-termediate in magnitude among the sites. Soils profiles in EPR3 are diverse in terms of profile horizonation, depth to Bk horizon, and thickness. Most profiles lack the C and Bk horizons and exhibit more clay-rich B horizons (Bt) with a relatively high soluble-salt content that directly overlays the unweathered bedrock (R horizon), suggesting limited infil-tration and high erosion rates (low137Cs inventories). On the other hand, few soils exhibit a clear C horizon underlying the Bk horizon. Overall, the soil data suggest high and var-ied erosion rates along the hillslopes, with different amounts of water infiltrating the soils, in agreement with the 137Cs results. At site BRH, most profiles present buried soil with well-developed calcic and petrocalcic horizons (Bkm hori-zon; carbonate stages II–IV) (see also Crouvi et al., 2013). These profiles are abruptly overlain by a soil profile com-posed mostly of a 15–30 cm thick A horizon. The lack of recent accumulation of pedogenic carbonate at the upper 30 cm of the soils (as opposed to what was found in the other studied sites), together with the high content of soluble salts, suggests that a limited amount of water infiltrated the soil. Thus, soil data suggest high runoff coefficients and erosion rates, as found using the137Cs inventories. In addition, this site exhibits a loamy texture for the A and A/B horizons, which promotes runoff and erosion. Thus, the good agree-ment between the observed patterns of137Cs inventories and the soil data suggests that these decadal-scale patterns prob-ably represent century to millennial scales.
12 Conclusions
The results of this study show that in the Ft. Irwin area of the Mojave Desert, the relative magnitudes of soil redistribution by slope wash along hillslopes are mainly controlled by surfi-cial rock coverage, similar to findings from semiarid regions (e.g., the Sonoran Desert). Steep slopes are characterized by higher rock and vegetation coverage and exhibit lower soil loss rates compared to gentle slopes that are characterized by mostly bare soil. As the slopes get rockier as they get steeper, the magnitude of soil loss increases, despite the tendency to-wards greater transport effectiveness on steeper slopes. The abundance on steep slopes of large plutonic rock fragments that are not well embedded in the soil creates large spaces in between boulders and cracks that favors a high infiltration rate. This, together with the sandy-loam topsoil texture, hin-ders runoff and erosion.
The Supplement related to this article is available online at doi:10.5194/esurf-3-251-2015-supplement.
Acknowledgements. We thank Ruth Sparks and Dave Housman from ITAM, Ft. Irwin, for helping with the logistics and permits for the field trips. We thank Mercer Meding, Justine Peal Mayo, Natalie Lucas, Chris Clingensmith, and Stephanie Castro for helping with the laboratory analyses. We wish to thank Aaron Yair from the Hebrew University for reviewing an early draft of this manuscript. We also thank associate editor Gerard Govers and two anonymous reviewers for their comprehensive comments that helped to improve the manuscript. This study was funded by the Terrestrial Sciences Program of the Army Research Office under grant number 55104-EV and was supported by NSF EAR/IF #0929850.
Edited by: G. Govers
References
Abrahams, A. D. and Parsons, A. J.: Relation between sediment yield and gradient on debris-covered hillslopes, Walnut Gulch, Arizona, Geol. Soc. Am. Bull., 103, 1109–1113, 1991.
Abrahams, A. D., Parsons, A. J., Cooke, R. U., and Reeves, R. W.: Stone movement on hillslopes in the Mojave Desert, California: a 16 year record, Earth Surf. Proc. Land., 9, 365–370, 1984. Abrahams, A. D., Parsons, A. J., and Hirsh, P. J.: Hillslope
gradient-particle size relations: evidence for the formation of debris slopes by hydraulic processes in the Mojave Desert, J. Geol., 93, 347– 357, 1985.
Birkeland, P. W.: Soils and Geomorphology, Oxford University Press, New York, 430 pp., 1999.
Bowers, J. E., Webb, R. H., and Rondeau, R. J.: Longevity, recruit-ment and mortality of desert plants in Grand Canyon, Arizona, USA, J. Veg. Sci., 6, 551–564, doi:10.2307/3236354, 1995. Cerda, A.: Effects of rock fragment cover on soil infiltration,
inter-rill runoff and erosion, Eur. J. Soil Sci., 52, 59–68, 2001. Cerdan, O., Govers, G., Le Bissonnais, Y., Van Oost, K.,
Poe-sen, J., Saby, N., Gobin, A., Vacca, A., Quinton, J., Auerswald, K., Klik, A., Kwaad, F. J. P. M., Raclot, D., Ionita, I., Re-jman, J., Rousseva, S., Muxart, T., Roxo, M. J., and Dostal, T.: Rates and spatial variations of soil erosion in Europe: A study based on erosion plot data, Geomorphology, 122, 167–177, doi:10.1016/j.geomorph.2010.06.011, 2010.
Crouvi, O., Pelletier, J. D., and Rasmussen, C.: Predicting the thick-ness and aeolian fraction of soils in upland watersheds of the Mojave Desert, Geoderma, 195–196C, 94–110, 2013.
Dekner, R.: Intercomparison Run IAEA-326 and IAEA-327 Ra-dionuclides in Soil, Analytical Quality Control Services, Vienna, Austria, 1996.
Dietrich, W. E. and Perron, T.: The search for a topographic signa-ture of life, Nasigna-ture, 439, 411–418, 2006.
Dietrich, W. E., Bellugi, D. G., Sklar, L. S., Stock, J. D., Heimsath, A. M., and Roering, J. J.: Geomorphic transport laws for predict-ing landscape form and dynamics, Pred. Geomorphol., 103–132, 2003.
Fahnestock, P. B. and Novak-Echenique, P.: Soil Survey of Na-tional Training Center, Fort Irwin, California, USDA, NRCS, 730, 2000.
Govers, G., Van Oost, K., and Poesen, J.: Responses of a semi-arid landscape to human disturbance: A simulation study of the in-teraction between rock fragment cover, soil erosion and land use change, Geoderma, 133, 19–31, 2006.
Granger, D. E., Riebe, C. S., Kirchner, J. W., and Finkel, R.: Modu-lation of erosion on steep granitic slopes by boulder armoring, as revealed by cosmogenic 26Al and 10Be, Earth Planet. Sc. Lett., 186, 269–281, 2001.
Griffiths, P. G., Hereford, R., and Webb, R. H.: Sediment yield and runoff frequency of small drainage basins in the Mojave Desert, USA, Geomorphology, 74, 232–244, 2006.
Heimsath, A., Dietrich, W., Nishiizumi, K., and Finkel, R. C.: Cos-mogenic nuclides, topography, and the spatial variation of soil depth, Geomorphology, 27, 151–172, 1999.
Heimsath, A., Furbish, D. J., and Dietrich, W.: The illusion of diffu-sion: field evidence for depth-dependent sediment transport, Ge-ology, 33, 949–952, 2005.
Hirmas, D. R., Graham, R. C., and Kendrick, K. J.: Soil-geomorphic significance of land surface characteristics in an arid mountain range, Mojave Desert, USA, Catena, 87, 408–420, 2011. Kaste, J. M., Heimsath, A., and Hohmann, M.: Quantifying
sed-iment transport across an undisturbed prairie landscape using cesium-137 and high resolution topography, Geomorphology, 76, 430–440, 2006.
Kidron, G. J., Monger, C. H., Vonshak, A., and Conrod, W.: Con-trasting effects of microbiotic crusts on runoff in desert surfaces, Geomorphology, 139–140, 484–494, 2012.
Laity, J. J.: Deserts and Desert Environments, Wiley-Blackwell, 2008.
Lal, R.: Soil degradation by erosion, Land Degrad. Dev., 12, 519– 539, 2001.
Lavee, H. and Yair, A.: Spatial variability of overland flow in a small arid basin, Erosion, Transport and Deposition Processes, Jerusalem, Israel, 105–120, 1990.
Mabit, L., Meusburger, K., Fulajtar, E., and Alewell, C.: The use-fulness of137Cs as a tracer for soil erosion assessment: a critical reply to Parsons and Foster (2011), Earth-Sci. Rev., 127, 300– 307, 2013.
Montgomery, D. R.: Soil erosion and agricultural sustainability, P. Natl. Acad. Sci., 104, 13268–13272, 2007.
Montgomery, D. R. and Dietrich, W. E.: Where do channels begin?, Nature, 336, 232–234, 1988.
Nearing, M. A., Simanton, J. R., Norton, L. D., Bulygin, S. J., and Stone, J.: Soil erosion by surface water flow on a stony, semiarid hillslope, Earth Surf. Proc. Land., 24, 677–686, 1999.
Nearing, M. A., Kimoto, A., Nichols, M. H., and Ritchie, J. C.: Spatial patterns of soil erosion and deposition in two small, semiarid watersheds, J. Geophys. Res., 110, F04020, doi:10.1029/2005JF000290, 2005.
O’Farrell, C. R., Heimsath, A., and Kaste, J. M.: Quantifying hill-slope erosion rates and processes for a coastal California land-scape over varying timescales, Earth Surf. Proc. Land., 32, 544– 560, 2007.
Owen, J., Amundson, R., Dietrich, W., Nishiizumi, K., Sutter, B., and Chong, G.: The sensitivity of hillslope bedrock erosion to precipitation, Earth Surf. Proc. Land., 36, 117–135, 2011. Panagos, P., Meusburger, K., Ballabio, C., Borrelli, P., and
Alewell, C.: Soil erodibility in Europe: A high-resolution
dataset based on LUCAS, Sci. Tot. Environ., 479–480, 189–200, doi:10.1016/j.scitotenv.2014.02.010, 2014.
Parsons, A. J. and Foster, R. C.: What can we learn about soil erosion from the use of 137Cs?, Earth-Sci. Rev., 108, 101–113, 2011.
Pelletier, J. D. and Rasmussen, C.: Geomorphically based predictive mapping of soil thickness in upland watersheds, Water Resour. Res., 45, W09417, doi:10.1029/2008WR007319, 2009. Pelletier, J. D., McGuire, L. A., Ash, J. L., Engelder, T. M.,
Hill, L. E., Leroy, K. W., Orem, C. A., Rosenthal, S. W., Trees, M. A., Rasmussen, C., and Chorover, J.: Calibration and testing of upland hillslope evolution models in a dated land-scape: Banco Bonito, New Mexico, USA, J. Geophys. Res., 116, F04004, doi:10.1029/2011JF001976, 2011.
Poesen, J. W., Torri, D., and Bunte, K.: Effects of rock fragments on soil erosion by water at different spatial scales: a review, Catena, 23, 141–166, 1994.
Poesen, J. W., van Wesemael, B., Bunte, K., and Benet, A. S.: Vari-ation of rock fragment cover and size along semiarid hillslopes: a case-study from southeast Spain, Geomorphology, 23, 323–335, doi:10.1016/S0169-555X(98)00013-0, 1998.
Quindos, L. S., Sainz, C., Fuente, I., Nicolas, J., Quindos, L., and Arteche, J.: Correction by self-attenuation in gamma-ray spec-trometry for environmental samples, J. Radioanal. Nucl. Ch., 270, 339–343, 2006.
Renard, K. G. and Freimund, J. R.: Using monthly precipitation data to estimate the R-factor in the revised USLE, J. Hydrol., 157, 287–306, 1994.
Riebe, C. S., Kirchner, J. W., Granger, D. E., and Finkel, R. C.: Erosional equilibrium and disequilibrium in the Sierra Nevada, inferred from cosmogenic (super 26) Al and (super 10) Be in alluvial sediment, Geology, 28, 803–806, 2000.
Roering, J. J.: How well can hillslope evolution models “explain” topography? Simulating soil transport and production with high-resolution topographic data, Geological Society of America Bul-letin, 120, 1248-1262, 2008.
Roering, J. J., Kirchner, J. W., and Dietrich, W.: Evidence for non-linear, diffusive sediment transport on hillslopes and implications for landscape morphology, Water Resources Research, 35, 853-870, 1999.
Soil Survey Staff: Soil Taxonomy: a Basic System of Soil Classi-fication for Making and Interpreting Soil Surveys, USDA Natu-ral Resource Conservation Service Agriculture, US Government Printing Office, Washington DC, 1999.
Sweeney, M. R., McDonald, E., and Markley, C. E.: Alluvial sed-iment or playas: What is the dominant source of sand and silt in desert soil vesicular A horizons, southwest USA, J. Geophys. Res., 118, 257–275, doi:10.1002/jgrf.20030, 2013.
Verheijen, F. G. A., Jones, R. J. A., Rickson, R. J., and Smith, C. J.: Tolerable vs. actual soil erosion rates in Europe, Earth-Sci. Rev., 94, 23–38, 2009.
Walling, D. E. and He, Q.: Improved models for estimating soil ero-sion rates from cesium-137 measurements, J. Environ. Qual., 28, 611–622, 1999.
Yair, A.: The role of topography and surface cover upon soil forma-tion along hillslopes in arid climates, Geomorphology, 3, 287– 299, 1990.
Yair, A. and Klein, M.: The infuence of surface properties on flow and erosion processes on debris covered slopes in an arid area, Catena, 1, 1–14, 1973.
Yair, A. and Lavee, H.: Runoff generative process and runoff yield from arid talus mantled slopes, Earth Surf. Proc., 1, 235–247, 1976.
Yair, A. and Enzel, Y.: The relationship between annual rainfall and sediment yield in arid and semi-arid areas; the case of the north-ern Negev, Catena, 10, 121–135, 1987.
Yair, A. and Kossovsky, A.: Climate and surface properties; hydro-logical response of small arid and semi-arid watersheds, Geo-morphology, 42, 43–57, 2002.