www.clim-past.net/11/509/2015/ doi:10.5194/cp-11-509-2015
© Author(s) 2015. CC Attribution 3.0 License.
A high-resolution
δ
18
O record and Mediterranean
climate variability
C. Taricco1,2, G. Vivaldo3, S. Alessio1,2, S. Rubinetti1, and S. Mancuso2 1Dipartimento di Fisica dell’Università di Torino, Turin, Italy
2Osservatorio Astrofisico di Torino (INAF), Pino Torinese, Italy 3IMT Institute for Advanced Studies, Lucca, Italy
Correspondence to: C. Taricco (carla.taricco@unito.it)
Received: 1 July 2014 – Published in Clim. Past Discuss.: 16 October 2014
Revised: 27 January 2015 – Accepted: 13 February 2015 – Published: 24 March 2015
Abstract. A high-resolution, well-dated foraminiferalδ18O record from a shallow-water core drilled from the Gallipoli Terrace in the Gulf of Taranto (Ionian Sea), previously mea-sured over the last two millennia, has been extended to cover 707 BC–AD 1979. Spectral analysis of this series, performed using singular-spectrum analysis (SSA) and other classi-cal and advanced methods, strengthens the results obtained analysing the shorterδ18O profile, detecting the same highly significant oscillations of about 600, 380, 170, 130 and 11 years, respectively explaining about 12, 7, 5, 2 and 2 % of the time series total variance, plus a millennial trend (18 % of the variance). The comparison with the results of multi-channel singular-spectrum analysis (MSSA) applied to a data set of 26 Northern Hemisphere (NH) temperature-proxy records shows that NH temperature anomalies share with our local record a long-term trend and a bicentennial (170-year period) cycle. These two variability modes, previously identified as temperature-driven, are the most powerful modes in the NH temperature data set. Both the long-term trends and the bi-centennial oscillations, when reconstructed locally and hemi-spherically, show coherent phases. Furthermore, the corre-sponding local and hemispheric amplitudes are comparable if changes in the precipitation–evaporation balance of the Io-nian sea, presumably associated with temperature changes, are taken into account.
1 Introduction
The key to gaining information on climate analogues and periodicities, on decadal to multi-centennial and millennial timescales, is the measurement of proxy records over recent millennia, with multi-annual resolution and matching accu-racy in dating.
Among the different timescales of natural climatic vari-ability, the centennial scale is particularly interesting, being comparable to the scale of human life and to the modern variation related to anthropogenic forcing (Jones and Briffa, 1996; Jones et al., 1999, 2012).
multi-proxy weighting and multi-proxy calibration. These factors may lead to non-robust reconstructions (Lehner et al., 2012).
Marine cores with very high sedimentation rates allow for investigation of climate variations on scales of decades to millennia. In order to avoid possible artefacts produced by the composition of different proxies, we measured the oxy-gen isotopic ratioδ18O in the shells of the surface-dwelling planktonic foraminifera Globigerinoides ruber in a high-resolution, well-dated central Mediterranean core. The iso-topic composition of the shell, deposited on the sea bottom after the death of the organism, reflects the chemical and physical properties of marine surface waters, and therefore can give information about the environmental conditions in which the shell grew.
In a previous paper (Taricco et al., 2009) we presented a 2200-year-long foraminiferal δ18O series and detected sig-nificant modes of variability from decadal to multicenten-nial scales, using singular-spectrum analysis (SSA) and other spectral methods. The isotopic profile showed features re-lated to particular climatic periods, such as the lowδ18O val-ues around AD 1000 (corresponding to the Medieval Warm Period – MWP), the highδ18O values during the 18th cen-tury (corresponding to the Little Ice Age – LIA), the sudden decrease in δ18O values starting from the 19th century (re-lated to the temperature increase during the industrial era, and the high δ18O values at the beginning of the Common Era, suggesting a local decrease in temperature.
The record has now been extended to cover the last 2700 years. The aim of the present work is to investigate the spectral features of the prolonged series in order to detect the modes describing the climate variability over the interval 707–200 BC, in comparison with the following two millen-nia. Moreover, the results of a recent study by our group con-cerning Northern Hemisphere (NH) temperature and based on a reliable and extended data set (Taricco et al., 2014) al-low for the local variability in the central Mediterranean to be compared with that characterizing NH.
2 Experimental procedure
Since the 1990s, the Torino cosmogeophysics group has been studying shallow-water Ionian Sea sediment cores, drilled from the Gallipoli Terrace in the Gulf of Taranto, and has car-ried out their absolute dating. The Gallipoli Terrace is a par-ticularly favourable site for high-resolution climatic studies, due to a high sedimentation rate and to the possibility of ac-curate dating, offered by the presence along the cores of vol-canic markers related to eruptive events that occurred in the Campanian area, a region for which documentation of the major eruptions is available. Historical documents are quite detailed for the last 350 years (a complete catalogue of erup-tive events, starting from 1638, is given by Arnó et al., 1987), while they are rather sparse before that date.
The markers of the eruptions were identified along the cores as peaks of the number density of clinopyroxene crys-tals, carried by the prevailing westerly winds from the vol-cano to the Ionian Sea, and deposited there as part of marine sediments. The time–depth relation for the cores retrieved from the Gallipoli Terrace (Bonino et al., 1993; Cini Castag-noli et al., 1990, 1992, 1999, 2002a; Vivaldo et al., 2009) was obtained by tephroanalysis, which confirmed, improved and extended, to the deeper part of the core, the dating obtained in the upper 20 cm by the radiometric210Pb method (Krish-naswamy et al., 1971; Bonino et al., 1993). Taricco et al. (2008) further confirmed this dating by applying advanced statistical procedures (Guo et al., 1999; Naveau et al., 2003). The cores were sampled every 2.5 mm, and the number density of clinopyroxenes of clear volcanic origin, charac-terized by skeletal morphology and sector zoning, was de-termined for the last two millennia. Twenty-two sharp py-roxene peaks, corresponding to historical eruptions of the Campanian area, starting from the Pompeii event in AD 79 and ending with the last Vesuvius eruption in AD 1944, were found. The depth h in centimetres at which a vol-canic peak is found turned out to be related to the histor-ical date of the corresponding eruption, expressed in years counted backward from AD 1979 (hence years before top, yBT) byh=(0.0645±0.0002)yBT, with a very high corre-lation coefficient (r=0.99). The linearity of this relation-ship demonstrates that the sedimentation rate has remained constant over the last two millennia to a very good approxi-mation. Moreover, the measurements performed in different cores retrieved from the same area showed that this rate is also uniform across the whole Gallipoli Terrace (Cini Castag-noli et al., 1990, 1992, 2002a, b). The very sharp pyroxene peaks indicate that bioturbation by bottom-dwelling organ-isms is quite limited; thus we were able to conclude that the climatic information obtained from these cores is not signif-icantly affected by sediment mixing.
The series presented here was measured in the GT90/3 core (39◦4505300N, 17◦5303300E). In order to obtain theδ18O value of each sample, we soaked 5 g of sediment in 5 % calgon solution overnight, then treated it in 10 % H2O2 to remove any residual organic material, and subsequently washed it with a distilled-water jet through a sieve with a 150 µm mesh. The fraction>150 µm was kept and oven-dried at 50◦C. The planktonic foraminifera Globigerinoides
ruber were picked out of the samples under the microscope.
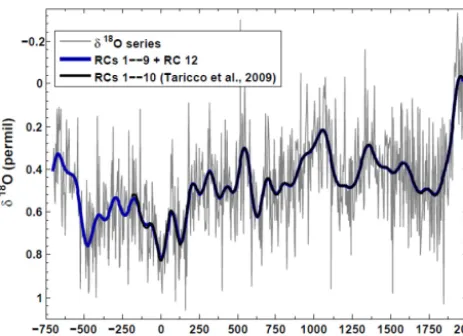
Figure 1.δ18O profile (707 BC–AD 1979) measured in the Ionian GT90/3 core (grey line). In order to agree in tendency with tem-peratures, the isotopic ratio is plotted “upside down”. The sampling
interval is1t=3.87 y, the raw data mean isxm=0.47 ‰ and their
standard deviation isσ=0.23 ‰.δ18O signal reconstruction
ob-tained by summing up its first 12 significant components extracted by SSA (blue line). The signal reconstruction obtained from the
SSA analysis of the shorter, previously publishedδ18O time series
(Taricco et al., 2009) is shown as a black line. Except for a negligi-ble border effect, the agreement between the two smooth curves is
excellent over their common section (r=0.99).
VPDB scale was done using NBS19 and NBS18 carbonate standards.
3 Results and discussion
In a previous paper (Taricco et al., 2009) we presented the δ18O measurements performed in the upper 173 cm of the GT90/3 core (560 samples). The δ18O series has now been extended, obtaining a continuous record of 694 points cover-ing the last 2700 years (707 BC–AD 1979), shown in Fig. 1 (grey line). The high sampling rate (1t=3.87 years) makes this palaeoclimatic record suitable for the study of both long-and short-term variability components.
In Fig. 1,δ18O is plotted “upside down” in order to agree in tendency with temperature. Since δ18O reflects changes both in sea surface temperature (SST) and sea water iso-topic composition, it is necessary to reliably extract indepen-dent components of variability and iindepen-dentify the temperature-driven ones.
Thus, several classical and advanced spectral methods were applied to theδ18O time series, such as classical Fourier analysis, the maximum entropy method (MEM), singular-spectrum analysis (SSA) and the multi-taper method (MTM). Two review papers (Ghil and Taricco, 1997; Ghil et al., 2002) and references therein cover these methodologies. The appli-cation of more than one spectral method ensures that reliable information is extracted from theδ18O record, in spite of its
low signal-to-noise ratio. Here we focus on the SSA results that were obtained using an embedding dimensionM=150, equivalent to a time windowM1t≈600 years, but we will also show that these results are stable to varying M over a wide range of values. We refer the interested reader to the Appendix for technical details on both SSA and Monte Carlo SSA (MC-SSA).
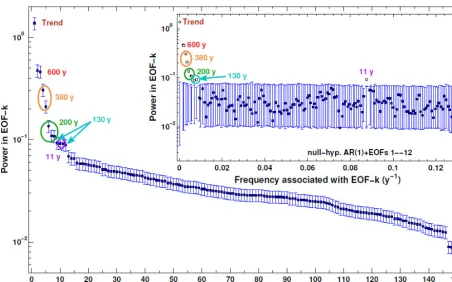
The SSA spectrum is shown in the main panel of Fig. 2, where the 150 eigenvalues are plotted in decreasing order of power.
At a first glance, we can notice a break between the ini-tial steep slope (first 12 eigenvalues) and an almost flat floor. However, to reliably extract signal from noise, an MC-SSA test (MC-SSA; Allen and Robertson, 1996; Allen and Smith, 1996) was applied, showing that the first 12 eigenvalues are statistically significant at the 99 % confidence level (c.l.) and explain about 46 % of theδ18O total variance.
The inset in Fig. 2 shows the results of the MC-SSA test. The error bars bracket 99 % of the eigenvalues obtained by the SSA of 5000 surrogate series, all of them generated by a null-hypothesis model that superposes empirical orthogo-nal functions (EOFs) 1–12 onto a red-noise process, i.e. an auto-regressive process of order 1, or AR(1). We can no-tice that only the eigenvalues associated with EOFs 1–12, the ones included in the null hypothesis and represented by empty squares, lie outside the 99 % error bars. This confirms that the model AR(1) + EOFs 1–12 captures theδ18O vari-ability at the 99 % c.l.; we drew this conclusion after reject-ing, at the same confidence level, several null hypotheses, in-cluding different combinations of EOFs. Moreover, we chose red noise to accommodate the usual background assumption in geophysical applications, where the intrinsic inertia of the system leads to greater power at lower frequencies.
Figure 2. Eigenvalue spectrum from the SSA of theδ18O record (window lengthM=150). Each eigenvalue describes the fraction of total variance in the direction specified by the corresponding eigenvector (empirical orthogonal function – EOF). Inset: Monte Carlo SSA test using EOFs 1–12+AR(1) as the null-hypothesis model. The Monte Carlo ensemble size is 5000. The empty squares highlight the eigenvalues corresponding to the EOFs included in the null hypothesis, while the blue squares represent the eigenvalues corresponding to the remaining EOFs. No excursions occur outside the 99 % limits, indicating that the series is well explained by this model.
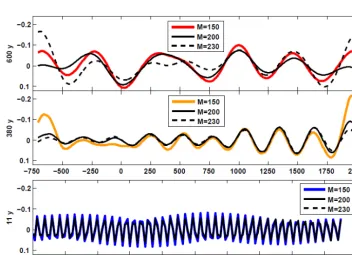
Thus, the SSA analysis of the longer δ18O time series strengthens the results presented in our previous paper (Tar-icco et al., 2009), both detecting the same significant oscil-lations and, as a consequence, leading to the same signal re-construction. In order to test the robustness of these results, we repeated the analysis, lettingM vary over a wide range of values (100–250). Figure 4 shows the reconstructions of the 600-, 380- and 11-year oscillations for three values ofM (150, 200 and 230). We notice that there is good agreement between the reconstructions corresponding to different val-ues ofM, so that the robustness of our analysis with respect to changes of the window is ensured.
The long-term variability features characterizing theδ18O time series are captured by the trend (upper panel of Fig. 3), showing the pronounced maximum near AD 0, the minimum during the MWP (AD 900–1100) and the increase from the MWP toward the LIA. The 170-year oscillation, shown in the same figure, exhibits relative maxima around AD 1500, 1700 and 1900, possibly associated with the Spörer (AD 1460– 1550), Maunder (AD 1645–1715) and modern minima of so-lar activity.
In order to compare the variability detected in the δ18O profile with that characterizing Northern Hemisphere (NH) temperature, we constructed and analysed a data set of
26 temperature-proxy records, extending back at least to AD 1000 and having decadal or better resolution (Taricco et al., 2014). In order to ensure careful temperature calibra-tion of the proxy data (Tingley et al., 2012), our data set con-tains only series satisfying the requirement that the tempera-ture calibration of each proxy record be provided by the au-thors who published the record itself. The properties of the 26 records are listed in Table 1.
This data set was analysed using multi-channel singular-spectrum analysis (MSSA; see Keppenne and Ghil, 1993; Plaut and Vautard, 1994), a multivariate extension of SSA, with each channel corresponding to one of the time series of interest.
Application of SSA requires uniformly spaced time series; therefore, all the time series were interpolated to a common annual resolution. We then applied MSSA over the largest-possible common interval, spanning AD 1000 to 1935 (936 years;N=936). We used a window length of 300 years, i.e. M=300≤N/3.
−0.1
0
0.1
Time AD (years)
RC 1 Trend
−0.1
0 0.1
RC 2−3
600 y
−0.2 −0.1 0 0.1
RC 4−5
380 y
−0.1 −0.05 0 0.05
RCs 6−7−8
170 y
−750 −500 −250 0 250 500 750 1000 1250 1500 1750 2000 −0.05
0
0.05
RCs 9−12
130 y
1500 1550 1600 1650 1700 1750 1800 1850 1900 1950 2000 −0.1
−0.05 0 0.05 0.1
Year AD
RCs 10−11 11 y
Figure 3. Significant components extracted by SSA from theδ18O record: RC1 (trend), RC 2–3 (600 years), RC 4–5 (380 years), RCs 6–8 (170 years), RCs 9-12 (130 years) and RCs 10–11 (11 years). The black curves represent the reconstructions of the same oscillations provided
by the analysis of the shorter, previously publishedδ18O time series (Taricco et al., 2009).
8 (170 years), 9–10 (110 years), 12–13 (80 years), 16–17 (45 years) and 18–19 (60 years) (Taricco et al., 2014).
In our previous paper (Taricco et al., 2009), thanks to an alkenone-derived SST time series measured in cores ex-tracted from the Gallipoli Terrace (Versteegh et al., 2007), we suggested that the long-term trend and the 200-year os-cillation in theδ18O record are temperature-driven. Here we notice that these two components dominate the spectrum of the NH temperature data set, which not only confirms that they are temperature-related but also that they characterize the dominant variability of the whole NH. These two modes also give the most important contributions to the net modern NH temperature rise (Taricco et al., 2014).
A centennial-scale periodicity is also in common between our local proxy record and NH temperature anomalies. How-ever, spectral analysis of the 700-year-long local alkenone-based temperature record does not detect a centennial com-ponent (figure not shown) and therefore we can deduce that this climatic variability mode is not present locally. Its pres-ence in theδ18O record should thus derive from changes in the isotopic composition of sea water.
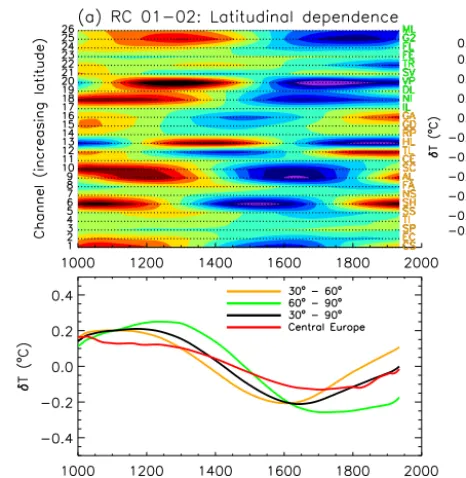
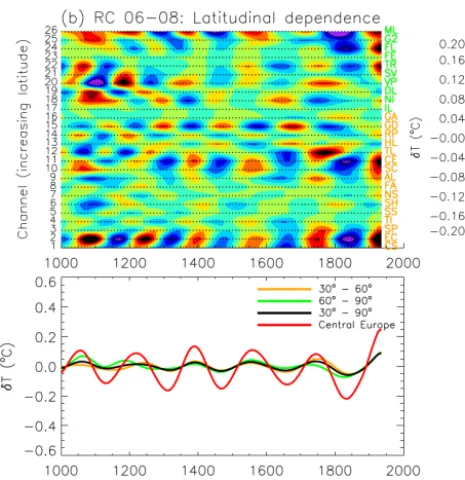
Focusing on the two dominant modes of NH temperature, in Figs. 5 and 6 we show their time behaviour reconstructed at each site, plotted in the upper panels of the figures in or-der of increasing latitude. In the lower panels we show the corresponding RC pairs averaged over two different latitude bands (30–60 and 60–90◦N), as well as over the whole NH. The trend (RCs 1–2) marks the MWP and the LIA cli-matic features and is present in both latitude belts. The cooler temperatures associated with the LIA appear first in mid-latitudes and propagate on to higher mid-latitudes. The bicenten-nial oscillation (RCs 6–8; 170-year period), when averaged over the two different latitude belts, exhibits comparable am-plitudes and a good phase agreement, as shown especially by the lower panel of Fig. 6.
Figure 7a compares theδ18O and NH temperature trends. The two oscillations are in fair phase agreement: they ex-hibit nearly contemporary MWP features, while the LIA tem-perature minimum (δ18O maximum) seems to have occurred slightly later at Gallipoli in respect to the whole NH. The av-erage NH temperature decrease between the MWP and the LIA is of about 0.4◦C (black curve; also visible in the lower panel of Fig. 5). At mid-latitudes (30–60◦N; orange curve in the lower panel of Fig. 5), the MWP–LIA temperature differ-ence appears to be of the same order.
The individual series of the NH data set show, however, a certain difference in trend amplitudes (see the upper panel of Fig. 5). If we focus on the central Europe record (Bünt-gen et al., 2011), which is representative of a relatively large European area extending latitudinally from the Alps to northern Germany, we find a MWP–LIA decrease of the order of 0.3◦C. The alkenone-derived SST measurements from the Gallipoli Terrace (Versteegh et al., 2007), cover-ing AD 1306–1979, show a local temperature decrease from
∼1300 to∼AD 1700 of about 0.5◦C, in agreement with NH
Figure 5. Reconstructed components RCs 1–2 of the NH
temper-ature data set, representing the long-term trend; colour bar is for
amplitude from−0.60 to 0.60◦C. Upper panel: RC pair of
temper-ature anomalies from MSSA analysis as a function of increasing latitude; lower panel: the same RC pair averaged over two latitude
bands, namely 30–60◦N (orange) and 60–90◦N (green), as well as
over the entire NH (black). The red curve represents the trend of the central Europe series.
temperature, as may be expected for a long-term, global vari-ation.
On the other hand, the MWP–LIA increase in the trend component of δ18O (Fig. 7a, dark-red curve) is about 0.025 ‰: according to the Shackleton equation (Shackleton and Kennet, 1975), assuming a nearly constant oxygen iso-topic ratio of sea water during the considered time interval, this variation would correspond to a cooling of∼0.1◦C only. Thus at the Ionian Sea scale,δ18O indicates a MWP–LIA temperature difference that is smaller than that found locally in the alkenone series, as well as hemispherically in the NH data set. This could be due to a contemporary change in the hydrological balance of the Ionian basin: a decrease in evapo-ration, accompanying the temperature decrease, would imply a reduction of theδ18O of sea water and therefore a salin-ity increase (Pierre, 1999). Therefore the Ionian temperature MWP–LIA decrease, calculated from the Shackleton equa-tion, would be greater than the one calculated assuming the δ18O of sea water to be constant.
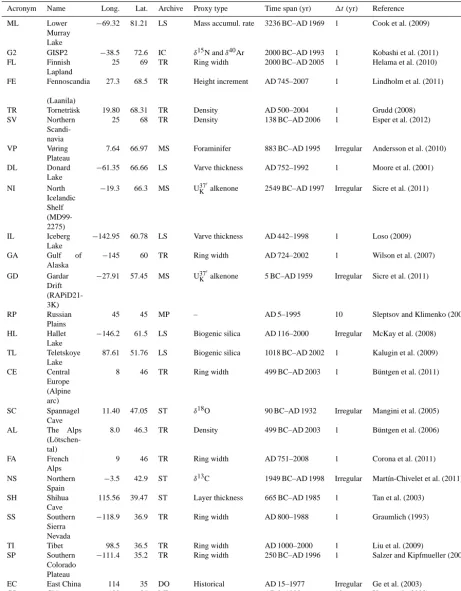
Table 1. Characteristics of the 26 temperature time series in the NH data set. The columns in the table give a two-letter acronym; a full
name based on the location; longitude; latitude; the archive from which the series was extracted; the proxy type; the time span; the sampling
interval,1t; and the published reference. The identification of the archives uses the following abbreviations: LS, lake sediments; IC, ice
core; TR, tree rings; MS, marine sediments; MP, multi-proxy composite; ST, speleothems; DO, documentary.
Acronym Name Long. Lat. Archive Proxy type Time span (yr) 1t(yr) Reference
ML Lower
Murray Lake
−69.32 81.21 LS Mass accumul. rate 3236 BC–AD 1969 1 Cook et al. (2009)
G2 GISP2 −38.5 72.6 IC δ15N andδ40Ar 2000 BC–AD 1993 1 Kobashi et al. (2011) FL Finnish
Lapland
25 69 TR Ring width 2000 BC–AD 2005 1 Helama et al. (2010)
FE Fennoscandia
(Laanila)
27.3 68.5 TR Height increment AD 745–2007 1 Lindholm et al. (2011)
TR Torneträsk 19.80 68.31 TR Density AD 500–2004 1 Grudd (2008) SV Northern
Scandi-navia
25 68 TR Density 138 BC–AD 2006 1 Esper et al. (2012)
VP Vøring Plateau
7.64 66.97 MS Foraminifer 883 BC–AD 1995 Irregular Andersson et al. (2010)
DL Donard Lake
−61.35 66.66 LS Varve thickness AD 752–1992 1 Moore et al. (2001)
NI North Icelandic Shelf (MD99-2275)
−19.3 66.3 MS U37K0alkenone 2549 BC–AD 1997 Irregular Sicre et al. (2011)
IL Iceberg Lake
−142.95 60.78 LS Varve thickness AD 442–1998 1 Loso (2009)
GA Gulf of
Alaska
−145 60 TR Ring width AD 724–2002 1 Wilson et al. (2007)
GD Gardar Drift (RAPiD21-3K)
−27.91 57.45 MS U37K0alkenone 5 BC–AD 1959 Irregular Sicre et al. (2011)
RP Russian Plains
45 45 MP – AD 5–1995 10 Sleptsov and Klimenko (2003)
HL Hallet Lake
−146.2 61.5 LS Biogenic silica AD 116–2000 Irregular McKay et al. (2008)
TL Teletskoye Lake
87.61 51.76 LS Biogenic silica 1018 BC–AD 2002 1 Kalugin et al. (2009)
CE Central Europe (Alpine arc)
8 46 TR Ring width 499 BC–AD 2003 1 Büntgen et al. (2011)
SC Spannagel Cave
11.40 47.05 ST δ18O 90 BC–AD 1932 Irregular Mangini et al. (2005)
AL The Alps (Lötschen-tal)
8.0 46.3 TR Density 499 BC–AD 2003 1 Büntgen et al. (2006)
FA French Alps
9 46 TR Ring width AD 751–2008 1 Corona et al. (2011)
NS Northern Spain
−3.5 42.9 ST δ13C 1949 BC–AD 1998 Irregular Martín-Chivelet et al. (2011)
SH Shihua Cave
115.56 39.47 ST Layer thickness 665 BC–AD 1985 1 Tan et al. (2003)
SS Southern Sierra Nevada
−118.9 36.9 TR Ring width AD 800–1988 1 Graumlich (1993)
TI Tibet 98.5 36.5 TR Ring width AD 1000–2000 1 Liu et al. (2009) SP Southern
Colorado Plateau
−111.4 35.2 TR Ring width 250 BC–AD 1996 1 Salzer and Kipfmueller (2005)
EC East China 114 35 DO Historical AD 15–1977 Irregular Ge et al. (2003) CS China
Stack
Figure 6. Reconstructed components RCs 6–8 of the NH
tempera-ture data set, representing a bicentennial oscillation; colour bar for
amplitude from−0.20 to 0.20◦C. Upper panel: RC pair of
temper-ature anomalies from MSSA analysis as a function of increasing latitude; lower panel: the same RC pair averaged over two latitude
bands, namely 30–60◦N (orange) and 60–90◦N (green), as well as
over the entire NH (black). The red curve represents the bicenten-nial oscillation of the central Europe series.
−0.1 ‰. This change would correspond, according to Pierre (1999), to a salinity decrease of about 0.4 PSU, a value that is of the order of the salinity variability range measured at Gallipoli during the last 60 years (Rixen et al., 2005).
We can thus state that the trend component ofδ18O reflects the long-term variations of NH temperature, provided that plausible changes in the hydrological balance of the Ionian basin are taken into account.
Turning now to the bicentennial component, we compare theδ18O and NH temperature 170-year oscillations in Fig. 7b (green and black curves, respectively). The average ampli-tude for NH temperature is about 0.06◦C, but, as shown by the upper panel of Fig. 5, the amplitude of this component varies considerably from record to record in the NH data set. Among the individual local records we actually notice larger amplitudes, as in the case of central Europe, for which the 170-year oscillation amplitude is as large as 0.2◦C. This is not surprising, considering the shorter timescale considered here. Theδ18O amplitude is of the order of 0.4–0.5 ‰, which according to the Shackleton equation and in the absence of salinity variations would correspond to 0.2◦C, in agreement with central Europe. On the other hand, the Ionian alkenone-derived SST record has a bicentennial variation amplitude of about 1◦C (Taricco et al., 2009), which would imply a local
(a)
(b)
Figure 7. Comparison between the reconstructed components
ex-tracted by SSA from theδ18O profile and the corresponding
os-cillations extracted by MSSA from the NH temperature data set.
(a) Long-term trend:δ18O RC 1 (dark-red line) and NH
tempera-ture RCs 1–2 (black line); (b) 170-years oscillation:δ18O RCs 6–8
(green line) and NH temperature RCs 6–8 (black line).
amplification effect in respect to European variability at this scale. This suggests that, also at this scale, it may be nec-essary to invoke salinity variations to explain the observed δ18O variations.
4 Conclusions
Appendix A
A1 Singular-spectrum analysis (SSA)
Singular-spectrum analysis (SSA) is a non-parametric spec-tral estimation method which was originally designed to ob-tain information about non-linear systems from short and noisy time series without appealing to the process govern-ing equations (Vautard and Ghil, 1989; Ghil and Vautard, 1991; Vautard et al., 1992; Ghil and Taricco, 1997; Ghil et al., 2002). SSA provides insight into the unknown or partially known dynamics of the underlying dynamical system by al-lowing the identification of different components of the anal-ysed signal, such as trends, oscillatory patterns and random noise, without requiring any a priori model.
SSA grounds on the Mañé–Takens delay embedding theo-rem, according to which the dynamics of a chaotic dynamical system can be reconstructed from a single time series by its time-delayed embedding (Mañé, 1981; Takens, 1981). The so-obtained extended phase space is defined by a new orthog-onal basis, which describes most of the variance in the origi-nal time series by a minimal number of components. Broom-head and King (1986) proposed the application of principal component analysis (PCA) in order to find the optimal solu-tion to that optimizasolu-tion problem.
In contrast to a classical Fourier decomposition, the new orthogonal basis is data-adaptive and not restricted to pure sine and cosine functions. Thus, SSA turns out to be a more flexible and less limited spectral analysis method, especially when dealing with highly noisy, volatile, and often nonsta-tionary experimental time series.
In more detail, given a time series{x(t ), t=1, . . ., N}of lengthN, anM-dimensional phase space is built by usingM lagged copies ofx:
X=
x(1) x(2) . . . x(M) x(2) x(3) . . . x(M+1)
. . . . . . . . . . . . x(N−M+1) x(N−M+2) . . . x(N )
. (A1)
Selecting the window length M involves a trade-off be-tween, on the one hand, the amount of spectral information, such as the number of peaks, one may gain on the time series and, on the other hand, the degree of signal-to-noise enhance-ment and the associated statistical confidence. The choice of M(see also Vautard et al., 1992; Ghil et al., 2002) thus cor-responds to a compromise between including more peaks for largerM– while taking into account that periods longer than Mcannot be resolved – and achieving a higher degree of sta-tistical significance for the peaks detected, at smallerM. In general, the stable features of the eigenset – i.e. of the set of eigenvalues and eigenvectors – can be evaluated by varying the window sizeMover a given range,M1≤M≤M2.
From the augmented time seriesX, the covariance matrix is computed asC=XTX/N.
The Toeplitz approach by Vautard and Ghil (1989) is ap-plied in order to ensure the stability of entriescijalong
(sub-and super-)diagonals of covariance matrix. That way,
cij =
1 N− |i−j|
N−|i−j|
X
t=1
x(t )x(t+ |i−j|) (A2)
are constants which depend only on the lag|i−j|. Next, the symmetric covariance matrix is diagonalized,
3=ETC E, (A3)
to yield a diagonal matrix3of eigenvaluesλkand an
orthog-onal matrixEof eigenvectors. The columnsek ofE
repre-sent the newM-dimensional coordinate system andλk
de-scribes the variance ofXin the direction ofek. The variance
of the original time seriesx(t )is preserved in the eigenval-ues, which now lie along the main diagonal of3.
By projecting the time series x(t ) onto each of the M eigenvectorsek,Mprincipal components (PCs) are obtained:
ak(t )= M X
j=1
x(t+j−1)ek(j ), (A4)
with 1≤t≤N−M+1.
Although PCs exhibit no exact phase information, it is pos-sible to analyse various aspects of the time series that belong to the directionekby computing its reconstructed component (RC),
rk(t )=
1 Mt
Ut
X
j=Lt
ak(t−j+1)ek(j ), (A5)
where(Mt, Lt, Ut)=(M,1, M)forM≤t≤N−M+1; for
either end interval refer to Ghil et al. (2002).
No information is lost during the reconstruction pro-cess, since the superposition of all individual RCs,x(t )=
PM
k=1rk(t ), gives the original time series (Vautard et al.,
1992).
A2 Monte Carlo SSA
A critical step when performing spectral analysis is the dis-tinction of significant oscillations from random fluctuations. Allen and Smith (1996) have proposed a stringent test, rely-ing on a sophisticated null hypothesis, which takes the possi-bility of spurious oscillations into account. Based on a Monte Carlo simulation technique, the extracted spectral compo-nents are tested against a red-noise hypothesis, i.e. an au-toregressive process of order 1, AR(1),
X(t )=a1[X (t−1)−X0]+σ ξ(t )+X0; (A6) hereX0 is the process mean and ξ a normally distributed white-noise process with zero mean and unit variance.
from any well-defined process, including the output of a de-terministic chaotic system.
The coefficientsa1andσ are estimated from the time se-ries using a maximum-likelihood criterion. An ensemble of surrogate time series is then generated from the AR(1) pro-cess and compared with the real data. In practice, the covari-ance matrixCRis firstly estimated for each AR(1) realization
and then projected onto the eigenvectors E of the original data:
3R=ETCRE. (A7)
The projection allows one to determine the degree of re-semblance between the surrogates generated by the test and the original data by computing statistics on the diagonal el-ements. From the ensemble distribution ofλR along the
Acknowledgements. The authors thank S. M. Bernasconi
(Geolog-ical Institute, ETH, Zurich, Switzerland) for the mass spectrometer
measurements of δ18O and P. Colombetti and A. Romero for
their dedicated technical assistance. Sara Rubinetti acknowledges funding support from INFN-Torino.
Edited by: N. Abram
References
Allen, M. R. and Robertson, A. W.: Distinguishing modulated os-cillations from coloured noise in multivariate datasets, Clim. Dy-nam., 12, 775–784, 1996.
Allen, M. R. and Smith, L. A.: Monte Carlo SSA: detecting irregular oscillations in the presence of colored noise, J. Climate, 9, 3373– 3404, 1996.
Andersson, C., Pausata, F. S. R., Jansen, E., Risebrobakken, B., and Telford, R. J.: Holocene trends in the foraminifer record from the Norwegian Sea and the North Atlantic Ocean, Clim. Past, 6, 179–193, doi:10.5194/cp-6-179-2010, 2010.
Arnó, V., Principe, C., Rosi, M., Santacroce, R., Sbrana, A., and Sheridan, M. F.: Eruptive history, in: Summa-Vesuvius, Quaderni de La Ricerca Scientifica, edited by Santacroce R., CNR, Roma, Italy, 114, 53–103, 1987.
Barnett, T. P., Hasselmann, K., Chelliah, M., Delworth, T., Hegerl, G., Jones, P. D., Rasmusson, E., Roeckner, E., Ro-pelewski, C., Santer, B., and Tett, S.: Detection and attribution of recent climate change: a status report, B. Am. Meteorol. Soc., 80, 2631–2659, 1999.
Boiseau, M., Ghil, M., and Juillet-Leclerc, A.: Climatic trends and interdecadal variability from South-Central Pacific coral records, Geophys. Res. Lett., 26, 2881–2884, 1999.
Bonino, G., Cini Castagnoli, G., Callegari, E., and Zhu, G. M.: Ra-diometric and tephroanalysis dating of recent Ionian sea cores, Nuovo Cimento C, 16, 155–161, 1993.
Broomhead, D. S. and King, G.: Extracting qualitative dynamics from experimental data, Physica D, 20, 217–236, 1986. Büntgen U., Frank, D. C., Nievergelt, D., and Esper, J.: Summer
temperature variations in the European Alps, AD 755–2004, J. Climate, 19, 5606–5623, 2006.
Büntgen, U., Tegel, W., Nicolussi, K., McCormick, M., Frank, D., Trouet, V., Kaplan, J. O., Herzig, F., Heussner, K. U., Wan-ner, H., Luterbacher, J., and Esper, J.: 2500 years of European climate variability and human susceptibility, Science, 331, 578– 582, 2011.
Cini Castagnoli, G., Bonino, G., Caprioglio, F., Provenzale, A., Se-rio, M., and Zhu, G. M.: The carbonate profile of two recent Io-nian sea cores: evidence that the sedimentation rate is constant over the last millenia, Geophys. Res. Lett., 17, 1937–1940, 1990. Cini Castagnoli, G., Bonino, G., Provenzale, A., Serio, M., and
Cal-legari, E.: The CaCO3 profiles of deep and shallow
Mediter-ranean sea cores as indicators of past solar-terrestrial relation-ship, Nuovo Cimento C, 15, 547–563, 1992.
Cini Castagnoli, G., Bonino, G., Della Monica, P., Taricco, C., and Bernasconi, S. M.: Solar activity in the last millennium recorded
in theδ18O profile of planktonic foraminifera of a shallow water
Ionian Sea core, Solar Phys., 188, 191–202, 1999.
Cini Castagnoli, G., Bonino, G., and Taricco, C.: Long term so-larterrestrial records from sediments: Carbon isotopes in plank-tonic foraminifera during the last millennium, Adv. Space Res., 29, 1537–1549, 2002a.
Cini Castagnoli, G., Bonino, G., Taricco, C., and Bernasconi, S. M.: Solar radiation variability in the last 1400 years recorded in the carbon isotope ratio of a Mediterranean sea core, Adv. Space Res., 29, 1987–1994, 2002b.
Cook, T. L., Bradley, R. S., Stoner, J. S., and Francus, P.: Five thousand years of sediment transfer in a High Arctic watershed recorded in annually laminated sediments from Lower Murray Lake, Ellesmere Island, Nunavut, Canada, J. Paleolimnol., 41, 77–94, 2009.
Corona, C., Edouard, J. L., Guibal, F., Guiot, J., Bernard, S., Thomas, A., and Denelle, N.: Long-term summer (AD 751– 2008) temperature fluctuation in the French Alps based on tree-ring data, Boreas, 40, 351–366, 2011.
Crowley, T. J.: Causes of climate change over the past 1000 years,
Science, 289, 270–277, doi:10.1126/science.289.5477.270,
2000.
Esper, J., Cook, E. R., and Schweingruber, F. H.: Low-frequency signals in long tree-ring chronologies for recon-structing past temperature variability, Science, 295, 2250–2253, doi:10.1126/science.1066208, 2002.
Esper J., Frank, D. C., Timonen, M., Zorita, E., Wilson, R. J. S., Luterbacher, J., Holzkämper, S., Fischer, N., Wagner, S., Niev-ergelt, D., Verstege, A., and Büntgen, U.: Orbital forcing of tree-ring data, Nat. Clim. Chang., 2, 862–866, 2012.
Folland, C. K. and Karl, T. R.: Recent rates of warming in marine environment meet controversy, Eos, Trans. AGU, 82, 453–461, doi:10.1029/01EO00270, 2001.
Ge, Q., Zheng, J., Fang, X., Man, Z., Zhang, X., Zhang, P., and Wang, W. C.: Winter half-year temperature reconstruction for the middle and lower reaches of the Yellow River and Yangtze River, China, during the past 2000 years, Holocene, 13, 933–940, 2003. Ghil, M. and Taricco, C.: Advanced spectral analysis methods, in: Past and Present Variability of the Solar-terrestrial System: Mea-surement, Data Analysis and Theoretical Models, edited by: Cini Castagnoli, G. and Provenzale, A., IOS Press, Amsterdam, the Netherlands, 137–159, 1997.
Ghil, M. and Vautard, R.: Interdecadal oscillations and the warming trend in global temperature time series, Nature, 350, 324–327, 1991.
Ghil, M., Allen, M. R., Dettinger, M. D., Ide, K., Kondrashov, D., Mann, M. E., Robertson, A. W., Saunders, A., Tian, Y., Varadi, F., and Yiou, P.: Advanced spectral methods for climatic time series, Rev. Geophys., 40, 3.1–3.41, doi:10.1029/2000RG000092, 2002. Graumlich, L. J.: A 1000-yr record of temperature and precipitation
in the Sierra Nevada, Quaternary Res., 39, 249–255, 1993. Grudd, H.: Torneträsk tree-ring width and density AD 500–2004:
a test of climatic sensitivity and a new 1500-year reconstruc-tion of North Fennoscandian summers, Clim. Dyn., 31, 843–857, 2008.
Guo, W., Wang, Y., and Brown, M. B.: A signal extraction approach to modelling hormone time series with pulses and a changing baseline, J. Am. Stat. Assoc., 94, 746–756, 1999.
mid and late Holocene perspectives, Geol. Soc. Am. Bull., 122, 1981–1988, 2010.
Jones, P. D.: Climate variations and forcing mechanisms of the last 2000 Years, edited by: Bradley, S., and Jouzel, J., NATOASI Se-ries I, Springer-Verlag, Berlin, Germany, 649 pp., 1996. Jones, P. D. and Briffa, K. R.: What can the instrumental record
tell us about longer timescale paleoclimatic reconstructions, in: Climatic Variations and Forcing Mechanisms of the Last 2000 Years, Springer-Verlag, Berlin, 625–644, 1996.
Jones, P. D., Briffa, K. R., Barnett, T. P., and Tett, S. F. B.: High-resolution palaeoclimatic records for the last millennium: inter-pretation, integration and comparison with General Circulation Model control-run temperatures, Holocene, 8, 455–471, 1998. Jones, P. D., New, M., Parker, D. E., Martin, S., and Rigor, I. G.:
Surface air temperature and its changes over the past 150 years, Rev. Geophys., 37, 173–199, 1999.
Jones, P. D., Lister, D. H., Osborn, T. J., Harpham, C., Salmon, M., and Morice, C. P.: Hemispheric and large-scale land-surface air temperature variations: An extensive revi-sion and an update to 2010, J. Geophys. Res., 117, D05127, doi:10.1029/2011JD017139, 2012.
Jones, P. D., Parker, D. E., Osborn, T. J., and Briffa, K. R.: Global and hemispheric temperature anomalies – land and ma-rine instrumental records, in Trends: A Compendium of Data on Global Change, Carbon Dioxide Information Analysis Cen-ter, Oak Ridge National Laboratory, US Department of Energy, Oak Ridge, Tenn., USA, doi:10.3334/CDIAC/cli.002, 2013. Kalugin, I. A., Daryin, A. V., and Babich, V. V.: Reconstruction of
annual air temperatures for three thousand years in Altai region by lithological and geochemical indicators in Teletskoe Lake sed-iments, Dokl. Earth Sci., 426, 681–684, 2009.
Keppenne, C. L. and Ghil, M.: Adaptive filtering and prediction of noisy multivariate signals: An application to subannual variabil-ity in atmospheric angular momentum, Intl. J. Bifurcation Chaos, 3, 625–634, 1993.
Kobashi, T., Kawamura, K, Severinghaus, J. P., Barnola, J.-M., Nakaegawa, T., Vinther, B. M., Johnsen, S. J., and Box, J. E.: High variability of Greenland surface temperature over the past 4000 years estimated from trapped air in an ice core, Geophys. Res. Lett., 38, L21501, doi:10.1029/2011GL049444, 2011. Krishnaswamy, S., Lal, D., Martin, J. M., and Meybeck, M.:
Geochronology of lake sediments, Earth Planet. Sc. Lett., 11, 407–414, 1971.
Lehner, F., Raible, C. C., and Stocker, T. F.: Testing the ro-bustness of a precipitation proxy-based North Atlantic Os-cillation reconstruction, Quaternary Sci. Rev., 45, 85–94, doi:10.1016/j.quascirev.2012.04.025, 2012.
Lindholm, M., Jalkanen, R., Salminen, H., Aalto, T., and Ogurtsov, M.: The height-increment record of summer tem-perature extended over the last millennium in Fennoscandia, Holocene, 21, 319–326, 2011.
Liu, Y., An, Z. S., Linderholm, H. W., Chen, D. L., Song, H. M., Cai, Q. F., Sun, J. Y., and Tian, H.: Annual temperatures during the last 2485 years in the mid-eastern Tibetan Plateau inferred from tree rings, Sci. China Ser. D, 52, 348–359, 2009.
Loso, M. G.: Summer temperatures during the Medieval Warm Pe-riod and Little Ice Age inferred from varved proglacial lake sed-iments in Southern Alaska, J. Paleolimnol., 41, 117–128, 2009.
Luckman, B. H., Briffa, K. R., Jones, P. D., and Schweingru-ber, F. H.: Tree-ring based reconstruction of summer tempera-tures at the Columbia Icefield, Alberta, Canada, AD 1073–1983, Holocene, 7, 375–389, 1999.
Mañé, R.: On the dimension of the compact invariant sets of certain non-linear maps. In: Dynamical Systems and Turbulence, Vol. 898 of Lecture Notes in Mathematics, Springer, Berlin, 230–242, 1981.
Mangini, A., Spötl, C., and Verdes, P.: Reconstruction of
temper-ature in the Central Alps during the past 2000 yr from aδ18O
stalagmite record, Earth Planet. Sc. Lett., 235, 741–751, 2005. Mann, M. E. and Jones, P. D.: Global surface temperatures over
the past two millennia, Geophys. Res. Lett., 30, 1820–1823, doi:10.1029/2003GL017814, 2003.
Mann, M. E., Bradley, R. S., and Hughes, M. K.: Northern Hemi-sphere temperatures during the past millennium: Inferences, un-certainties, and limitations, Geophys. Res. Lett., 26, 759–762, 1999.
Mann, M. E., Zhang, Z., Hughes, M. K., Bradley, R. S., Miller, S. K., and Rutherford, S.: Proxy-based reconstructions of hemispheric and global surface temperature variations over the past two millennia, P. Natl. Acad. Sci., 105, 13252–13257, doi:10.1073/pnas.0805721105, 2008.
Martín-Chivelet, J., Muñoz-García, M. B., Edwards, R. L., Tur-rero, M. J., and Ortega, A. I.: Land surface temperature
changes in Northern Iberia since 4000 yr BP, based onδ13C of
speleothems, Global Planet. Change, 77, 1–12, 2011.
Martinson, D. G., Bryan, K., Ghil, M., Hall, M. M., Karl, T. R., Sarachik, E. S., Sorooshian, S., and Talley, L. D. (Eds.): Natural climate variability on decade-to-century time scales, in: National Research Council of the National Academies, National Academy Press, Washington DC, USA, 630 pp., 1995.
McKay, N. P., Kaufman, D. S., and Michelutti, N.: Biogenic sil-ica concentration as a high-resolution, quantitative temperature proxy at Hallet Lake, South-central Alaska, Geophys. Res. Lett., 35, L05709, doi:10.1029/2007GL032876, 2008.
Moberg, A., Sonechkin D. M., Holmgren, K., Datsenko, N. M., and Karlén, W.: Highly variable Northern Hemisphere temperatures reconstructed from low- and high-resolution proxy data, Nature, 433, 613–617, 2005.
Moore, J. J., Hughen, K. A., Miller, G. H., and Overpeck, J. T.: Little Ice Age recorded in summer temperature reconstruction from varved sediments of Donard Lake, Baffin Island, Canada, J. Paleolimnol., 25, 503–517, 2001.
National Research Council of the National Academies: Surface temperature reconstructions for the last 2000 years, National Academy Press, Washington DC, USA, 145 pp., 2006.
Naveau, P., Ammann, C., Oh, H. S., and Guo, W.: An automatic statistical methodology to extract pulse-like forcing factors in climatic time series: Application to volcanic events, edited by: Robock, A., Volcanism and the Earth’s Atmosphere, Geophysi-cal Monograph, 139, 177–186, 2003.
Pierre, C.: The oxygen and carbon isotope distribution in the Mediterranean water masses, Mar. Geol., 153, 41–55, 1999. Plaut, G. and Vautard, R.: Spells of low-frequency oscillations and
Plaut, G., Ghil, M., and Vautard, R.: Interannual and interdecadal variability in 335 yr of Central England temperatures, Science, 268, 710–713, 1995.
Rixen, M., Beckers, J.-M., Levitus, S., Antonov, J., Boyer, T., Mail-lard, C., Fichaut, M., Balopoulos, E., Iona, S., Dooley, H., Gar-cia, M.-J., Manca, B., Giorgetti, A., Manzella, G., Mikhailov, N., Pinardi, N., Zavatarelli, M., and the Medar Consortium: The Western Mediterranean Deep Water: a proxy for climate change, Geophys. Res. Lett., 32, L12608, doi:10.1029/2005GL022702, 2005.
Salzer, M. W. and Kipfmueller, K. F.: Reconstructed temperature and precipitation on a millennial timescale from tree-rings in the Southern Colorado Plateau, USA, Climatic Change, 70, 465– 487, 2005.
Shackleton, N. J. and Kennett, J. P.: Palaeo-temperature history of the Cenozoic and the initiation of Antarctic glaciation: Oxygen and carbon isotope analysis in DSDP sites 277, 279 and 281, in: Initial Reports of the Deep Sea Drilling Project, edited by: Kennet, J. P. and Houtz, R. E., US Government Printing Office, Washington, DC, USA, 5, 743–755, 1975.
Sicre M.-A., Hall, I. R., Mignot J., Khodri, M., Ezat, U., Truong, M.-X., Eiríksson, J., and Knudsen, K.-L.: Sea surface temperature variability in the subpolar Atlantic over the last two millennia, Paleoceanography, 26, PA4218, doi:10.1029/2011PA002169, 2011.
Sleptsov, A. M. and Klimenko, V. V.: Multi-proxy reconstruction of the climate of Eastern Europe during the last 2000 yr, Izvestya of the Russian Geographical Society, 6, 45–54, 2003 (in Russian). Takens, F.: Detecting strange attractors in turbulence. In:
Dynami-cal Systems and Turbulence, Vol. 898 of Lecture Notes in Math-ematics, Springer, Berlin, 366–381, 1981.
Tan, M., Liu T. S., Hou, J., Qin, X., Zhang, H., and Li, T.: Cyclic rapid warming on centennial-scale revealed by a 2650-year sta-lagmite record of warm season temperature, Geophys. Res. Lett., 30, 1617–1620, doi:10.1029/2003GL017352, 2003.
Taricco, C., Alessio, S., and Vivaldo, G.: Sequence of erup-tive events in the Vesuvio area recorded in shallow-water Io-nian Sea sediments, Nonlin. Processes Geophys., 15, 25–32, doi:10.5194/npg-15-25-2008, 2008.
Taricco, C., Ghil, M., Alessio, S., and Vivaldo, G.: Two millennia of climate variability in the Central Mediterranean, Clim. Past, 5, 171–181, doi:10.5194/cp-5-171-2009, 2009.
Taricco, C., Mancuso, S., Ljungqvist, F. C., Alessio, S., and Ghil, M.: Multispectral analysis of Northern Hemisphere tem-perature records over the last five millennia, Clim. Dynam., doi:10.1007/s00382-014-2331-1, 2014.
Tingley, M. P., Craigmile, P. F., Haran, M., Li, B., Mannshardt, E., and Rajaratnam, B.: Piecing together the past: statistical insights into paleoclimatic reconstructions, Quaternary Sci. Rev., 35, 1– 22, 2012.
Vautard, R. and Ghil, M.: Singular spectrum analysis in nonlinear dynamics, with applications to paleoclimatic time series, Physica D, 35, 395–424, 1989.
Vautard, R., Yiou, P., and Ghil, M.: Singular spectrum analysis: a toolkit for short noisy chaotic signals, Physica D, 58, 95–126, 1992.
Versteegh, G. J. M., de Leeuw, J. W., Taricco, C., and Romero, A.: Temperature and productivity influences on
U37K0 and their possible relation to solar forcing of the
Mediterranean winter, Geochem. Geophy. Geosy., 8, Q09005, doi:10.1029/2006GC001543, 2007.
Vivaldo, G., Taricco, C., Alessio, S., and Ghil, M: Accurate dating of Gallipoli Terrace (Ionian Sea) sediments: Historical eruptions and climate records, PAGES News, 17, 8–9, 2009.
Wilson, R., Wiles, G., D’Arrigo, R., and Zweck, C.: Cycles and shifts: 1,300 years of multi-decadal temperature variability in the Gulf of Alaska, Clim. Dynam., 28, 425–440, 2007.