www.ocean-sci.net/13/411/2017/ doi:10.5194/os-13-411-2017
© Author(s) 2017. CC Attribution 3.0 License.
Coastal ocean acidification and increasing total alkalinity
in the northwestern Mediterranean Sea
Lydia Kapsenberg1, Samir Alliouane1, Frédéric Gazeau1, Laure Mousseau1, and Jean-Pierre Gattuso1,2
1Sorbonne Universités, Université Pierre et Marie Curie-Paris 6, CNRS-INSU, Laboratoire d’Océanographie de Villefranche, 06230 Villefranche-sur-Mer, France
2Institute for Sustainable Development and International Relations, Sciences Po, 27 rue Saint Guillaume, 75007 Paris, France
Correspondence to:Jean-Pierre Gattuso (gattuso@obs-vlfr.fr)
Received: 30 August 2016 – Discussion started: 13 September 2016
Revised: 10 April 2017 – Accepted: 14 April 2017 – Published: 15 May 2017
Abstract. Coastal time series of ocean carbonate chem-istry are critical for understanding how global anthropogenic change manifests in near-shore ecosystems. Yet, they are few and have low temporal resolution. At the time series sta-tion Point B in the northwestern Mediterranean Sea, seawa-ter was sampled weekly from 2007 through 2015, at 1 and 50 m, and analyzed for total dissolved inorganic carbon (CT) and total alkalinity (AT). Parameters of the carbonate sys-tem such as pH (pHT, total hydrogen ion scale) were calcu-lated and a deconvolution analysis was performed to identify drivers of change. The rate of surface ocean acidification was
−0.0028±0.0003 units pHTyr−1. This rate is larger than previously identified open-ocean trends due to rapid warming that occurred over the study period (0.072±0.022◦C yr−1). The total pHT change over the study period was of simi-lar magnitude as the diel pHT variability at this site. The acidification trend can be attributed to atmospheric carbon dioxide (CO2) forcing (59 %, 2.08±0.01 ppm CO2yr−1) and warming (41 %). Similar trends were observed at 50 m but rates were generally slower. At 1 m depth, the increase in atmospheric CO2 accounted for approximately 40 % of the observed increase in CT (2.97±0.20 µmol kg−1yr−1). The remaining increase in CT may have been driven by the same unidentified process that caused an increase in
AT (2.08±0.19 µmol kg−1yr−1). Based on the analysis of monthly trends, synchronous increases in CT andAT were fastest in the spring–summer transition. The driving process of the interannual increase in AT has a seasonal and shal-low component, which may indicate riverine or groundwater influence. This study exemplifies the importance of under-standing changes in coastal carbonate chemistry through the
lens of biogeochemical cycling at the land–sea interface. This is the first coastal acidification time series providing multi-year data at high temporal resolution. The data confirm rapid warming in the Mediterranean Sea and demonstrate coastal acidification with a synchronous increase in total alkalinity.
1 Introduction
−0.0026 (Irminger Sea, North Atlantic) to−0.0013 (South Pacific) units pH yr−1 (Bates et al., 2014). Such time series remain spatially limited, especially in coastal regions, which provide valuable ecosystem services (Barbier et al., 2011; Costanza et al., 1997) and are under high anthropogenic im-pact (Halpern et al., 2008). Here, we present the first coastal ocean acidification time series at high temporal resolution.
Compared to the global ocean, marginal seas play a crit-ical role in anthropogenic CO2 storage via enhanced CO2 uptake and export to the ocean interior (Lee et al., 2011). As a marginal sea, the Mediterranean Sea has a naturally high capacity to absorb but also buffer anthropogenic CO2 (Ál-varez et al., 2014; Palmiéri et al., 2015). This is primarily due to the high total alkalinity (AT)of Mediterranean waters and overturning circulation (Lee et al., 2011; Palmiéri et al., 2015; Schneider et al., 2010). In the Mediterranean Sea, the salinity–ATrelationship is driven by the addition of river dis-charge and Black Sea input, which are generally high inAT (Copin-Montégut, 1993; Schneider et al., 2007). Combined with evaporation, this results in higherATand salinity in the Mediterranean Sea compared to the Atlantic Mediterranean source water (Jiang et al., 2014). On average, Mediterranean Sea AT is 10 % higher than in the global ocean (Palmiéri et al., 2015). The surface ocean acidification rate, estimated at1pHT(total hydrogen ion scale) of−0.08 since 1800, is comparable to that of the global ocean despite a 10 % greater anthropogenic carbon inventory (Palmiéri et al., 2015). Due to its important role in carbon sequestration and ecological sensitivity to anthropogenic change with economic conse-quences (Lacoue-Labarthe et al., 2016), the Mediterranean Sea could provide insight to global trends (Lejeusne et al., 2010).
Over the last few years, numerous studies have esti-mated ocean acidification rates across the Mediterranean Sea (Table 1). Together, these studies cover various peri-ods with a range of techniques yielding different results. For example, estimates of change in pH of bottom waters since the preindustrial era range between−0.005 and−0.06 (Palmiéri et al., 2015) and up to as much as −0.14 for full profile estimates (Touratier and Goyet, 2011). Techniques for estimating ocean acidification in the Mediterranean Sea thus far include the following: (1) hind-casting, using high-resolution regional circulation models (Palmiéri et al., 2015), the TrOCA approach as applied to cruise-based profile data (Krasakopoulou et al., 2011; Touratier and Goyet, 2011; Touratier et al., 2016), and others (Howes et al., 2015); (2) partially reconstructed time series (Marcellin Yao et al., 2016); (3) comparative study periods (Luchetta et al., 2010; Meier et al., 2014); and (4) sensor-based observations over a short study period (Flecha et al., 2015). Ocean acidification time series of consistent sampling over many years are lack-ing for the Mediterranean Sea (The MerMex Group, 2011), particularly along the coast where river discharge influences the carbonate system (Ingrosso et al., 2016).
Compared to the open ocean, shallow coastal sites exhibit natural variability in carbonate chemistry over annual time frames (Hofmann et al., 2011; Kapsenberg and Hofmann, 2016; Kapsenberg et al., 2015), complicating the detection and relevance of open ocean acidification in isolation of other processes (Duarte et al., 2013). In the northwestern (NW) Pacific coast, rapid acidification of surface waters (1pHT
−0.058 units yr−1)at Tatoosh Island was documented in the absence of changes in known drivers of local pH variabil-ity (e.g., upwelling, eutrophication, and more; Wootton and Pfister, 2012; Wootton et al., 2008). Further inshore, in the Hood Canal subbasin of the Puget Sound, only 24–49 % of the estimated pH decline from preindustrial values could be attributed to anthropogenic CO2(Feely et al., 2010). The ex-cess decrease in pH was attributed to increased remineral-ization (Feely et al., 2010). Acidification rates documented along the North Sea Dutch coastline and inlets were highly variable in space, with some exceeding the expected anthro-pogenic CO2rate by an order of magnitude while others ex-hibited an increase in pH (Provoost et al., 2010).
Variability in coastal carbonate chemistry stems from both physical (e.g., upwelling, river discharge; Feely et al., 2008; Vargas et al., 2016) and biological processes (e.g., primary production, respiration, net calcification). Within watersheds, coastal carbonate chemistry is affected by eutrophication (Borges and Gypens, 2010; Cai et al., 2011), groundwater supply (Cai et al., 2003), and land use and rain influence on river alkalinity (Raymond and Cole, 2003; Stets et al., 2014). Over longer periods, pH can also be influenced by atmospheric deposition (Omstedt et al., 2015). Through pri-mary production and respiration, coastal ecosystems produce pH fluctuations over timescales ranging from hours (e.g., sea-grass, kelp) to months (e.g., phytoplankton blooms; Kapsen-berg and Hofmann, 2016). Due to existing pH variability in coastal seas, it is necessary to quantify high-frequency trends in order to interpret the pH changes inferred from lower-frequency sampling.
In this study, we present the first complete time series data quantifying the present-day ocean acidification rate for a coastal site in the Mediterranean Sea, based on weekly mea-surements ofATandCT sampled from 2007 through 2015. For a subset of this time series, pH variability was docu-mented using a SeaFET™ Ocean pH Sensor in order to as-sess hourly pH variability. For comparison and consistency with other ocean acidification time series around the world, we report rates of change based on anomalies (Bates et al., 2014) and identify drivers of change.
2 Materials and methods 2.1 Site description
A carbonate chemistry time series was initiated in 2007 and maintained through 2015 in the NW Mediterranean Sea at the
entrance of the Bay of Villefranche-sur-Mer, France (Fig. 1): Point B station (43.686◦N, 7.316◦E, 85 m bottom depth). A second site, the Environment Observable Littoral buoy (EOL, 43.682◦N, 7.319◦E, 80 m bottom depth), was used for pH sensor deployment starting in 2014. These two sites are 435 m apart. Point B has been an oceanographic station since 1957. A full site description and research history has been de-tailed by De Carlo et al. (2013). Briefly, the Bay is a narrow north–south facing inlet with steep bathymetry and estimated volume of 310 million m3. The surrounding region is pre-dominantly composed of limestone with a series of shallow, submarine groundwater karst springs (Gilli, 1995). The north current, a major and structuring counterclockwise current in the Ligurian Sea, can sometimes flow close to Point B. The Bay can also be, on occasion, influenced by local countercur-rents. Both of these hydrodynamic movements have signa-tures of river discharge. Limestone erosion can be observed in theATof rivers nearest to Point B (Paillon, due 4 km west; Var due 10 km west; and Roya due 26 km east). RiverAT ranges between 1000 and 2000 µmol kg−1(data from Agence de l’Eau Rhône-Méditerranée-Corse, http://sierm.eaurmc.fr), and is lower than seawater AT. The Paillon River, whose plume on occasion reaches into the Bay (L. Mousseau, per-sonal observation, 2013, 2014), was sampled on 18 August 2014 and had a AT of 1585±0.1 µmol kg−1 (N=2, Gat-tuso, unpublished). Due to low primary productivity, sea-sonal warming drives the main annual variability in carbon-ate chemistry at this location (De Carlo et al., 2013). 2.2 Point B data collection, processing, and analysis
To document long-term changes in ocean carbonate chem-istry at Point B, seawater was sampled weekly from 9 Jan-uary 2007 to 22 December 2015. Samples were collected at 1 and 50 m, using a 12 L Niskin bottle at 09:00 LT. Seawater was transferred from the Niskin bottle to 500 mL borosilicate glass bottles and fixed within an hour via addition of satu-rated mercuric chloride for preservation of carbonate param-eters, following recommendations by Dickson et al. (2007). Duplicate samples were collected for each depth. For each sampling event, CTD casts were performed either with a Seabird 25 or Seabird 25+profiler whose sensors are cali-brated at least every 2 years. Accuracy of conductivity (SBE4 sensor) and temperature (SBE3 sensor) measurements from CTD casts were 0.0003 S m−1and 0.001◦C, respectively.
Figure 1.Map of study region in the NW Mediterranean Sea(a), along the north current(b)in the Bay of Villefranche-sur-Mer, France(c). Point B, the EOL buoy, and the offshore time series station DYFAMED are marked. Bathymetric line units are measured in meters (m)(c).
Only obvious outliers were omitted from the analyses: three CT values at 1 m (> 2300 µmol kg−1), one AT value at 1 m (> 2900 µmol kg−1), and one AT value at 50 m (< 2500 µmol kg−1). TheCTandATmeasurements on repli-cate bottle samples were averaged for analyses.
Calculations of the carbonate system parameters were performed using the R package seacarb version 3.1 with
CT,AT, in situ temperature, and salinity as inputs (Gattuso et al., 2016). Total concentrations of silicate (SiOH4)and phosphate (PO34−)were used, when available from Point B (Mousseau, unpublished, http://somlit.epoc.u-bordeaux1.fr/ fr/). Detection limits for nutrients were 0.03 µM for SiOH4 and 0.003 to 0.02 µM for PO34−; relative precision of these analyses is 5–10 % (Aminot and Kérouel, 2007). Total boron concentration was calculated from salinity using the global ratio determined by Lee et al. (2010). The following con-stants were used:K1andK2 from Lueker et al. (2000),Kf from Perez and Fraga (1987), andKs from Dickson (1990). Reported measured parameters are temperature, salinity,AT, and CT, and derived parameters are pHT (total hydrogen ion scale), pHT normalized to 25◦C (pHT25), pCO2, and aragonite (a) and calcite (c) saturation states. Salinity-normalized changes in AT (nAT) andCT (nCT) were cal-culated by dividing by in situ salinity and multiplying by 38. Except for pHT25, all parameters are reported at in situ tem-peratures.
The average uncertainties of the derived carbonate pa-rameters were calculated according to the Gaussian method (Dickson and Riley, 1978) implemented in the “errors” function of the R package seacarb 3.1 (Gattuso et al., 2016). The uncertainties are ±2.7×10⁻¹⁰mol H+ (about 0.015 units pHT), ±15 µatmpCO2, and ±0.1 unit of the aragonite and calcite saturation states.
To quantify interannual changes in carbonate parameters, the data were detrended for seasonality by subtracting the respective climatological monthly means computed for the period 2009–2015 from the time series (hereafter “monthly means”). The resulting residuals were analyzed using a lin-ear regression to compute anomaly trends. This approach fol-lows methods from Bates et al. (2014) to allow for compar-isons of trends observed at different time series stations. All analyses were performed in R (R Core Team, 2016). 2.3 Deconvolution of pHTandpCO2
To identify proportional contributions of various drivers to ocean acidification trends at Point B, deconvolution of time series pHT andpCO2 was performed following meth-ods from García-Ibáñez et al. (2016) for observations at 1 and 50 m. The equation is described below for pHT, where changes in pHT are driven by changes in temperature (T ), salinity (S),AT, andCT, over time (t ).
dpHT dt =
∂pHT ∂T
dT dt +
∂pHT ∂S
dS dt +
∂pHT ∂AT
dAT dt +
∂pHT ∂CT
dCT dt (1) Here, ∂pHT
∂var dvar
dt represents the slope contribution of
chang-ing “var” to the estimated change in pHT
dpH
T
dt
, where var is either temperature (T), salinity (S),AT, orCT. The sen-sitivity of pH to var ∂pHT
∂var
was estimated by calculating pHTusing the true observations of var and holding the other three variables constant (mean value of the time series) and regressing it to var. Sensitivity∂pHT
∂var
was then multiplied by the anomaly rate of var (Table 2). The calculation was re-peated forpCO2
dpCO
2
dt
Table 2.Time series anomaly regression analyses on seawater carbonate chemistry at Point B for salinity (S), temperature (T), dissolved inorganic carbon (CT), total alkalinity (AT), pHT, pHT normalized to 25◦C (pHT25),pCO2, calcite (c)and aragonite (a)saturation state, and salinity-normalizedAT(nAT)andCT(nCT), at 1 and 50 m. Slopes represent the change in the variable unit per year.P 0.001 indicatespvalues far smaller than 0.001. SE stands for standard error. Degrees of freedom are denoted by df.
Depth (m) Variable Slope±SE Intercept±SE N F df SlopeP R2 1 S −0.0017±0.0044 3.38±8.82 417 0.147 1, 415 0.702 0 T (◦C) 0.072±0.022 −145±44 413 10.999 1, 411 0.001 0.026 CT(µmol kg−1) 2.97±0.20 −5965±400 416 221.87 1, 414 0.001 0.349 AT(µmol kg−1) 2.08±0.19 −4189±379 417 122.429 1, 415 0.001 0.228 pHT −0.0028±0.0003 5.72±0.66 412 74.205 1, 410 0.001 0.153 pHT25 −0.0017±0.0002 3.46±0.43 412 64.204 1, 410 0.001 0.1354 pCO2(µatm) 3.53±0.39 −7105±776 412 83.927 1, 410 0.001 0.17 c −0.0109±0.0022 22.0±4.5 412 24.08 1, 410 0.001 0.055 a −0.0064±0.0015 12.9±3.1 412 17.33 1, 410 0.001 0.041 nAT(µmol kg−1) 2.20±0.28 −4425±560 412 62.34 1, 410 0.001 0.132 nCT(µmol kg−1) 3.12±0.29 −6275±579 412 117.486 1, 410 0.001 0.223 50 S 0.0063±0.0020 −12.8±4.1 412 9.858 1, 410 0.002 0.0235 T (◦C) 0.088±0.019 −177±38 408 21.927 1, 406 0.001 0.0512 CT(µmol kg−1) 2.16±0.21 −4344±418 411 108.105 1, 409 0.001 0.2091 AT(µmol kg−1) 1.59±0.15 −3192±309 412 106.947 1, 410 0.001 0.2069 pHT −0.0026±0.0002 5.28±0.50 407 112.111 1, 405 0.001 0.2168 pHT25 −0.0013±0.0003 2.55±0.54 407 21.863 1, 405 0.001 0.0512 pCO2(µatm) 2.79±0.25 −5603±501 407 125.1 1, 405 0.001 0.236 c −0.0070±0.0027 14.0±5.4 407 6.648 1, 405 0.01 0.0162 a −0.0038±0.0019 7.6±3.7 407 4.155 1, 405 0.042 0.0102 nAT(µmol kg−1) 1.15±0.13 −2309±254 407 82.309 1, 405 0.001 0.1689 nCT(µmol kg−1) 1.82±0.19 −3661±376 407 94.98 1, 405 0.001 0.19
As a subcomponent of ∂pCO2 ∂CT
dCT
dt , the rate of
anthro-pogenic CO2increase was estimated from atmospheric CO2 concentrations nearest to Point B (Plateau Rosa, Italy, cour-tesy of the World Data Center for Greenhouse Gases, http:// ds.data.jma.go.jp/gmd/wdcgg/). For these data, missing daily values were linearly interpolated, climatological monthly means were calculated and subtracted from the time series to generate an anomaly time series. A linear regression was performed on anomalies where the slope represents the rate of anthropogenic CO2increase in the atmosphere. Finally, to help identify different processes that might have contributed to the observed trends, linear regressions were performed on changes in AT andCT per month (mean value of observa-tions within 1 month) from 2009 through 2015 and on the salinity–ATrelationship by year.
2.4 SeaFET data collection, processing, and analysis
To capture pH variability at higher-than-weekly sampling frequencies, a SeaFET™ Ocean pH sensor (Satlantic) was deployed on the EOL buoy (435 m from the Point B sam-pling site) starting in June 2014, at 2 m depth. Autonomous sampling was hourly and deployment periods averaged 58±25 days with 5±2 calibration samples per deployment.
Field calibration samples for pH were collected using a Niskin bottle next to SeaFET within 15 min of measurement. This sampling scheme was sufficient for this site as there is no large high-frequency pH variability. Unlike Point B sampling, SeaFET calibration samples were processed for pH using the spectrophotometric method (Dickson et al., 2007) with purified m-cresol purple (purchased from Robert H. Byrne’s laboratory, University of South Florida). In situ temperature, salinity, and AT measured at Point B, within 30 min of the SeaFET sampling, were used to calculate in situ pHTof the calibration samples.
SeaFET voltage was converted to pHTusing the respective calibration samples for each deployment period, following the methods and code described in Bresnahan et al. (2014) but adapted for use in R. Only 5 % of the data was removed during quality control, due to biofouling in one deployment and battery exhaustion in another, yielding 610 days of data. The mean offset between calibration samples and the cali-brated SeaFET pH time series was±0.007, indicating a high-quality pH dataset (data shown in Fig. 7c).
The estimated standard uncertainty in SeaFET pHT is
(a)
15 20 25
Temp
. (°C)
*
(h)−5.0 −2.5 0.0 2.5
Temp
. (°C)
(b)
36 37 38
Salinity
(i)
−2.0 −1.0 0.0 0.5
Salinity
(c)
2500 2525 2550 2575
AT
(
µ
mol
kg
−
1)
*
(j)−50 −25 0 25
AT
(
µ
mol
kg
−
1)
(d)
2200 2225 2250 2275
CT
(
µ
mol
kg
−
1)
*
(k)−50 −25 0 25 50
CT
(
µ
mol
kg
−
1)
(e)
7.95 8.00 8.05 8.10 8.15
pHT
*
(l)−0.08 −0.04 0.00 0.04
pHT
(f)
300 400 500
pC
O2
(
µ
atm)
*
(m)−50 0 50 100
pC
O2
(
µ
atm)
(g)
3.0 3.2 3.4 3.6 3.8
2008 2010 2012 2014 2016
Ωa
*
(n)−0.2 0.0 0.2
2008 2010 2012 2014 2016
Ωa
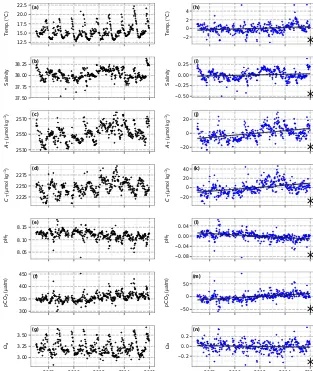
Figure 2.Time series observations(a–g)and anomaly trends(h–n)for temperature, salinity, and seawater carbonate chemistry at Point B,
1 m. Regression slopes are drawn±SE (standard error, in grey) and noted with a star for significance atα=0.05. Variable abbreviations are the same as in Table 2.
collected between 16 July 2014 and 3 May 2016), spatiotem-poral mismatch sampling at EOL (±0.007, mean offset of pHTof the calibration samples from calibrated time series), and variability in purified m-cresol dye batch accuracy com-pared to tris buffer CRM pH (±0.006, mean offset of pHTof the spectrophotometric measurement of tris buffer from the CRM value).
3 Results
3.1 Time series trends
At Point B from January 2007 to December 2015, more than 400 samples were collected for carbonate chemistry at both 1 and 50 m. Anomaly trends detected at 1 m (Fig. 2) were also significant at 50 m (Fig. 3, Table 2), with the exception that salinity only increased at 50 m (0.0063±0.0020 units yr−1). At 1 m, trends were significant for pHT(−0.0028 units yr−1),
AT(2.08 µmol kg−1yr−1),CT(2.97 µmol kg−1yr−1),pCO2 (3.53 µatm yr−1), and a (−0.0064 units yr−1). At the same time, temperature anomaly increased (0.072◦C yr−1). Changes in carbonate chemistry parameters were greater at 1 compared to 50 m, with the exception of salinity and tem-perature. The warming rate at 50 m was slightly greater com-pared to 1 m, mostly due to increasing summer temperatures since 2007. Time series data are available online (Gattuso et al., 2014).
co-inciding with the period of peak primary productivity (De Carlo et al., 2013), warming countered the influence of low
CTon pH. As a result, pHTreached minimum values in sum-mer (8.02±0.03, July and August) and peaked in late winter (8.14±0.01, February and March), for an overall annual pH range of 0.12. The correspondingpCO2range was 128 µatm from February to August. Seasonal cycles were smaller at 50 compared to 1 m (Table S1).
3.2 Deconvolution of pHTandpCO2
Deconvolutions of pH and pCO2 are presented in Ta-bles 3 and 4, respectively. The estimated anomaly trends
dpH
T
dt ,
dpCO2
dt
from the deconvolution fall within the er-ror of the observed anomaly trends (Table 2). The contribu-tion of warming to the pHTanomaly (−0.0011 units yr−1, at 1 m) matched the difference between the trends of pHTand pHT25C(Table 2), which verifies that the deconvolution re-produced influences of temperature sensitivity well. Overall, these results indicate that the deconvolution analyses repre-sent the observed trends well.
At both depths, the predominant driver of dpHT
dt and
dpCO2
dt
was the increase inCT. IncreasingATcountered 66–69 and 60 % of the influence of increasingCT on dpHdtT and dpdCOt 2, respectively. At 1 m, warming accounted for 41 and 37 % of
dpHT
dt and
dpCO2
dt , respectively. Since warming was slightly
greater at 50 compared to 1 m, warming accounted for a larger proportional influence on dpHT
dt and
dpCO2
dt at 50
com-pared to 1 m. Increasing salinity at 50 m contributed slightly to dpHT
dt (4 %) and
dpCO2
dt (2 %).
The atmospheric CO2anomaly at Plateau Rosa increased by 2.08±0.01 ppm yr−1 (F1,3285=4664, P 0.001, R2 0.93) during the study period 2007–2015, and represents the anthropogenic CO2forcing on seawater pH. To estimate the influence of anthropogenic CO2forcing at Point B, we as-sume air–sea CO2 equilibrium (e.g., an increase in atmo-spheric CO2 causes an equal increase in seawaterpCO2) for the water mass at 1 m. This assumption is based on ev-idence that Point B is a weak sink for atmospheric CO2with near-balanced air–sea CO2flux on an annual time frame (De Carlo et al., 2013). Considering the error associated with de-convolution ofpCO2 at 1 m, the atmospheric CO2increase can, at most, represent 38–43 % of the totalCTcontribution
∂pCO2
∂CT
dCT
dt
to dpCO2
dt . This leaves 57–62 % of the totalCT
contribution topCO2trends unaccounted for.
AsATis not influenced by addition of anthropogenic CO2 to seawater, but it did increase, the next question was whether or not the changes in AT and CT were process-linked. At 1 m, regressions of annual monthly trends ofATandCT re-vealed similar seasonal cycles for both parameters (Fig. 5, Table S2). The fastest increases inATandCToccurred from May through July. The smallest (non-significant) changes oc-curred in January. The synchronicity between monthly trends
ofATandCTwas also observed at 50 m, but the rates were slower (analysis not shown).
3.3 Salinity andATrelationships
Over an annual observation period at 1 m, salinity was a poor predictor ofAT, with the exception of 2007 (Fig. 6). TheR2value for each annual salinity–ATrelationship at 1 m ranged from 0.00 (in 2013) to 0.87 (in 2007) withyintercepts (AT0, total alkalinity of the freshwater end-member) rang-ing between−176 µmol kg−1(in 2007) and 2586 µmol kg−1 (in 2013). The interannual variability of the salinity–AT re-lationship was driven by the variability inAT observed at salinity < 38.0 that was present from November through July. Changes in salinity (based on monthly means) at Point B were small and ranged from 37.64±0.26 to 38.21±0.11 from May to September, following freshwater input in win-ter and spring and evaporation throughout summer and fall (Fig. 4). The highest (> 38.0) and most stable salin-ity observations were made in August through October and coincided with the period of maximum AT (2562 and 2561±9 µmol kg−1 in September and October, respec-tively). MinimumAT (2543±14 µmol kg−1)was observed in June, 1 month after minimum salinity. To capture this sea-sonality without the interannual variation ofAT, the salinity– AT relationship at 1 m was estimated from climatological monthly means (cATand cS,N=12) where cAT units are measured in micromoles per kilogram (µmol kg−1) and error terms are standard errors (R2=0.74):
cAT=1554.9(±185.9)+26.3(±4.9)×cS. (2) At 50 m, monthly salinity andAT were less correlated over an annual cycle (analysis not shown). Salinity remained sta-ble at 38.0 from January through September whileAT de-clined by 13 µmol kg−1. In general, seasonal changes were dampened at 50 compared to 1 m.
3.4 High-frequency pH data
Table 3. Deconvolution of pHTanomalies
dpH
T
dt ,units pHTyr−1
at 1 and 50 m. Sensitivity of pHTwith respect to variables
∂pHT ∂var
, where the variable var is either temperature (T), salinity (S), total alkalinity (AT), or dissolved inorganic carbon (CT), was multiplied by the anomaly of vardvardt ,Table 2. SE is standard error and RMSE is root mean square error. Rounding was performed at the end of the calculations, prior to the estimation of the percentage of contributions.
Depth (m) var ∂pHT
∂var±SE
∂pHT ∂var
dvar
dt ±RMSE Contribution (%)
dpHT
dt ±RMSE
1 T (◦C) −0.0153±< 0.0001 −0.0011±0.0003 41 −0.0027±0.0005 S −0.0117±< 0.0001 < 0.0001±0.0001 0
AT(µmol kg−1) 0.0015±< 0.0001 0.0031±0.0003 −115 CT(µmol kg−1) −0.0016±< 0.0001 −0.0047±0.0003 174
50 T (◦C) −0.0154±< 0.0001 −0.0014±0.0003 54 −0.0026±0.0005 S −0.0116±< 0.0001 −0.0001±< 0.0001 4
AT(µmol kg−1) 0.0015±< 0.0001 0.0024±0.0002 −92 CT(µmol kg−1) −0.0016±<0.0001 −0.0035±0.0003 135
Table 4.Deconvolution ofpCO2anomalies
d
pCO2
dt ,µatm yr
−1at 1 and 50 m. Details are the same as in Table 3.
Depth (m) var ∂pCO2
∂var ±SE
∂pCO2 ∂var
dvar
dt ±RMSE Contribution (%)
dpCO2
dt ±RMSE
1 T (◦C) 16.49±0.05 1.19±0.36 37 3.23±0.57 S 10.14±< 0.01 −0.02±0.05 −1
AT(µmol kg−1) −1.478±0.005 −3.08±0.28 −95 CT(µmol kg−1) 1.735±0.006 5.14±0.35 159
50 T (◦C) 15.55±0.03 1.37±0.29 48 2.84±0.49 S 9.355±< 0.001 0.06±0.02 2
AT(µmol kg−1) −1.327±0.002 −2.11±0.20 −74 CT(µmol kg−1) 1.629±0.005 3.52±0.34 124
4 Discussion
High-resolution time series are necessary to document coastal ocean acidification. Based on weekly measure-ments from 2007 through 2015, near-surface pHT de-creased by 0.0028±0.0003 units yr−1 at Point B in the NW coastal Mediterranean Sea. Temperature increased by 0.072±0.022◦C yr−1. In addition, AT increased by 2.08±0.19 µmol kg−1yr−1, a change that is unrelated to di-rect effects of CO2 absorption by seawater. In less than a decade, the total change in pH at Point B (1pHT: 0.0252, Table 1) was of the same magnitude as the diel pH variabil-ity (1pHT: 0.01–0.05) and one-fifth of the magnitude of the seasonal pH cycle (1pHT: 0.12) found at this site.
We can identify the drivers of ocean acidification at Point B using the deconvolution of pH andpCO2trends and by assuming that the increase in AT was due to increases in its carbon constituents, bicarbonate (HCO−3)and carbon-ate (CO23−)ions. This assumption is based on the fact that (1) HCO−3 and CO23− ions together make up 96 % of AT at Point B, (2) increases in both HCO−3 and CO23− would contribute to AT andCT and thereby explain the observed synchronicity of monthly trends inATandCT(Fig. 5).
Us-ing the pCO2 deconvolution, we can then sum the contri-butions topCO2fromAT(−3.08 µatmpCO2yr−1)andCT (5.14 µatmpCO2yr−1)to determine the proportional contri-bution of1CTto1pCO2that is unrelated to changes inCT brought on byAT. This remaining 2.06 µatmpCO2yr−1 in-crease due to increasingCTclosely matched the magnitude of atmospheric CO2increase during the observation period (2.08±0.01 ppm yr−1at Plateau Rosa, Italy). The closeness of these numbers does not imply causation. However, given that surface waters at Point B exhibit a near-zero air–sea CO2 flux over annual cycles (De Carlo et al., 2013), the evidence supports the conclusion that the ocean acidification trend at Point B closely follows the rate of atmospheric CO2increase. The influence of atmospheric CO2can also be observed in the monthly changes in CT. Monthly CT trends are posi-tive and statistically significant over more months thanAT trends (8 vs. 3 months), which are more seasonally restricted (Fig. 5).
(a)
12.5 15.0 17.5 20.0 22.5
Temp
. (°C)
*
(h)
−2 0 2 4
Temp
. (°C)
(b)
37.50 37.75 38.00 38.25
Salinity
*
(i)
−0.50 −0.25 0.00 0.25
Salinity
(c)
2530 2550 2570
AT
(
µ
mol
kg
−
1)
*
(j)
−20 0 20
AT
(
µ
mol
kg
−
1)
(d)
2225 2250 2275
CT
(
µ
mol
kg
−
1)
*
(k)
−20 0 20 40
CT
(
µ
mol
kg
−
1)
(e)
8.05 8.10 8.15
pHT
*
(l)
−0.08 −0.04 0.00 0.04
pHT
(f)
300 350 400 450
pC
O2
(
µ
atm)
*
(m)
−50 0 50
pC
O2
(
µ
atm)
(g)
3.00 3.25 3.50
2008 2010 2012 2014 2016
Ωa
*
(n)
−0.2 0.0 0.2
2008 2010 2012 2014 2016
Ωa
Figure 3.Time series observations(a–g)and anomaly trends(h–n)for temperature, salinity, and seawater carbonate chemistry at Point B,
50 m. Regression slopes are drawn±SE (standard error, in grey) and noted with a star for significance atα=0.05. Variable abbreviations are the same as in Table 2.
Using this same approach for observations at 50 m, theCT contribution topCO2trends that was unrelated toATchange was 1.41 µatmpCO2yr−1, which is 68 % of the rate of at-mospheric CO2increase, in contrast to 99 % at 1 m. Changes in pHT can then be attributed to atmospheric CO2 forcing (42 %), warming (54 %), and increasing salinity (3 %). Due to slightly enhanced warming and reduced CO2penetration observed at 50 m, warming had a greater effect on the ocean acidification trend than atmospheric CO2 forcing at depth compared to the surface.
The acidification rate at Point B (−0.0028 units pHTyr−1) is larger than those reported for other ocean time se-ries sites (−0.0026 to −0.0013 units pH yr−1, Bates et al., 2014), likely due to differences in warming rates. The observed warming from 2007 through 2015 (0.72 to 0.88±0.2◦C decade−1) is extremely rapid relative to global trends in the upper 75 m from 1971 to 2010 (0.11◦C decade−1, Rhein et al., 2013). The coastal region of
Point B has warmed steadily since 1980 and with periods of rapid warming (Parravicini et al., 2015). Exacerbated warm-ing may be related to the positive phases of the Atlantic Mul-tidecadal Oscillation (AMO) and North Atlantic Oscillation (NAO), both of which are associated with episodic warming of the Mediterranean Sea (Lejeusne et al., 2010). The AMO has been positive since the 1990s1and positive NAO phases were prevalent during the second half of our study2.
Nearest to Point B, the acidification rate at DYFAMED, an open-sea site about 50 km offshore from Point B (Fig. 1), was estimated at−0.003±0.001 units pHSWyr−1from 1995 to 2011 (Marcellin Yao et al., 2016). At DYFAMED, warm-ing contributed approximately 30 % to the acidification rate and the remaining 70 % was attributed to anthropogenic CO2 (Marcellin Yao et al., 2016). While the uncertainty for
(a)
10 15 20 25 30
T (°C)
(b)
36 37 38 39
Salinity
(c)
2500 2525 2550 2575
AT
(
µ
mol
kg
−
1)
(d)
2200 2225 2250 2275
CT
(
µ
mol
kg
−
1)
(e)
7.95 8.00 8.05 8.10 8.15
pH
T
(f)
300 400 500
pC
O2
(
µ
atm)
(g)
3.0 3.2 3.4 3.6 3.8
Jan Mar May Jul Sep Nov
Ωa
Figure 4.Monthly distribution of seawater carbonate chemistry at
Point B, 1 m, using a combination of a violin plot showing the rela-tive frequency of the observations (shaded blue area) and a box plot showing the median, first, and third quartiles, as well as outliers (blue).
FAMED pH data is large, the trends are comparable to those observed at Point B. However,ATat the DYFAMED did not change significantly from 2007 through 2014 (F1,51= 3.204, P =0.0794,R20.08; data from Coppola et al., 2016). This probably indicates that the processes driving changes inAT at Point B are unique to the coastal environment.
* * *
* * *
* *
*
*
*
−2.5 0.0 2.5 5.0 7.5
Jan Feb Mar Apr May Jun Jul Aug Sep Oct Nov Dec
Monthly change (
µ
mol
kg
−
1 y
r
−
1)
AT
CT
Figure 5.Monthly trends of total alkalinity (AT, blue) and
dis-solved inorganic carbon (CT, green) for the period 2007–2015. Er-rors bars are±SE of the slope estimate and significance is noted (∗) atα=0.05.
January February March
April May June
July August September
October November December
2007 (a)
2500 2525 2550 2575 2600
AT
(
µ
mol
kg
−
1)
2008 (b)
2009 (c)
2010 (d)
2500 2525 2550 2575 2600
AT
(
µ
mol
kg
−
1)
2011 (e)
2012 (f)
2013 (g)
2500 2525 2550 2575 2600
37.0 37.5 38.0 38.5 Salinity
AT
(
µ
mol
kg
−
1)
2014 (h)
37.0 37.5 38.0 38.5 Salinity
2015 (i)
37.0 37.5 38.0 38.5 Salinity
Figure 6.Salinity and total alkalinity (AT)relationships at Point B
for the period 2007–2015, by year, at 1 m. Data points are colored by month.
Similar changes in coastal carbonate chemistry were ob-served elsewhere in the near-shore Mediterranean Sea. In the northern Adriatic Sea, Luchetta et al. (2010) determined an acidification rate of−0.0025 units pHTyr−1and an increase inATof 2.98 µmol kg−1yr−1at depths shallower than 75 m, by comparing cruise data between the winters of 1983 and 2008. Point B and Adriatic Sea observations are independent but reflect changes in seawater chemistry that may be occur-ring in more coastal regions of the Mediterranean. Additional time series would help resolve the spatial extent of these ob-servations.
(a)
8.00 8.05 8.10 8.15
Sep 2014 Jan 2015 May 2015 Sep 2015 Jan 2016 May 2016
pH
T
(b)
15 20 25
Sep 2014 Jan 2015 May 2015 Sep 2015 Jan 2016 May 2016
Temper
ature (°C)
(c)
−0.02 0.00 0.02
Oct 2014 Feb 2015 Jun 2015 Oct 2015 Feb 2016
pH
T
diff
erence
(d)
0.00 0.05 0.10
Jan Feb Mar Apr May Jun Jul Aug Sep Oct Nov Dec
pH
T
r
ange
(e)
8.09 8.10 8.11 8.12
01 May 02 May 03 May 04 May 05 May
pH
T
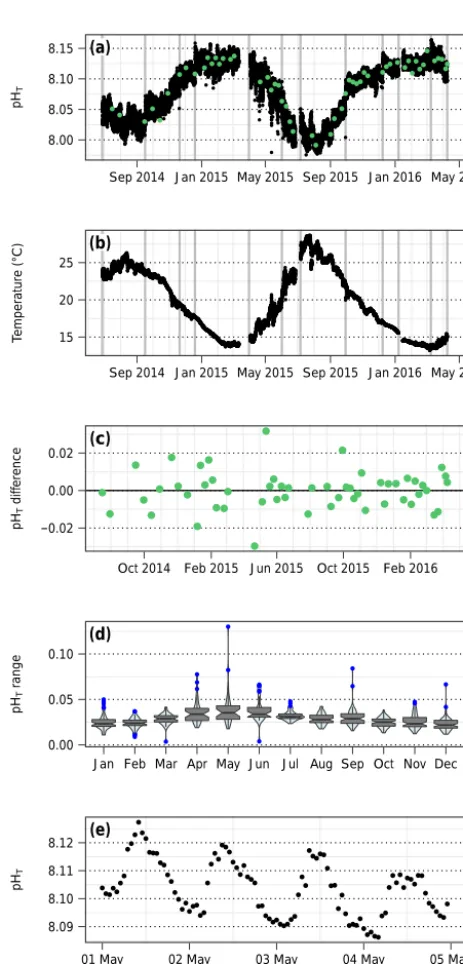
Figure 7.Time series pHT(a)and temperature(b)from SeaFET
pH sensor deployments at EOL, 2 m. Discrete calibration samples are noted in green, and grey vertical lines bracket deployment pe-riods(a). Calibration sample offsets from processed pH time series are shown in (c). Violin and box plots (see Fig. 4) show diel pH range by month(d), and an example of this pH variability is shown for May 2015(e).
increases in AT and CT occurred from May through July (Fig. 5), when the thermal stratification settled. In the NW Mediterranean, the main processes governing seasonal vari-ability in AT are evaporation, which increases AT, in sum-mer (i.e., June through September at Point B) and, to a lesser extent, phytoplankton uptake of nitrate (NO−3) and phosphate (PO34−), which increaseATfrom January through
March (Cossarini et al., 2015). During the transition of these processes, salinity decreases to a minimum in May, reflect-ing freshwater input that dilutesAT to minimum values at the start of summer. For CT, peak values occur in winter when the water column is fully mixed. For reference, at DY-FAMED, mixing occurs down to more than 2000 m depth andCTis up to 100 µmol kg−1higher in deep waters (Copin-Montégut and Bégovic, 2002). Notably, monthly trends of
CTat Point B were not statistically significant from Novem-ber through January for the period 2007–2015. Following winter, CT declines due to a combination of phytoplank-ton bloom carbon uptake and freshwater dilution (assuming river CT< seawater CT), until the onset of summer strati-fication. Summer warming leads topCO2 outgassing (De Carlo et al., 2013), thereby further decreasingCT. In addi-tion, the increases inAT andCT from 2007 through 2015 were more pronounced at 1 compared to 50 m. Thus, the pro-cesses drivingAT andCT trends are stronger at the surface and affect carbonate chemistry primarily during the spring– summer transition from May through July.
Identifying the processes causing an increase inAT and CTbeyond what can be attributed to changes in atmospheric CO2 requires some speculation. Some biogeochemical pro-cesses can be ruled out as drivers. For example, changes in benthic processes are very unlikely. Reduced calcium car-bonate (CaCO3)precipitation rates would increase AT but would increaseCT. Even so, the dominant ecosystem in the Bay of Villefranche-sur-Mer is seagrass meadows, which harbor relatively few calcifying organisms. Dissolution of calcium carbonate sediment would contribute toATandCT increase in the water column. However, as the water was su-persaturated with respect to both aragonite and calcite, this could only be mediated by biological processes. Carbonate dissolution following CO2 production via oxic degradation of organic matter releasesATandCTin a 1 : 1 ratio (Moulin et al., 1985). Likewise, anaerobic remineralization produces alkalinity (Cai et al., 2011). In the sediment of the Bay of Villefranche, sulfate reduction coupled with precipitation of sulfide minerals is the dominant anoxic mineralization path-way (Gaillard et al., 1989). An increase in these processes would explain the observed increase inAT andCT, but as trends were slower at 50 compared to 1 m, this would suggest the dominance of a process taking place in surface waters.
In the upper water column at Point B, changes in biolog-ical processes are unlikely to explain the observed trends in
ATandCT. For example, the concentration of chlorophylla (a proxy of primary production) has decreased since 1995, nutrients have increased, and phytoplankton blooms have shifted towards earlier dates in the year (Irisson et al., 2012). While a decrease in net primary production could driveCT trends, the observed increase in NO−3 and PO34−would cause a small decrease inAT(Wolf-Gladrow et al., 2007). Stimu-lated community respiration could result from warming wa-ters but enhanced remineralization would cause a decrease in
The lack of salinity change at the surface excludes ad-ditional processes as drivers of the AT and CT increase at Point B. For example, increased summertime evapora-tion (concentraevapora-tion effect) and reduced freshwater input (de-creased dilution effect) would both be expected to cause an increase in salinity, which was not observed. Increased input of eastern Mediterranean Sea waters could increaseAT, but this is unlikely as this water mass flows much deeper than Point B (Millot and Taupier-Letage, 2005).
Instead, the observed changes inATandCTcould be due to increased limestone weathering, which would increase the input of AT from land to the sea via rivers and groundwa-ter. Rivers contribute bothAT andCTto the Mediterranean Sea (Copin-Montégut, 1993; Tamše et al., 2015). RiverAT originates from erosion and is correlated with bedrock com-position (e.g., McGrath et al., 2016). Positive trends in river
AT have been documented in North America and occur via a number of processes including (1) the interplay of rainfall and land use (Raymond and Cole, 2003), (2) anthropogenic limestone addition used to enhance agricultural soil pH (Oh and Raymond, 2006; Stets et al., 2014) and freshwater pH (Clair and Hindar, 2005), and (3) potentially indirect effects of anthropogenic CO2on groundwater CO2acidification and weathering (Macpherson et al., 2008). These and other pro-cesses were hypothesized to have drivenATchanges in the Baltic Sea (Müller et al., 2016). There, an increase inATof 3.4 µmol kg−1yr−1was observed from 1995 to 2014 (mean salinity=7). In contrast to Point B, the increase in Baltic Sea
ATwas not noticeable at salinity > 30 (Müller et al., 2016). Given the above speculations, the simplest plausible mech-anisms causing the unexpected AT and CT trends would be through increasingAT of the freshwater end-member of Point B. Local precipitation, however, did not have an in-fluential effect and was not correlated with salinity or AT (Fig. S1 in the Supplement). While submarine groundwater springs can be a significant source of nutrients,AT, andCT for the ocean (Cai et al., 2003; Slomp and Van Cappellen, 2004), carbonate chemistry contributions of local submarine springs are currently unknown (Gilli, 1995). Signatures of limestone erosion can be observed in AT of nearby rivers (Var, Paillon, and Roya) but detailed time series are not available. Likewise, riverine influence at Point B has not been quantified. If river runoff exerts a dominant control on Point B carbonate chemistry, there is a lag effect, as freshwa-ter influence peaked in May butATandCTincreased fastest from May through July. Consequently, this hypothesis needs further investigation. Until the source ofATincrease is prop-erly identified, use of this observation in modeling should be implemented with caution.
5 Conclusion
Predictions of coastal ocean acidification remain challenging due the complexity of biogeochemical processes occurring
at the ocean–land boundary. At the Point B coastal oceano-graphic station in the NW Mediterranean Sea, surface ocean acidification was due to atmospheric CO2forcing and rapid warming over the observation period 2007–2015. However, additional trends inAT andCT were observed and remain unexplained, but these trends could relate to riverine and groundwater input. The influence of coastal boundary pro-cesses influencing seawater AT and CT presents a poten-tially major difference between coastal and offshore changes in ocean chemistry. This study highlights the importance of considering other anthropogenic influences in the greater land–sea region that may contribute to coastal biogeochemi-cal cycles (sensu Duarte et al., 2013) and alter projections of anthropogenic change in near-shore waters.
Data availability. Time series data from Point B are available at PANGAEA®(doi:10.1594/PANGAEA.727120)
The Supplement related to this article is available online at doi:10.5194/os-13-411-2017-supplement.
Author contributions. Jean-Pierre Gattuso initiated the study, Laure Mousseau supervised data collection, Samir Alliouane performed SeaFET deployments and calibration, Jean-Pierre Gattuso and Ly-dia Kapsenberg designed and Jean-Pierre Gattuso conducted statis-tical analyses, and Lydia Kapsenberg prepared the paper with con-tributions from all authors.
Competing interests. The authors declare that they have no conflict of interest.
Ocean Acidification (EPOCA; contract no. 211384) and the Med-SeA project (contract no. 265103), which received funding from the European Community’s Seventh Framework Programme, and to the United States National Science Foundation Ocean Sciences Postdoctoral Research Fellowship (OCE-1521597), awarded to LK.
Edited by: M. Hoppema
Reviewed by: two anonymous referees
References
Álvarez, M., Sanleón-Bartolomé, H., Tanhua, T., Mintrop, L., Luchetta, A., Cantoni, C., Schroeder, K., and Civitarese, G.: The CO2system in the Mediterranean Sea: a basin wide perspective, Ocean Sci., 10, 69–92, doi:10.5194/os-10-69-2014, 2014. Aminot, A. and Kérouel, R.: Dosage automatique des nutriments
dans les eaux marines: méthodes d’analyse en milieu marin, edited by: Aminot, A. and Kérouel, R., Ifremer, 188 pp., 2007. Barbier, E. B., Hacker, S. D., Kennedy, C., Koch, E. W., Stier, A. C.,
and Silliman, B. R.: The value of estuarine and coastal ecosystem services, Ecol. Monogr., 81, 169–193, doi:10.1890/10-1510.1, 2011.
Bates, N. R., Astor, Y. M., Church, M. J., Currie, K., Dore, J. E., González-Dávila, M., Lorenzoni, L., Muller-Karger, F., Olafs-son, J., and Santana-Casiano, J. M.: A time-series view of chang-ing ocean chemistry due to ocean uptake of anthropogenic CO2 and ocean acidification, Oceanography, 27, 126–141, 2014. Borges, A. V. and Gypens, N.: Carbonate chemistry in
the coastal zone responds more strongly to eutrophication than ocean acidification, Limnol. Oceanogr., 55, 346–353, doi:10.4319/lo.2010.55.1.0346, 2010.
Bresnahan, P. J., Martz, T. R., Takeshita, Y., Johnson, K. S., and LaShomb, M.: Best practices for autonomous measurement of seawater pH with the Honeywell Durafet, Methods Oceangr., 9, 44–60, 2014.
Cai, W.-J., Wang, Y., Krest, J., and Moore, W. S.: The geochem-istry of dissolved inorganic carbon in a surficial groundwater aquifer in North Inlet, South Carolina, and the carbon fluxes to the coastal ocean, Geochim. Cosmochim. Ac., 67, 631–639, doi:10.1016/S0016-7037(02)01167-5, 2003.
Cai, W.-J., Hu, X., Huang, W.-J., Murrell, M. C., Lehrter, J. C., Lohrenz, S. E., Chou, W.-C., Zhai, W., Hollibaugh, J. T., Wang, Y., Zhao, P., Guo, X., Gundersen, K., Dai, M., and Gong, G.-C.: Acidification of subsurface coastal waters enhanced by eutroph-ication, Nat. Geosci., 4, 766–770, doi:10.1038/ngeo1297, 2011. Clair, T. A. and Hindar, A.: Liming for the mitigation of acid rain
effects in freshwaters: a review of recent results, Environ. Rev., 13, 91–128, doi:10.1139/a05-009, 2005.
Copin-Montégut, C.: Alkalinity and carbon budgets in the Mediterranean Sea, Global Biogeochem. Cy., 7, 915–925, doi:10.1029/93GB01826, 1993.
Copin-Montégut, C. and Bégovic, M.: Distributions of carbonate properties and oxygen along the water column (0–2000 m) in the central part of the NW Mediterranean Sea (Dyfamed site): influ-ence of winter vertical mixing on air–sea CO2and O2exchanges, Deep-Sea Res. Pt. II, 49, 2049–2066, doi:10.1016/S0967-0645(02)00027-9, 2002.
Coppola, L., Diamond Riquier, E., and Carval, T.: Dyfamed obser-vatory data, SEANOE, doi:10.17882/43749, 2016.
Cossarini, G., Lazzari, P., and Solidoro, C.: Spatiotemporal vari-ability of alkalinity in the Mediterranean Sea, Biogeosciences, 12, 1647–1658, doi:10.5194/bg-12-1647-2015, 2015.
Costanza, R., d’Arge, R., de Groot, R., Farber, S., Grasso, M., Han-non, B., Limburg, K., Naeem, S., O’Neill, R. V., Paruelo, J., Raskin, R. G., Sutton, P., and van den Belt, M.: The value of the world’s ecosystem services and natural capital, Nature, 387, 253–260, 1997.
De Carlo, E. H., Mousseau, L., Passafiume, O., Drupp, P. S., and Gattuso, J.-P.: Carbonate chemistry and air–sea CO2flux in a NW Mediterranean bay over a four-year period: 2007–2011, Aquat. Geochem., 19, 399–442, doi:10.1007/s10498-013-9217-4, 2013.
Dickson, A.: The carbon dioxide system in seawater: equilibrium chemistry and measurements, in: Guide to best practices for ocean acidification research and data reporting, edited by: Fabry, V. J., Hansson, L., and Gattuso, J.-P., Publications Office of the European Union, Luxembourg, 17–40, 2010.
Dickson, A. G.: Standard potential of the reaction: AgCl(s)+1/2 H2(g)=Ag(s)+HCl(aq), and the standard acidity constant of the ion HSO−4 in synthetic sea water from 273.15 to 318.15 K, J. Chem. Thermodyn., 22, 113–127, doi:10.1016/0021-9614(90)90074-Z, 1990.
Dickson, A. G. and Riley, J. P.: The effect of analytical error on the evaluation of the components of the aquatic carbon-dioxide sys-tem, Mar. Chem., 6, 77–85, doi:10.1016/0304-4203(78)90008-7, 1978.
Dickson, A. G., Sabine, C. L., and Christian, J. R.: Guide to best practices for ocean CO2measurements, PICES Special Publica-tion, 3, 191 pp., 2007.
DOE: Handbook of methods for the analysis of the various param-eters of the carbon dioxide system in sea water, Carbon Dioxide Information Analysis Center, Oak Ridge National Laboratory, 1994.
Doney, S. C., Fabry, V. J., Feely, R. A., and Kleypas, J. A.: Ocean acidification: the other CO2problem, Annu. Rev. Mar. Sci., 1, 169–192, doi:10.1146/annurev.marine.010908.163834, 2009. Duarte, C. M., Hendriks, I. E., Moore, T. S., Olsen, Y. S.,
Steck-bauer, A., Ramajo, L., Carstensen, J., Trotter, J. A., and McCul-loch, M.: Is ocean acidification an open-ocean syndrome? Under-standing anthropogenic impacts on seawater pH, Estuar. Coast., 36, 221–236, doi:10.1007/s12237-013-9594-3, 2013.
Edmond, J. M.: High precision determination of titration alkalin-ity and total carbon dioxide content of sea water by potentio-metric titration, Deep-Sea Res., 17, 737–750, doi:10.1016/0011-7471(70)90038-0, 1970.
Feely, R. A., Sabine, C. L., Hernandez-Ayon, J. M., Ianson, D., and Hales, B.: Evidence for upwelling of corrosive “acidi-fied” water onto the continental shelf, Science, 320, 1490–1492, doi:10.1126/science.1155676, 2008.
Feely, R. A., Alin, S. R., Newton, J., Sabine, C. L., Warner, M., Devol, A., Krembs, C., and Maloy, C.: The combined effects of ocean acidification, mixing, and respiration on pH and carbonate saturation in an urbanized estuary, Estuar. Coast. Shelf S., 88, 442–449, doi:10.1016/j.ecss.2010.05.004, 2010.
Mediter-ranean Sea through high frequency observational data: indica-tion of ocean acidificaindica-tion in the basin, Sci. Rep., 5, 16770, doi:10.1038/srep16770, 2015.
Gaillard, J.-F., Pauwels, H., and Michard, G.: Chemical diagenesis in coastal marine sediments, Oceanol. Acta, 12, 175–187, 1989. García-Ibáñez, M. I., Zunino, P., Fröb, F., Carracedo, L. I., Ríos, A. F., Mercier, H., Olsen, A., and Pérez, F. F.: Ocean acidification in the subpolar North Atlantic: rates and mechanisms controlling pH changes, Biogeosciences, 13, 3701–3715, doi:10.5194/bg-13-3701-2016, 2016.
Gattuso, J. P. and Hansson, L.: Ocean acidification, Oxford Univer-sity Press, Oxford, 2011.
Gattuso, J.-P., Epitalon, J.-M., and Lavigne, H.: seacarb: Seawa-ter Carbonate Chemistry. R package version 3.1.1 https://cran. r-project.org/package=seacarb (last access: 3 April 2017), 2016. Gattuso, J.-P., Alliouane, S., and Mousseau, L.: Seawater carbonate chemistry in the Bay of Villefranche, Point B (France), January 2007 – December 2015, doi:10.1594/PANGAEA.727120, 2014. Gilli, E.: Etude des sources karstiques sous-marines et lit-torales des Alpes Maritimes entre Menton et Nice, 41, http: //www.side.developpement-durable.gouv.fr/EXPLOITATION/ DEFAULT/doc/IFD/I_IFD_REFDOC_0113893 (last access: 12 May 2017), 1995.
Halpern, B. S., Walbridge, S., Selkoe, K. A., Kappel, C. V., Micheli, F., D’Agrosa, C., Bruno, J. F., Casey, K. S., Ebert, C., and Fox, H. E.: A global map of human impact on marine ecosystems, Science, 319, 948–952, 2008.
Hofmann, G. E., Smith, J. E., Johnson, K. S., Send, U., Levin, L. A., Micheli, F., Paytan, A., Price, N. N., Peterson, B., Takeshita, Y., Matson, P. G., Crook, E. D., Kroeker, K. J., Gambi, M. C., Rivest, E. B., Frieder, C. A., Yu, P. C., and Martz, T. R.: High-frequency dynamics of ocean pH: a multi-ecosystem compari-son, PLoS One, 6, e28983, doi:10.1371/journal.pone.0028983, 2011.
Howes, E. L., Stemmann, L., Assailly, C., Irisson, J. O., Dima, M., Bijma, J., and Gattuso, J. P.: Pteropod time series from the North Western Mediterranean (1967–2003): impacts of pH and climate variability, Mar. Ecol.-Prog. Ser., 531, 193–206, 2015.
Ingrosso, G., Giani, M., Comici, C., Kralj, M., Piacentino, S., De Vittor, C., and Del Negro, P.: Drivers of the carbonate system seasonal variations in a Mediterranean gulf, Estuar. Coast. Shelf S., 168, 58–70, doi:10.1016/j.ecss.2015.11.001, 2016.
Irisson, J.-O., Webb, A., Passafiume, O., and Mousseau, L.: Detect-ing hydrologic variations in a long term monitorDetect-ing time series, Europole Mer Gordon-like conference “Time-series analysis in marine science and application for industry”, Brest, France, 17– 21 September 2012.
Jiang, Z.-P., Tyrrell, T., Hydes, D. J., Dai, M., and Hartman, S. E.: Variability of alkalinity and the alkalinity-salinity relationship in the tropical and subtropical surface ocean, Global Biogeochem. Cy., 28, 729–742, doi:10.1002/2013GB004678, 2014.
Kapsenberg, L. and Hofmann, G. E.: Ocean pH time-series and drivers of variability along the northern Channel Is-lands, California, USA, Limnol. Oceanogr., 61, 953–968, doi:10.1002/lno.10264, 2016.
Kapsenberg, L., Kelley, A. L., Shaw, E. C., Martz, T. R., and Hof-mann, G. E.: Near-shore Antarctic pH variability has implica-tions for biological adaptation to ocean acidification, Sci. Rep., 5, 9638, doi:10.1038/srep09638, 2015.
Krasakopoulou, E., Souvermezoglou, E., and Goyet, C.: An-thropogenic CO2 fluxes in the Otranto Strait (E. Mediter-ranean) in February 1995, Deep-Sea Res. Pt. I, 58, 1103–1114, doi:10.1016/j.dsr.2011.08.008, 2011.
Lacoue-Labarthe, T., Nunes, P. A. L. D., Ziveri, P., Cinar, M., Gazeau, F., Hall-Spencer, J. M., Hilmi, N., Moschella, P., Safa, A., Sauzade, D., and Turley, C.: Impacts of ocean acidification in a warming Mediterranean Sea: An overview, Regional Studies in Marine Science, 5, 1–11, doi:10.1016/j.rsma.2015.12.005, 2016. Lee, K., Kim, T.-W., Byrne, R. H., Millero, F. J., Feely, R. A., and Liu, Y.-M.: The universal ratio of boron to chlorinity for the North Pacific and North Atlantic oceans, Geochim. Cosmochim. Ac., 74, 1801–1811, doi:10.1016/j.gca.2009.12.027, 2010. Lee, K., Sabine, C. L., Tanhua, T., Kim, T.-W., Feely, R. A.,
and Kim, H.-C.: Roles of marginal seas in absorbing and storing fossil fuel CO2, Energ. Environ. Sci., 4, 1133–1146, doi:10.1039/C0EE00663G, 2011.
Lejeusne, C., Chevaldonné, P., Pergent-Martini, C., Boudouresque, C. F., and Pérez, T.: Climate change effects on a miniature ocean: the highly diverse, highly impacted Mediterranean Sea, Trends Ecol. Evol., 25, 250–260, doi:10.1016/j.tree.2009.10.009, 2010. Le Quéré, C., Andrew, R. M., Canadell, J. G., Sitch, S., Kors-bakken, J. I., Peters, G. P., Manning, A. C., Boden, T. A., Tans, P. P., Houghton, R. A., Keeling, R. F., Alin, S., Andrews, O. D., Anthoni, P., Barbero, L., Bopp, L., Chevallier, F., Chini, L. P., Ciais, P., Currie, K., Delire, C., Doney, S. C., Friedlingstein, P., Gkritzalis, T., Harris, I., Hauck, J., Haverd, V., Hoppema, M., Klein Goldewijk, K., Jain, A. K., Kato, E., Körtzinger, A., Land-schützer, P., Lefèvre, N., Lenton, A., Lienert, S., Lombardozzi, D., Melton, J. R., Metzl, N., Millero, F., Monteiro, P. M. S., Munro, D. R., Nabel, J. E. M. S., Nakaoka, S.-I., O’Brien, K., Olsen, A., Omar, A. M., Ono, T., Pierrot, D., Poulter, B., Röden-beck, C., Salisbury, J., Schuster, U., Schwinger, J., Séférian, R., Skjelvan, I., Stocker, B. D., Sutton, A. J., Takahashi, T., Tian, H., Tilbrook, B., van der Laan-Luijkx, I. T., van der Werf, G. R., Viovy, N., Walker, A. P., Wiltshire, A. J., and Zaehle, S.: Global Carbon Budget 2016, Earth Syst. Sci. Data, 8, 605–649, doi:10.5194/essd-8-605-2016, 2016.
Luchetta, A., Cantoni, C., and Catalano, G.: New observa-tions of CO2-induced acidification in the northern Adriatic Sea over the last quarter century, Chem. Ecol., 26, 1–17, doi:10.1080/02757541003627688, 2010.
Lueker, T. J., Dickson, A. G., and Keeling, C. D.: OceanpCO2 calculated from dissolved inorganic carbon, alkalinity, and equa-tions forK1 andK2: validation based on laboratory measure-ments of CO2in gas and seawater at equilibrium, Mar. Chem., 70, 105–119, doi:10.1016/S0304-4203(00)00022-0, 2000. Macpherson, G. L., Roberts, J. A., Blair, J. M., Townsend,
M. A., Fowle, D. A., and Beisner, K. R.: Increasing shal-low groundwater CO2 and limestone weathering, Konza Prairie, USA, Geochim. Cosmochim. Ac., 72, 5581–5599, doi:10.1016/j.gca.2008.09.004, 2008.
Marcellin Yao, K., Marcou, O., Goyet, C., Guglielmi, V., Touratier, F., and Savy, J.-P.: Time variability of the north-western Mediter-ranean Sea pH over 1995–2011, Mar. Environ. Res., 116, 51–60, doi:10.1016/j.marenvres.2016.02.016, 2016.
Ire-land, Estuar. Coast., 39, 27–39, doi:10.1007/s12237-015-9950-6, 2016.
Meier, K. J. S., Beaufort, L., Heussner, S., and Ziveri, P.: The role of ocean acidification in Emiliania huxleyicoccolith thin-ning in the Mediterranean Sea, Biogeosciences, 11, 2857–2869, doi:10.5194/bg-11-2857-2014, 2014.
Millot, C. and Taupier-Letage, I.: Circulation in the Mediterranean Sea, in: The Mediterranean Sea, edited by: Saliot, A., Springer, Berlin, Heidelberg, 29–66, 2005.
Moulin, E., Jordens, A., and Wollast, R.: Influence of the aero-bic bacterial respiration on the early dissolution of carbonates in coastal sediments, in: Progress in Belgian Oceanographic Research: Proceedings of a Symposium Held at the Palace of Academies Brussels, edited by: Van Grieken, R. and Wollast, R., Brussels, 196–208, 1985.
Müller, J. D., Schneider, B., and Rehder, G.: Long-term al-kalinity trends in the Baltic Sea and their implications for CO2-induced acidification, Limnol. Oceanogr., 61, 1984–2002, doi:10.1002/lno.10349, 2016.
Oh, N.-H. and Raymond, P. A.: Contribution of agricultural lim-ing to riverine bicarbonate export and CO2 sequestration in the Ohio River basin, Global Biogeochem. Cy., 20, GB3012, doi:10.1029/2005GB002565, 2006.
Omstedt, A., Edman, M., Claremar, B., and Rutgersson, A.: Modelling the contributions to marine acidification from deposited SOx, NOx, and NHx in the Baltic Sea: Past
and present situations, Cont. Shelf Res., 111, 234–249, doi:10.1016/j.csr.2015.08.024, 2015.
Palmiéri, J., Orr, J. C., Dutay, J.-C., Béranger, K., Schneider, A., Beuvier, J., and Somot, S.: Simulated anthropogenic CO2storage and acidification of the Mediterranean Sea, Biogeosciences, 12, 781–802, doi:10.5194/bg-12-781-2015, 2015.
Parravicini, V., Mangialajo, L., Mousseau, L., Peirano, A., Morri, C., Montefalcone, M., Francour, P., Kulbicki, M., and Bianchi, C. N.: Climate change and warm-water species at the north-western boundary of the Mediterranean Sea, Mar. Ecol., 36, 897–909, doi:10.1111/maec.12277, 2015.
Perez, F. F. and Fraga, F.: The pH measurements in seawater on the NBS scale, Mar. Chem., 21, 315–327, doi:10.1016/0304-4203(87)90054-5, 1987.
Pörtner, H.-O., Karl, D., Boyd, P. W., Cheung, W., Lluch-Cota, S. E., Nojiri, Y., Schmidt, D. N., and Zavialov, P.: Ocean systems, in: Climate Change 2014, Impacts, Adaptation, and Vulnerabil-ity. Part A: Global and Sectoral Aspects. Contribution of Work-ing Group II to the Fifth Assessment Report of the Intergovern-mental Panel on Climate Change, edited by: Field, C. B., Barros, V. R., Dokken, D. J., Mach, K. J., Mastrandrea, M. D., Bilir, T. E., Chatterjee, M., Ebi, K. L., Estrada, Y. O., Genova, R. C., Girma, B., Kissel, E. S., Levy, A. N., MacCracken, S., Mastrandrea, P. R., and White, L. L., Cambridge University Press, Cambridge, United Kingdom and New York, NY, USA, 411–484, 2014. Provoost, P., van Heuven, S., Soetaert, K., Laane, R. W. P. M.,
and Middelburg, J. J.: Seasonal and long-term changes in pH in the Dutch coastal zone, Biogeosciences, 7, 3869–3878, doi:10.5194/bg-7-3869-2010, 2010.
Raymond, P. A. and Cole, J. J.: Increase in the export of alkalinity from North America’s largest river, Science, 301, 88–91, 2003.
R Core Team: R: A language and environment for statistical com-puting. R Foundation for Statistical Computing, Vienna, Austria, https://www.r-project.org/ (last access: 3 April 2017), 2016. Rhein, M., Rintoul, S. R., Aoki, S., Campos, E., Chambers, D.,
Feely, R. A., Gulev, S., Johnson, G. C., Josey, S. A., A. Kos-tianoy, Mauritzen, C., Roemmich, D., Talley, L. D., and Wang, F.: Observations: Ocean, in: Climate Change 2013, The Physi-cal Science Basis. Contribution of Working Group I to the Fifth Assessment Report of the Intergovernmental Panel on Climate Change, edited by: Stocker, T. F., Qin, D., Plattner, G.-K., Tig-nor, M., Allen, S. K., Boschung, J., Nauels, A., Xia, Y., Bex, V., and Midgley, P. M., Cambridge University Press, Cambridge, United Kingdom and New York, NY, USA, 2013.
Schneider, A., Wallace, D. W. R., and Körtzinger, A.: Alkalin-ity of the Mediterranean Sea, Geophys. Res. Lett., 34, L15608, doi:10.1029/2006GL028842, 2007.
Schneider, A., Tanhua, T., Körtzinger, A., and Wallace, D. W. R.: High anthropogenic carbon content in the eastern Mediterranean, J. Geophys. Res., 115, C12050, doi:10.1029/2010JC006171, 2010.
Slomp, C. P. and Van Cappellen, P.: Nutrient inputs to the coastal ocean through submarine groundwater discharge: controls and potential impact, J. Hydrol., 295, 64–86, doi:10.1016/j.jhydrol.2004.02.018, 2004.
Stets, E. G., Kelly, V. J., and Crawford, C. G.: Long-term trends in alkalinity in large rivers of the conLong-termi- contermi-nous US in relation to acidification, agriculture, and hydro-logic modification, Sci. Total Environ., 488–489, 280–289, doi:10.1016/j.scitotenv.2014.04.054, 2014.
Tamše, S., Ogrinc, N., Walter, L. M., Turk, D., and Faganeli, J.: River sources of dissolved inorganic carbon in the Gulf of Trieste (N Adriatic): stable carbon isotope evidence, Estuar. Coast., 38, 151–164, doi:10.1007/s12237-014-9812-7, 2015.
Tanhua, T., Bates, N. R., and Körtzinger, A.: The marine carbon cy-cle and ocean anthropogenic CO2inventories, in: Ocean Circu-lation and Climate: A 21st Century Perspective, 2nd Ed.., edited by: Siedler, G., Griffies, S., Gould, J., and Church, J., 103, Aca-demic Press, 787–816, 2013.
Ver-ney, R.: Marine ecosystems’ responses to climatic and anthro-pogenic forcings in the Mediterranean, Prog. Oceanogr., 91, 97– 166, doi:10.1016/j.pocean.2011.02.003, 2011.
Touratier, F. and Goyet, C.: Impact of the Eastern Mediterranean Transient on the distribution of anthropogenic CO2and first es-timate of acidification for the Mediterranean Sea, Deep-Sea Res. Pt. I, 58, 1–15, doi:10.1016/j.dsr.2010.10.002, 2011.
Touratier, F., Goyet, C., Houpert, L., de Madron, X. D., Lefèvre, D., Stabholz, M., and Guglielmi, V.: Role of deep convection on anthropogenic CO2 sequestration in the Gulf of Lions (north-western Mediterranean Sea), Deep-Sea Res. Pt. I, 113, 33–48, doi:10.1016/j.dsr.2016.04.003, 2016.
Vargas, C. A., Contreras, P. Y., Pérez, C. A., Sobarzo, M., Saldías, G. S., and Salisbury, J.: Influences of riverine and upwelling wa-ters on the coastal carbonate system off Central Chile and their ocean acidification implications, J. Geophys. Res.-Biogeo., 121, 1468–1483, doi:10.1002/2015JG003213, 2016.
Wolf-Gladrow, D. A., Zeebe, R. E., Klaas, C., Körtzinger, A., and Dickson, A. G.: Total alkalinity: The explicit conservative ex-pression and its application to biogeochemical processes, Mar. Chem., 106, 287–300, doi:10.1016/j.marchem.2007.01.006, 2007.