www.nonlin-processes-geophys.net/18/599/2011/ doi:10.5194/npg-18-599-2011
© Author(s) 2011. CC Attribution 3.0 License.
Nonlinear Processes
in Geophysics
Nonlinear optimization set pair analysis model (NOSPAM) for
assessing water resource renewability
X. H. Yang1, X. J. Zhang1, X. X. Hu1, Z. F. Yang1, and J. Q. Li2
1The Key Laboratory of Water and Sediment Sciences, State Key Laboratory of Water Environment Simulation, School of Environment, Beijing Normal University, Beijing 100875, China
2Water Resources and Hydropower Planning and Design General Institute, MWR, Beijing 100011, China Received: 27 April 2011 – Revised: 19 July 2011 – Accepted: 21 July 2011 – Published: 19 September 2011
Abstract. There is much uncertain information which is very difficult to quantify in the water resource renewability assess-ment (WRRA). The index weights are the key parameters in the assessment model. To assess the water resource re-newability rationally, a novel nonlinear optimization set pair analysis model (NOSPAM) is proposed, in which a nonlin-ear optimization model based on gray-encoded hybrid accel-erating genetic algorithm is given to determine the weights by optimizing subjective and objective information, as well as an improved set pair analysis model based on the con-nection degree is established to deal with certain-uncertain information. In addition, a new calculating formula is estab-lished for determining certain-uncertain information quantity in NOSPAM. NOSPAM is used to assess the water resource renewability of the nine administrative divisions in the Yel-low River Basin. Results show that NOSPAM can deal with the uncertain information, subjective and objective informa-tion. Compared with other nonlinear assessment methods (such as the gray associate analysis method and fuzzy as-sessment method), the advantage of NOSPAM is that it can not only rationally determine the index weights, but also measure the uncertain information quantity in the WRRA. This NOSPAM model is an extension to nonlinear assess-ment models.
1 Introduction
There are many uncertainties in human decision-making (Hsu et al., 2005; Oppenheim and Wehner, 2010). The water resource system is a highly complex nonlinear system influ-enced by the natural factors and human activities (Crutzen,
Correspondence to: X. H. Yang
2002; Yang et al., 2004). There is also much uncertain infor-mation in the water resource renewability assessment (Milly et al., 2005; Zeng et al., 2007). Many hydrological scien-tists studied the water resource renewability with different methods, such as statistics methods (Shiklomanov, 1997), water-balance method (Oki et al., 2001; Vorosmarty et al., 2000; Alcamo et al., 2003), water scarcity index method (Oki and Kanae, 2006) and soft computing techniques (Muttil et al., 2006; Cheng et al., 2002; Wang et al., 2009; Chau et al., 2006). There are several main assessment approaches to nonlinear systems: the statistical approach, fuzzy assessment approach, analytic hierarchy process and the gray associate analysis approach (Zadeh, 1965; Saaty, 1972; Solow, 1994; Naschie, 2005; Kuo, 2007; Saaty, 2007; Yang et al., 2009; Su and Yang, 2009; Xu and Zhang, 2009). These approaches are difficult to assess uncertain systems, which causes new challenges to quantify the uncertain information.
and so on (Chu et al., 1979; Saaty, 2007), have some difficul-ties in assessing water resource renewability. The main rea-sons are given as follows: (1) It is very difficult to decide the index weights in the process of multiple objective decision-making because the indexes include much uncertain infor-mation, subjective and objective information from nature and human activities. (2) Although there were some discussions on uncertain information, it is difficult to take a quantitative analysis method with the above assessment models in real assessment systems.
In order to assess the water resource renewability ratio-nally, a novel nonlinear optimization set pair analysis model (NOSPAM) is proposed in this study. The steps of NOSPAM are: First, a nonlinear optimization model based on gray-encoded hybrid accelerating genetic algorithm is introduced to determine the weights by synthesizing subjective and ob-jective information. Second, an improved set pair analysis model is established to calculate the connection number, cer-tain and uncercer-tain information quantity. Finally, NOSPAM is used for evaluating the degree of water resource renewa-bility of the nine administrative divisions in the Yellow River Basin.
2 The basic steps of the NOSPAM for water resource renewability assessment
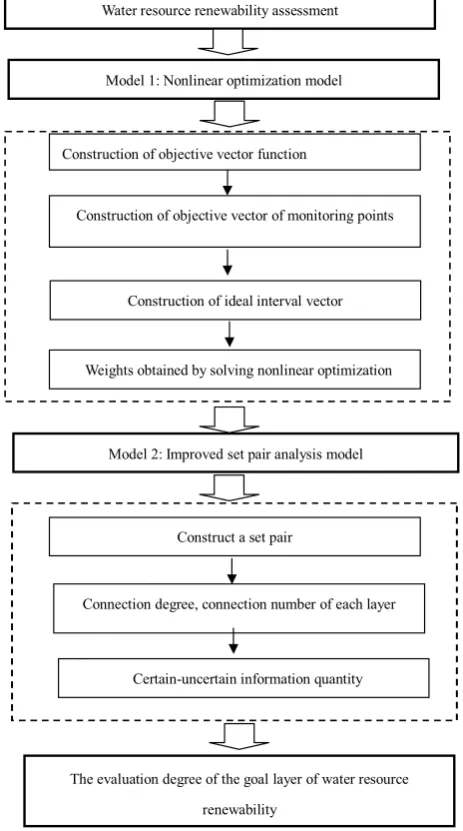
In this paper, the NOSPAM model includes two parts: the nonlinear optimization model and improved set pair analysis model. The basic flow chart of this NOSPAM is shown in Fig. 1.
2.1 Model 1: Nonlinear optimization model
The basic steps of the nonlinear optimization model for de-termining weights are as follows.
Step 1: Construction of objective vector function.
Supposing there areMindexes of water resource renewa-bility assessment such as f1(x),f2(x),. . . ,fj(x),. . . , and fM(x), objective vector functionF (x)can be expressed as F (x)= [f1(x),f2(x),...,fj(x),...,fM(x)]T (1)
Step 2: Construction of objective vector of monitoring
points.
Objective vector of monitoring points is given by
Fk= [f1,k,f2,k,...,fj,k,...,fM,k]T (2) k=1,2,...,l, where l is the number of monitoring points, fj,kisj-th index value of thek-th monitoring point.
Step 3: Construction of ideal interval vector.
Ideal interval vector is constructed with the range of the standard index value in each grade.
Fi∗= [f1,i∗ ,f2,i∗ ,...,fj,i∗ ,...,fM,i∗ ]T, (3) fj,i∗ = [aj,i,bj,i],i=1,2,...,n, (4)
Fig.1 The basic flow chart of NOSPAM for water resource renewability assessment
Water resource renewability assessment
Model 1: Nonlinear optimization model
Model 2: Improved set pair analysis model Construction of objective vector function
Construction of objective vector of monitoring points
Construction of ideal interval vector
Weights obtained by solving nonlinear optimization
Construct a set pair
Connection degree, connection number of each layer
Certain-uncertain information quantity
The evaluation degree of the goal layer of water resource
renewability
Fig. 1. The basic flow chart of NOSPAM for water resource re-newability assessment.
wherenis the number of grades. aj,iandbj,i are the lower and upper endpoint of interval in which thej-th index value located, respectively.
To calculate scientifically, the value offj,k,aj,i andbj,i should be consistent with the value of grade, i.e., if the value of the grade is small, the value offj,k,aj,i andbj,ishould also be small.
Step 4: Nonlinear optimization model based on
gray-encoded hybrid accelerating genetic algorithm for determin-ing index weights is constructed.
Supposing that the weight vector isλ=(λ1,λ2,...,λM), andi0-th grade of thek0-th monitoring point is recognized by considering experts’ knowledge.d(i,k0,λ)is the distance between Fk0(x) and F
∗
vector of thek0-th monitoring point, Fi∗(x)is an ideal in-terval vector of thei-th grade. Nonlinear optimization model for determining weights is given by
minf (λ) (5)
where f (λ)=
1, mind(i,k0,λ)=d(i0,k0,λ),i=1,2,...,n 105,mind(i,k0,λ)6=d(i0,k0,λ),i=1,2,...,n
(6)
d(i,k0,λ)= ||Fk0(x)−F
∗ i (x)|| =
M
X
j=1
λj1(i,k,j ) (7)
s.t. M
P
j=1
λj=1, λj≥0, j=1,2,...,M (8)
here1(i,k0,j )is given by Ifi=1,
1(i,k0,j )=
(fj,k0−aj,1)/(bj,1−aj,1) fj,k0∈ [aj,1,bj,1]
1+(fj,k0−aj,2)/(bj,2−aj,2) fj,k0∈ [aj,2,bj,2]
3 fj,k0> bj,2
(9)
Ifi=2,3,4,
1(i,k0,j )=
(fj,k0−aj,i)/(bj,i−aj,i) fj,k0∈ [aj,i,bj,i]
1+(fj,k0−bj,i−1)/(aj,i−1−bj,i−1) fj,k0∈ [aj,i−1,bj,i−1)
1+(fj,k0−aj,i+1)/(bj,i+1−aj,i+1) fj,k0∈(aj,i+1,bj,i+1]
3 fj,k0< aj,i−1,fj,k0> bj,i+1
(10)
Ifi=5,
1(i,k0,j )=
(fj,k0−aj,5)/(bj,5−aj,5) fj,k0∈ [aj,5,bj,5] 1+(fj,k0−bj,4)/(aj,4−bj,4) fj,k0∈ [aj,4,bj,4]
3 fj,k0< aj,4
(11)
The above weight nonlinear optimization model can be solved with gray-encoded hybrid accelerating genetic algo-rithm (Yang et al., 2005). In general, there are several solu-tions for the model. We can choose one of these solusolu-tions according to experts’ ideas. The optimal weight vector can be marked byλ∗=(λ∗1,λ∗2,...,λ∗M).
The above-mentioned four steps form the nonlinear opti-mization model for determining weights, which is one part of the NOSPAM for water resource renewability assessment. 2.2 Model 2: Improved set pair analysis model
In this paper, set pair analysis model is improved by con-structing the formulas of determining certauncertain in-formation quantity. The basic steps of the improved set pair analysis model for water resource renewability assessment are as follows.
Step 1: Construct a set pair.
For water resource renewability assessment, the indexes of water resource renewability assessment are considered as set A, and the evaluation grades of water resource renewability assessment are considered as set B, then the two sets consti-tute a set pair H = (A, B).
Step 2: Determine then-member connection degreeµmof index layerIm.
µmis given by
µm=rm1+rm2i1+rm3i2+ ··· +rm(n−1)in−2+rmnj, (12) where rml∈[0,1] is the certain-uncertain component of Im relative to Cl ∼Cl+1 levels which can deal with certain-uncertain information between assessment grades, l=1,2,...n. µm is determined according to the formula in Table 1. In Table 1, the measured value of Im is tm. And the evaluation grades are classified into n+1 levels C1,C2,···,Cn+1 which are divided by the points am,1,am,2,...,am,n. The connection degree of index layer, criterion layer and goal layer can be obtained, and then when the value of “i” is determined, the evaluation degree of water resource renewability can be obtained.
The cost index refers to the smaller measured valued as the better evaluation grade, such as the index of water resource quantity of a unit area (m3×m−2×a−1); but the benefit in-dex is opposite, it refers to the smaller measured valued as the lower evaluation grade, such as the index of drought ex-ponent (ratio).
Take the index of water resource quantity of unit area (m3×m−2×a−1)for example, in Qinghai province, the con-nection degree can be written asµ, ifµ=1, it means that the degree of water resource quantity of unit area is strongest; if µ= −1, it means that the degree of water resource quantity of the unit area is weakest; ifµ=a+bi+cj (b6=0), it means that the degree of water resource quantity of the unit area is between strongest and weakest.
Step 3: Determine then-member connection degreeµof the goal layer.
µis given by
µ=r1+r2i1+r3i2+ ··· +r(n−1)in−2+rnj, (13)
rl=
M
X
m=1
wmrml(1≤l≤n) (14)
whererlis the component ofImrelated toCl∼Cl+1degree. wmis the weight ofImwhich can be determined by model 1 (Nonlinear optimization model). µ representsn-member connection degree of goal layer,r1,r2···rnrepresent correl-ative coefficient of each index layer, i1,i2···in−2 represent identical-discrepancy-contrary;j represents contrary coeffi-cient. The meaning ofµis the similarity with the index layer.
Step 4: Calculate the certain information quantityQi and uncertain information quantityQui.
QiandQuiare expressed as
Qi=1−
n−1
P
k=2 rk n
P
k=1 rk
Table 1. The formula ofn-member connection degreeImof index layer.
n−member connection degreeµm Cost index Benefit index
1+0i1+ ··· +0in−2+0j tm≤am,1 tm≥am1
|tm−am,2| |am,1−am,2|
+ |tm−am,1| |am,1−am,2|i1
+0i2··· +0j am,1≤tm≤am,2 am,1≥tm≥am,2
0+ ··· + |tm−am,(s+1)| |am,s−am,(s+1)|is−1
+ |tm−am,s|
|am,s−am,(s+1)|is
+ ··· +0j am,s≤tm,q≤am,q(s+1) am,s≥tm≥am,(s+1)
0+ ··· +0in−3+
|tm−am,n| |am,(n−1)−am,n|in−2
+ |tm−am,(n−1)|
|am,(n−1)−am,n|j am,(n−1)
≤tm≤am,n am,(n−1)≥tm≥am,n
0+0i1+ ··· +0in−2+1j tm≥am,n tm≤am,n
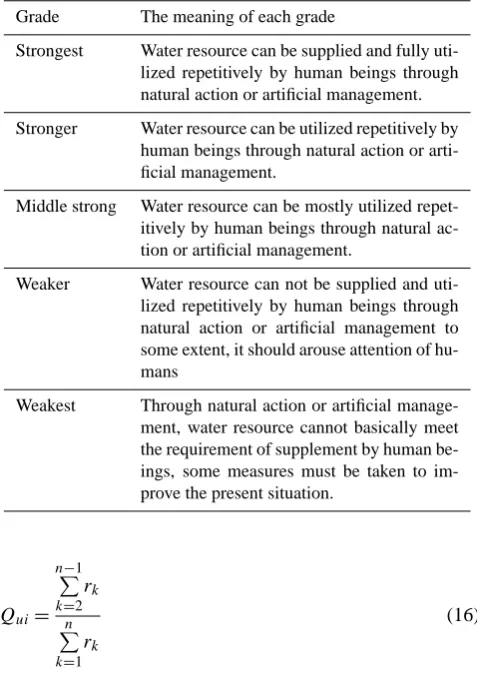
Table 2. The meaning of each grade for water resource renewability assessment.
Grade The meaning of each grade
Strongest Water resource can be supplied and fully uti-lized repetitively by human beings through natural action or artificial management.
Stronger Water resource can be utilized repetitively by human beings through natural action or arti-ficial management.
Middle strong Water resource can be mostly utilized repet-itively by human beings through natural ac-tion or artificial management.
Weaker Water resource can not be supplied and uti-lized repetitively by human beings through natural action or artificial management to some extent, it should arouse attention of hu-mans
Weakest Through natural action or artificial manage-ment, water resource cannot basically meet the requirement of supplement by human be-ings, some measures must be taken to im-prove the present situation.
Qui= n−1
P
k=2 rk n
P
k=1 rk
(16)
Step 5: Calculate then-member connection number of each layer.
The n-member connection number of each layer in wa-ter resource renewability is given as follows. Supposing µ=r1+r2i1+r3i2+...+r(n−1)in−2+rnjasn-member con-nection degree,µ∈[−1,1] , equally divide [−1,1] interval
as the value ofin−2,in−1,···,i2,i1, the value ofn-member connection number can be calculated for each layer.
Step 6: Determine the degree of water resource
renewabil-ity.
Equally dividing interval [−1,1], every interval
corre-sponds to the degree ofC1,C2,···,Cn,Cn+1. By comparing the value of evaluation degree and connection number, we can obtain the degree of water resource renewability. 2.3 General model of NOSPAM
Now we can see that nonlinear optimization model can sci-entifically calculate the weight of each index in the water re-source renewability system, and then the improved set pair analysis model can solve the problem of all kinds of un-certainties, complexity and hierarchy. Based on model 1-Nonlinear optimization model and model 2-Improved Set pair analysis model, we can obtain the general model of NOSPAM for water resource renewability assessment as Fig. 1.
3 Assessment of water resource renewability in the Yellow River Basin
3.1 Assessment indexes and standard
Table 3. The index meaning of each layer.
Goal layer Criterion layer Index layer
Water resource The effects of No. 1 Water resource quantity of unit area renewability assessment natural evolution No. 2 Surface water resource quantity of unit area
No. 3 Ground water resource quantity of unit area
No. 4 Water resource quantity of unit area in the highest flow years No. 5 Water resource quantity of unit area in the lowest flow years No. 6 Drought exponent
No. 7 Precipitation deep
The effects of No. 8 Annual growth rate of GDP
human activities No. 9 Annual growth rate of overall agriculture production value
No. 10 Agriculture consumed water quantity per ten thousand Yuan production value No. 11 Water use ration for single livestock
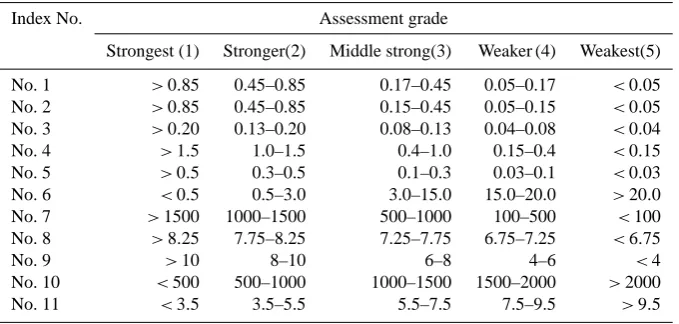
Table 4. Assessment standard based on the data of the whole China.
Index No. Assessment grade
Strongest (1) Stronger(2) Middle strong(3) Weaker (4) Weakest(5)
No. 1 >0.85 0.45–0.85 0.17–0.45 0.05–0.17 <0.05 No. 2 >0.85 0.45–0.85 0.15–0.45 0.05–0.15 <0.05 No. 3 >0.20 0.13–0.20 0.08–0.13 0.04–0.08 <0.04 No. 4 >1.5 1.0–1.5 0.4–1.0 0.15–0.4 <0.15 No. 5 >0.5 0.3–0.5 0.1–0.3 0.03–0.1 <0.03 No. 6 <0.5 0.5–3.0 3.0–15.0 15.0–20.0 >20.0 No. 7 >1500 1000–1500 500–1000 100–500 <100 No. 8 >8.25 7.75–8.25 7.25–7.75 6.75–7.25 <6.75
No. 9 >10 8–10 6–8 4–6 <4
No. 10 <500 500–1000 1000–1500 1500–2000 >2000 No. 11 <3.5 3.5–5.5 5.5–7.5 7.5–9.5 >9.5
(ratio); No. 7 index indicates precipitation deep (mm); No. 8 index indicates annual growth rate of GDP (%); No. 9 in-dex indicates annual growth rate of the overall agriculture production value (%); No. 10 index indicates agriculture consumed water quantity per ten thousand Yuan production value (10−4×m3×Yuan−1); No. 11 index indicates water use ration for single livestock (m3×capita−1).
Here eleven indexes are called index layer, the factors of human activities and the factors of nature evolution are called criterion layer and water resource renewability assessment is called goal layer, i.e., water resource renewability assessment system is divided into water resource social renewability sessment system and water resource natural renewability as-sessment system shown in Table 3. Table 4 shows the assess-ment standard based on data of the whole China (Yang et al., 2004).
3.2 Assessment result
From Table 4, we can see that the assessment standard was divided into several parts, take No. 1 index as an exam-ple: if the measured value is above 0.85, the connection de-gree can be written asµ=a; if the measured value is be-tween 0.45 and 0.85, the connection degree can be written asµ=a+b1i1; if the measured value is between 0.17 and 0.45, the connection degree can be written asµ=b1i1+b2i2; if the measured value is between 0.05 and 0.17, the connec-tion degree can be written asµ=b2i2+cj; if the measured value is under 0.05, the connection degree can be written as µ=cj. So we can draw a conclusion that the four-member connection degree can be obtained in this study. The mea-sured values of indexes of the Yellow River Basin were given in the relative reference (Yang et al., 2004).
Table 5. The four-member connection degree ofImof Qinghai province.
Indexes The weight of The four-member connection
each index degree ofIm
Water resource quantity of unit area 0.124 µ1=0.7250i2+0.2750j Surface water resource quantity of unit area 0.124 µ2=0.8700i2+0.1300j Ground water resource quantity of unit area 0.124 µ3=0.5250i2+0.4750j Water resource quantity of unit area in the highest flow years 0.124 µ4=0.0320i2+0.9680j Water resource quantity of unit area in the lowest flow years 0.124 µ5=0.0850i1+0.9150i2
Drought exponent 0.079 µ6=0.2800+0.7200i1
Precipitation deep 0.142 µ7=0.8583i2+0.1417j
Annual growth rate of GDP 0.027 µ8=1.0000
Annual growth rate of overall agriculture production value 0.039 µ9= −1.0000
Agriculture consumed water quantity per ten thousand Yuan production value 0.044 µ10=0.1880i2+0.8120j Water use ration for single livestock 0.047 µ11=0.3000i1+0.7000i2
Table 6. The connection degree, connection number, certain-information quantity and uncertain-information quantity of water resource renewability in the Yellow River Basin.
Divisions Connection degree Certain-information Uncertain-information Total connection
quantity quantity number
Qinghai µ1=0.0632+0.1003i1+0.5105i2+0.3240j 0.3872 0.6108 −0.3961
Sichuan µ2=0.0942+0.4023i1+0.3843i2+0.1172j 0.2114 0.7866 −0.0171 Gansu µ3=0.0833+0.1283i1+0.3310i2+0.4553j 0.5386 0.4593 −0.4389 Ningxia µ4=0.0203+0.1341i1+0.1132i2+0.7303j 0.7506 0.2473 −0.7031 Neimenggu µ5=0.0531+0.0856i1+0.0927i2+0.7667j 0.8198 0.1783 −0.7159 Shanxi µ6=0.0398+0.1330i1+0.3349i2+0.4903j 0.5301 0.4679 −0.5172 Shaanxi µ7=0.0348+0.1311i1+0.4315i2+0.4006j 0.4354 0.5626 −0.4650 Henan µ8=0.0316+0.1804i1+0.6431i2+0.1429j 0.1745 0.8235 −0.2640 Shandong µ9=0.1209+0.2143i1+0.5012i2+0.1616j 0.2825 0.7155 −0.1353
Yellow River Basin µ10=0.0284+0.1123i1+0.4312i2+0.4261j 0.4545 0.5435 −0.5029
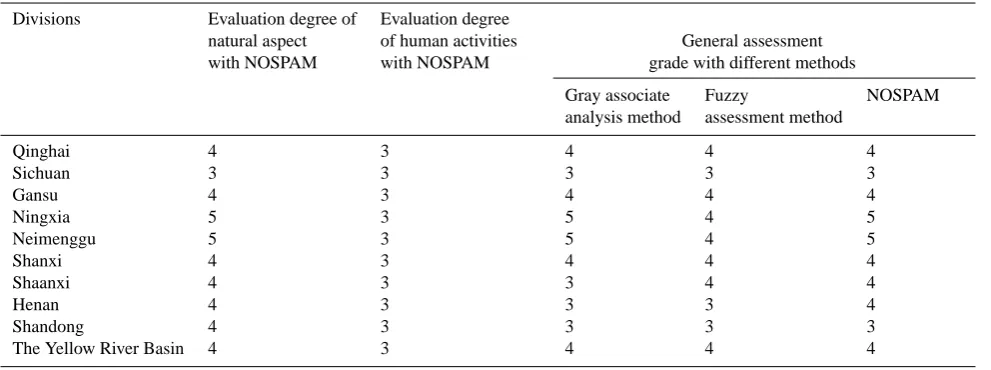
Table 7. The evaluation results of water resource renewability of the nine administrative divisions in the Yellow River Basin with different methods.
Divisions Evaluation degree of Evaluation degree
natural aspect of human activities General assessment with NOSPAM with NOSPAM grade with different methods
Gray associate Fuzzy NOSPAM analysis method assessment method
Qinghai 4 3 4 4 4
Sichuan 3 3 3 3 3
Gansu 4 3 4 4 4
Ningxia 5 3 5 4 5
Neimenggu 5 3 5 4 5
Shanxi 4 3 4 4 4
Shaanxi 4 3 3 4 4
Henan 4 3 3 3 4
Shandong 4 3 3 3 3
The Yellow River Basin 4 3 4 4 4
and objective information. From formula (5), one op-timal weight vector λ∗ is obtained by gray-encoded hybrid-accelerated genetic algorithm (Yang et al., 2005), λ∗=(0.124,0.124,0.124,0.124,0.124,0.079,0.142,0.027, 0.039,0.044,0.049) The detail steps of applying NOSPAM are as follows.
Firstly, the four-member connection degree of each index can be obtained according to Table 1. Take Qinghai province, as an example, the weight of each index and the four-member connection degree ofIm are given as Table 5. Then, based on above weight vectorλ∗, we calculate the four-member connection number of each province when summarizing the connection degree of these eleven indexes. For example, the four-member connection degree of Qinghai can be written as µ=0.0632+0.1003i1+0.5105i2+0.3240j.
Leti1=1/3,i2= −1/3,j= −1, we can get the connec-tion number of first grade indexes as Table 6.
Take Qinghai province, as an example, according to Ta-ble 1 and formula (12), the four-member connection de-gree can be written asµ=0.0632+0.1003i1+0.5105i2+ 0.3240j.
And then, inducingi1=1/3,i2= −1/3,j= −1 into cal-culating formula, the four-member connection number can be obtained, and the value is−0.3961. Certain and uncertain information quantity of water resource renewability in the Yellow River Basin is given in Table 6. And the connection degree, connection number, certain-information quantity and uncertain-information quantity of water resource renewabil-ity in the Yellow River Basin are given in Table 6.
[−1, 1] interval is divided into 5 parts: (0.6, 1], (0.2, 0.6], (−0.2, 0.2], (−0.6,−0.2], [−1,−0.6]. These intervals cor-responds to the strongest, stronger, middle strong, weaker, weakest evaluation grade of water resource renewability, re-spectively. Also taking Qinghai, as an example, the four-member connection number is−0.3961, which corresponds to the interval (−0.6,−0.2], so the evaluation grade of water resource renewability of Qinghai is weaker.
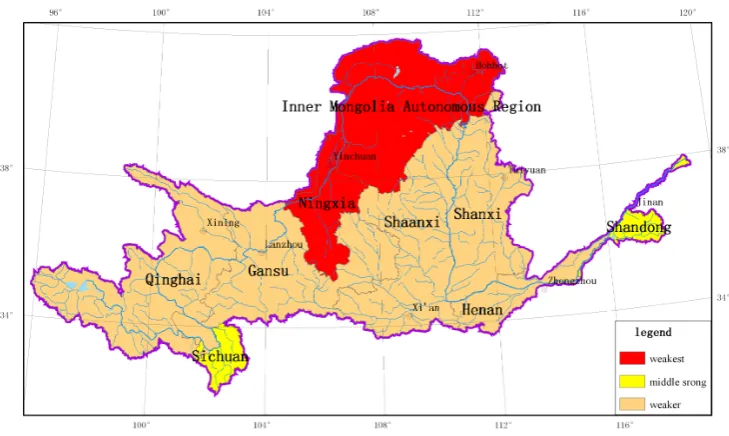
From the diagram above, it can be concluded that: as to water resource renewability, Sichuan and Shandong are mid-dle strong; Qinghai, Gansu, Shanxi, Shaanxi Henan and the Yellow River Basin are weaker, Ningxia and Neimenggu are the weakest. The assessment result is shown in Fig. 2. 3.3 Discussion
In this paper, the influencing factors of water resource re-newability can be divided into two parts: natural factors and human factors. This model can calculate the degree of water resource renewability from these two parts, which makes the research have realistic significance. For example, if we only compare the natural aspects of water resource renewability, we can add the connection degree of index (1)∼(7) which represents the nature aspects together, and other steps are the same. Simultaneously, we can get the evaluation degree of the human aspects of water resource renewability. The
eval-uation degree of water resource renewability in subsystems is given in Table 7.
Table 7 shows the results of the human aspect of water re-source renewability are nearly the same, and they are middle strong. But the natural aspects of water resource renewa-bility are discrepant: Ningxia and Neimemggu are weakest; Sichuan is middle strong; other regions are weaker. So it can be seen that society environment of nine administrative divi-sions in the Yellow River Basin are nearly the same, which indicates human beings are intervening in the hydrological process in all administrative divisions of the Yellow River Basin. And the natural environment of these regions is not so optimistic. So if we want to improve water resource renewa-bility in the Yellow River Basin, we can focus on not only the natural aspect of water resource renewability but also so-ciety environment, for example, we can draft fitting water-saving planning, groundwater-protecting planning or other programming to improve water resource renewability in Yel-low River Basin. So NOSPAM can not only be applied to the water resource renewability comprehensive assessment, but it can also be applied to the subsystem of water resource re-newability comprehensive assessment. And certain and un-certain information quantity of water resource renewability in the Yellow River Basin can be measured clearly as Table 6. We also calculated water resource renewability of the nine administrative divisions in the Yellow River Basin by the gray associate analysis method, fuzzy method with our weights, which is shown in Table 7. Although NOSPAM gives the similar results as other methods, the advantage of NOSPAM is that it can not only rationally determine the weight, but also calculate the certain and uncertain informa-tion quantity of water resource renewability in the Yellow River Basin. NOSPAM is a new way to assess water resource renewability.
4 Conclusions and prospect
To assess the water resource renewability rationally, NOSPAM model is established, which takes genetic algo-rithm and set pair analysis as a theory basis. The NOSPAM is used to assess the water resource renewability for nine ad-ministrative divisions in the Yellow River Basin, the main conclusions are as follows.
Fig.2 The result of water resource renewability assessment in the Yellow River Basin Fig. 2. The result of water resource renewability assessment in the Yellow River Basin.
2. Nonlinear optimization model is given to determine the weight by use of global convergent gray-encoded hybrid accelerating genetic algorithm in NOSPAM. NOSPAM can fully take advantage of subjective and objective information, which makes the weights more reasonable.
3. As to water resource renewability of nine adminis-trative divisions in the Yellow River Basin from the total system, we can see that Sichuan and Shandong are middle strong, Qinghai, Gansu, Shanxi, Shaanxi, Henan and the Yellow River Basin are weaker, Ningxia and Neimenggu are the weakest. From the subsystem, we can see that the results of the human aspect of water resource renewability are almost the middle strong, which indicates human beings have intervened in the hydrological process in all administrative divisions of the Yellow River Basin. But the natural aspects of water resource renewability are discrepant, Ningxia, Neimemggu are weakest, Sichuan is middle strong, and other regions are weaker. And the natural environment of these regions is not so optimistic. The results show that the NOSPAM can play an important role in the application and analysis.
4. Compared with the gray associate analysis method and fuzzy assessment method, NOSPAM can not only ra-tionally determine the index weight, but also mea-sure the certain-uncertain information quantity in the WRRA. NOSPAM can be widely used in the certain-uncertain water resource assessment systems. This re-search will have significant theoretical and practical
im-pacts on the studies of the nonlinear assessment meth-ods. The new nonlinear optimization set pair analysis model (NOSPAM) can be used in assessing other non-linear systems in the future and its theory will be further studied.
Acknowledgements. This work was supported by the National Ba-sic Research Program of China (No. 2010CB951104), the Project of National Natural Science Foundation of China (No. 50939001, 51079004), the Specialized Research Fund for the Doctoral Tutor Program of Higher Education (No. 20100003110024), and the Program for Changjiang Scholars and Innovative Research Team in University (No. IRT0809).
Edited by: W. Hsieh
Reviewed by: two anonymous referees
References
Alcamo, J., Doll, P., Henrichs, T., Kaspar, F., Lehner, B., Rosch, T., and Siebert, S.: Global Estimates of Water Withdrawals and Availability under Current and Future “Business-As-Usual” Con-ditions, Hydrolog. Sci. J., 48, 339–348, 2003.
Bahrami, B., Olsen, K., Latham, P. E., Roepstorff, A., Rees, G., and Frith, C. D.: Optimally Interacting Minds, Science, 329, 1081– 1085, 2010.
Chau, K. W.: Particle swarm optimization training algorithm for ANNs in stage prediction of Shing Mun River, J. Hydrology, 329, 363–367, 2006.
Chu, A. T. W., Kalaba, R. E., and Spingam, K.: A comparision of two methods for determining the weights of beinging to fuzzy sets, J. Optimiz Theory App., 27, 531–538, 1979.
Crutzen, P. J.: Geology of Mankind, Nature, 415, 23, doi:10.1038/415023a, 2002.
Hsu, M., Bhatt, M., Adolphs, R., Tranel, D., and Camerer, C. F.: Neural Systems Responding to Degrees of Uncertainty in Human Decision-Making, Science 310, 1680–1683, 2005.
Hu, X. X., Yang, X. H., and Li, J. Q.: Set Pair Analysis model on the assessment of the river health system, Systems Engineering-Theory & Practice, 28, 164–170, 2008.
Huang, Q., Tian, S. G., and Zhang, B. X.: Research of Region Water Security Evaluation by Set Pair Analysis, Adv. Water Resour. Hydraulic Eng., 16, 119–123, 2009.
Kuo, C. L.: Design of an Adaptive Fuzzy Sliding-Mode Controller for Chaos Synchronization, Int. J. Nonlin. Sci Num., 8, 631–636, 2007.
May, R. M.: Simple mathematical models with very complicated dynamics, Nature, 261, 459–467, 1976.
Milly, P. C. D., Dunne, K. A., and Vecchia, A. V.: Global Pattern of Trends in Streamflow and Water Availability in A Changing Climate, Nature, 438, 347–350, 2005.
Muttil, N. and Chau, K. W.: Neural network and genetic program-ming for modelling coastal algal blooms, Int. J. Environ. Pollut., 28, 223–238, 2006.
Naschie, M. S. E. L.: On a fuzzy khaler-like manifold which is consistent with two slit experiment, Int. J. Nonlin. Sci. Num., 6, 95–98, 2005.
Oki, T., Agata, K. Y., Saruhashi, S., Yang, T., and Musiake, D. K.: Globe Assessment of Current Water Resources Using To-tal Runoff Integrating Pathways, Hydrolog. Sci. J., 46, 983–995, 2001.
Oki, T. and Kanae, S.: Global Hydrological Cycles and World Wa-ter Resources, Science, 313, 1068–1072, 2006.
Oppenheim, J. and Wehner, S.: The Uncertainty Principle De-termines the Nonlocality of Quantum Mechanics Science, 330, 1072–1974, 2010.
Saaty, T. L.: Operations Research: Some Contributions to Mathe-matics, Science, 178, 1061–1070, 1972.
Saaty, T. L.: Time dependent decision-making; dynamic priorities in the AHP/ANP: Generalizing from points to functions and from real to complex variables, Math. Comput. Model., 46, 860–891, 2007.
Shiklomanov, A. E. D.: Assessment of Water Resources and Water Availability in the World World Meteorological Organi-zation/Stockholm Environment Institute, Geneva, Switzerland, 1997.
Solow, A. R.: Time Series Prediction – Forecasting the Future and Understanding the Past, Science, 5179, 1745–1746, 1994. Su, M. R. and Yang, Z. F.: Set pair analysis for urban ecosystem
health assessment, Communications in Nonlinear Science and Numerical Simulation, 14, 1773–1780, 2009.
Vorosmarty, C. J., Green, P., Salisbury, J., and Lammers, R. B.: Globe Water Resources: Vulnerability from Climate Change and Population Growth, Science, 289, 284–288, 2000.
Wang, W. C., Chau, K. W., Cheng, C. T., and Qiu, L.: A com-parison of performance of several artificial intelligence methods for forecasting monthly discharge time series, J. Hydrology, 374, 294–306, 2009.
Wang, W. S., Jin, J. L., Ding, J., and Li, Y. Q.: A new approach to water resources system assessment – set pair analysis method, Sci. China Ser. E., 52, 3017–3023, 2009.
Xu, F., Zheng, X. P., Zhang, J., Fu, Z. T., and Zhang, X. S.: A hybrid reasoning mechanism integrated evidence theory and set pair analysis in Swine-Vet, Expert Systems with Applications, 37, 7086–7093, 2010.
Xu, Y. T. and Zhang, Y.: A online credit evaluation method based on AHP and SPA, Commun. Nonlinear Sci., 14, 3031–3036, 2009. Yang, X. H., She, D. X., Yang, Z. F., Tang, Q. H., and Li, J. Q.:
Chaotic Bayesian Method Based on multiple criteria decision making (MCDM) for Forecasting Nonlinear Hydrological Time Series, Int. J. Nonlin. Sci. Num., 10, 1595–1610, 2009. Yang, X. H., Yang, Z. F., Lu, G. H., and Li, J. Q.: A Gray-Encoded,
Hybrid-Accelerated, Genetic Algorithm for Global Optimiza-tions in Dynamical Systems, Commun. Nonlinear Sci., 10, 355– 363, 2005.
Yang, X. H., Yang, Z. F., and Shen, Z. Y.: An Multi-Objective Decision-Making Ideal Interval Method for Comprehensive As-sessment on Water Resource Renewability, Sci. China Ser. E., 47, 42–49, 2004.
Zadeh, L. A.: Fuzzy Sets, Information and Control, 8, 338–353, 1965.