www.the-cryosphere.net/11/101/2017/ doi:10.5194/tc-11-101-2017
© Author(s) 2017. CC Attribution 3.0 License.
An assessment of two automated snow water equivalent instruments
during the WMO Solid Precipitation Intercomparison Experiment
Craig D. Smith1, Anna Kontu2, Richard Laffin3, and John W. Pomeroy4
1Environment and Climate Change Canada, Saskatoon, S7N 3H5, Canada 2Finnish Meteorological Institute, Sodankylä, 99600, Finland
3Campbell Scientific, Edmonton, T5L 4X4, Canada
4Centre for Hydrology, University of Saskatchewan, Saskatoon, S7N 5C8, Canada
Correspondence to:Craig D. Smith ([email protected])
Received: 1 March 2016 – Published in The Cryosphere Discuss.: 24 March 2016
Revised: 22 November 2016 – Accepted: 25 November 2016 – Published: 16 January 2017
Abstract. During the World Meteorological Organization (WMO) Solid Precipitation Intercomparison Experiment (SPICE), automated measurements of snow water equiva-lent (SWE) were made at the Sodankylä (Finland), Weiss-fluhjoch (Switzerland) and Caribou Creek (Canada) SPICE sites during the northern hemispheric winters of 2013/14 and 2014/15. Supplementary intercomparison measurements were made at Fortress Mountain (Kananaskis, Canada) dur-ing the 2013/14 winter. The objectives of this analysis are to compare automated SWE measurements with a refer-ence, comment on their performance and, where possible, to make recommendations on how to best use the instru-ments and interpret their measureinstru-ments. Sodankylä, Cari-bou Creek and Fortress Mountain hosted a Campbell Scien-tific CS725 passive gamma radiation SWE sensor. Sodankylä and Weissfluhjoch hosted a Sommer Messtechnik SSG1000 snow scale. The CS725 operating principle is based on mea-suring the attenuation of soil emitted gamma radiation by the snowpack and relating the attenuation to SWE. The SSG1000 measures the mass of the overlying snowpack di-rectly by using a weighing platform and load cell. Manual SWE measurements were obtained at the intercomparison sites on a bi-weekly basis over the accumulation–ablation periods using bulk density samplers. These manual measure-ments are considered to be the reference for the intercom-parison. Results from Sodankylä and Caribou Creek showed that the CS725 generally overestimates SWE as compared to manual measurements by roughly 30–35 % with correla-tions (r2) as high as 0.99 for Sodankylä and 0.90 for Caribou Creek. The RMSE varied from 30 to 43 mm water
1 Introduction
The measurement of snow water equivalent (SWE) is vi-tal for flood and water resource forecasting, drought moni-toring, climate trend analysis, and hydrological and climate model initialization (Barnett et al., 2005; Bartlett et al., 2006; Gray et al., 2001; Laukkanen, 2004). Many of these appli-cations require accurate and timely information about how much water is being held within the snowpack (Pomeroy and Gray, 1995). SWE measurements can be made in situ, either manually or via automated instrumentation, or derived from remote sensing platforms, and they are usually expressed as units of mass per area (kg m−2) or in equivalent units of millimetres of water equivalent (mm w.e.). Manual mea-surements of SWE are typically made using a multi-point bulk density sampling technique along an established tran-sect or snow course (WMO, 2008). Snow course measure-ments are often time consuming and expensive, especially if required in remote locations (Pomeroy and Gray, 1995). This means that manual SWE measurements may be infre-quent or only undertaken when the snowpack is estimated to be at its seasonal maximum. Prohibitive costs of man-ual snow course observations have led to the reduction of these measurements by many agencies, including Environ-ment and Climate Change Canada, where operational snow course numbers have decreased from over 100 in the 1980s to less than 30 (Barry, 1995; Brown et al., 2000). Since the early 1990s, manual SWE measurements have been augmented or replaced by remote sensing techniques such as passive mi-crowave retrievals (Goodison and Walker, 1995) but these techniques still require accurate and reliable in situ measure-ments for ground truthing and retrieval development (Derk-sen et al., 2005; Takala et al., 2011).
With the reduced availability of manual SWE measure-ments, automated instruments for the measurement of SWE are becoming more necessary and more commonplace. Snow pillows have been used for the automated measurement of SWE in remote locations since the 1960s (Beaumont, 1965) by measuring the overlying pressure of the snowpack on a fluid-filled bladder. The SNOTEL network in the United States is based on snow pillow measurements (Serreze et al., 1999). More recently, similar measurements are obtained using snow scales that use a weighing surface and load cell to measure the weight of the overlying snow (Beaumont, 1966a; Johnson et al., 2007, 2015). Several indirect methods exist to measure SWE that include the use of neutron probes (Hard-ing, 1986) in which a radiation source is placed under the snowpack and the scattering of neutrons through the snow is measured by a detector. Cosmic ray proton probes (Kodama et al., 1979; Rasmussen et al., 2012) work in a similar manner but do not require an active source. The probes described by Kodama et al. (1979) are installed under the snow while the system described by Rasmussen et al. (2012) (called COS-MOS) is installed above the snow. Kinar and Pomeroy (2007, 2015a) outline a method of non-invasive sonic
reflectome-try through the snowpack to determine snow density, liq-uid water content and temperature. Other passive radiation sensors are mounted above the surface and measure the at-tenuation of naturally emitted radiation from the soil as it passes through the snowpack and then relate this attenuation to SWE content (Choquette et al., 2008; Martin et al., 2008). Each of these instruments and techniques have advantages and disadvantages, which are not discussed here (see Kinar and Pomeroy, 2015b, for a more comprehensive description of snow measurement methods and related issues). Rather, this analysis assesses the use and accuracy of two instruments that were tested during the World Meteorological Organiza-tion (WMO Solid PrecipitaOrganiza-tion Intercomparison Experiment (SPICE) (Nitu et al., 2012; Rasmussen et al., 2012), namely the Campbell Scientific CS725 and the Sommer Messtechnik SSG1000 snow scale.
The CS725 (previously known as GMON or GMON3) has been previously field tested by Hydro Québec (Choquette et al., 2008; Martin et al., 2008) as well as by Wright et al. (2011). Results by Choquette et al. (2008) showed an average error of +18 % when comparing to eight manual snow cores over three seasons in Québec. They obtained a somewhat better agreement with total SWE calculated from density profiles (with an average error of +5 %) but only had four samples over two seasons. Wright et al. (2011) showed intercomparison results between GMON3 sensors and snow pillows, precipitation gauges and snow courses at Sunshine Village (Alberta, Canada) and Tony Grove Ranger Station (Utah, USA). Results showed high correlations be-tween the sensor and (unadjusted) accumulated precipitation (0.99) and between the sensor and snow pillow observations (0.99) but lower correlations (0.83) with snow course obser-vations (during one season at Sunshine Village). The authors question the quality and inherent biases in the snow course samples but do not comment on the sources of error or the proximity of the snow course to the instrument.
Instrument intercomparisons that included the SSG1000 have been limited but some results are reported by Stranden and Grønsten (2011), who showed parallel SWE measure-ments between snow pillows, snow scales and manual snow courses. With mitigating circumstances (e.g. snow drifting and scale issues), they concluded that the measurement sur-face area had an impact on the measurement quality and that the Sommer scale gave “promising results” but that further intercomparison was required.
For SoG, 13 different instruments are under test with 9 mea-suring snow depth and 4 meamea-suring SWE. The CS725 and the SSG1000 SWE instruments examined here were installed at the Sodankylä (Finland), Caribou Creek (Canada) and Weiss-fluhjoch (Switzerland) intercomparison sites (Fig. 1). To sup-plement the CS725 data collected for WMO-SPICE, data were added from an additional CS725 instrument installed at the Fortress Mountain ski area in the Kananaskis region of the Canadian Rocky Mountains.
2 Instrumentation and methods 2.1 Campbell Scientific CS725
The CS725 (Fig. 2, left) is a passive gamma sensor developed by Hydro Québec in collaboration with Campbell Scientific (Canada) Corp. (Choquette et al., 2008; Martin et al., 2008). The instrument is installed above the snow surface and de-termines SWE by measuring naturally emitted gamma radi-ation from potassium (K) and thallium (Tl) sources in the soil that is attenuated by the snowpack. Each gamma ray detected by the sensor element is counted over a user de-fined period, the resulting distribution is compared to the distribution when there was no snow cover, and the differ-ence is used to calculate SWE. The sensor field of view is approximately 120◦, resulting in a measurement area of ap-proximately 80 m2 when installed 3 m above the snowpack and with the collimator attached. The collimator serves to shield the instrument from gamma rays emitted from sources that are not in the target area. The effective range of the in-strument is 0–600 mm w.e. with a measurement accuracy of
±15 mm w.e. from 0 to 300 mm w.e. and 15 % from 300 to 600 mm w.e. (Campbell Scientific CS725 manual, https://s. campbellsci.com/documents/ca/manuals/cs725_man.pdf).
The two CS725 instruments for WMO-SPICE were both installed in October 2013 at Sodankylä, Finland, and Cari-bou Creek, Canada, and operated over the northern hemi-spheric winters of 2013/14 and 2014/15. Both instruments were mounted so that the bottom of the instrument was ap-proximately 2 m above the ground and both were installed with the manufacturer provided collimator. Data were output every 6 h. The instrument at Sodankylä was moved approxi-mately 10 m during the summer of 2014 to avoid some buried cables in the measurement area, but any potential impact of the move is considered to be negligible because of the con-sistency in the snowpack at this site. The impact of spatial variability is addressed in Sect. 4.
The third CS725 used in this analysis was not a WMO-SPICE instrument, but it was loaned to the University of Saskatchewan for testing and intercomparison by the instru-ment manufacturer. This instruinstru-ment was installed in a clear-ing near the Fortress Mountain ski resort in the Kananaskis Valley, Alberta, Canada. The CS725 was mounted at a height of approximately 3.5 m above the ground. The distance to the
Figure 1. Location of the CS725 (Sodankylä, Caribou Creek,
Fortress Mountain) and SSG1000 (Sodankylä and Weissfluhjoch) instrument intercomparisons.
Figure 2.The Campbell Scientific CS725 (left) installed at Caribou
Creek and the Sommer Messtechnik SSG1000 (right) installed at Sodankylä.
trees around the instrument was approximately 10 m from the centre of the instrument, putting them outside of the response area. Data collected by this instrument from October 2013 through June 2014 are used in this analysis. Like the other CS725 instruments, SWE data were output every 6 h.
2.2 Sommer SSG1000
The SSG1000 snow scales in this analysis were installed in the Sodankylä and Weissfluhjoch SPICE sites. The Weiss-fluhjoch instrument was provided by the WSL Institute for Snow and Avalanche Research SLF. Data collection from the instrument started in October 2013 and continued for the 2013/14 and 2014/15 northern hemispheric winters. The SSG1000 at Sodankylä was located in the northeast quad-rant of the SPICE Field, approximately 22 m southeast of the original location of the CS725. At Weissfluhjoch, it is located in the southwest corner of the instrument field. SWE obser-vations from the instruments were recorded once per minute during the two intercomparison seasons.
2.3 Reference SWE measurements
The reference SWE manual measurements for this intercom-parison differed by site. All were bulk density snow samples made with a snow sampling tube of a known diameter that has one end capable of penetrating and cutting into the snow-pack. The tube was inserted into the snowpack either down to the surface of the ground or to a plate inserted into the snow-pack, and the sample was extracted. Along with the sample, the depth of the snowpack was also obtained. The sampled snow was then either bagged and weighed or was weighed inside the tube using a cradle and balance. The snow sampler used in Canada is different than the tube used in Finland and these differences, as well as any other differences in sampling technique, are described below.
At Caribou Creek, the reference SWE measurements were obtained using an ESC-30 snow tube with a 30 cm2cutting area. Farnes et al. (1983) and Goodison et al. (1987) show that the ESC-30, when used correctly and in ideal condi-tions, has a mean measurement error of less than 0.5 % of the true SWE. Errors associated with sampling in less than ideal conditions are discussed later. Bulk density samples at Caribou Creek were taken just inside the response area of the CS725, bagged and weighed. A 30 cm2sample from within the response area is assumed to have a negligible im-pact on future sensor measurements considering the total sensor response area is 80 m2, but it was filled in with dis-carded snow when possible. These manual SWE measure-ments were made about every 2 weeks in conjunction with a full five-point snow course across the intercomparison field and into the forest canopy on each side.
At Sodankylä, the reference SWE measurement was made using a Finnish bulk density sampling tube, with a sam-pling area of 78.54 cm2, and balance (Kuusisto, 1984) at roughly the same location in the intercomparison field ev-ery 2 weeks. Only one sample was measured at a time. Dur-ing the winter of 2013/14, the bulk density SWE sample was obtained approximately 12 m from the centre of the CS725 measurement area and approximately 16 m from the centre of the SSG1000. In 2014/15, after the CS725 was moved, the manual sampling was done approximately 6 m from the
CS725 measurement area and approximately 25 m from the SSG1000.
An ESC-30 snow tube was used at the Fortress Moun-tain site. A full snow survey was conducted at the site once per month, transitioning to bi-weekly during the ablation pe-riod. Although the actual snow survey course was through the forested area, supplemental measurements were taken in the clearing where the instrumentation is located. The dis-tance between the sensor and the manual measurements was approximately 10 m.
The manual SWE measurements at Weissfluhjoch were performed bi-weekly on the SLF study plot using a bulk den-sity aluminum sampling tube with a sampling area of 70 cm2 and length of 55 cm. The weight was measured with a cra-dle and balance (Jonas et al., 2009). The distance between the sensor and manual snow measurement varied from ob-servation to obob-servation as the location of the snow pit was relocated for each bi-weekly measurement. The average dis-tance was approximately 20 m.
2.4 Intercomparisons
The intercomparisons are not completely consistent amongst the four sites because of the different instrumentation and manual methods for measuring reference SWE. At So-dankylä and Weissfluhjoch, the sensors can both be com-pared with the manual SWE measurements made nearby, although the manual measurements are not within the mea-suring area of either instrument. The timestamps of both in-struments were matched as closely as possible to the manual observation time. Since the CS725 only reports every 6 h, the measurement output closest to the manual observation time was used for the intercomparison. Since the SSG1000 reports every minute, no time adjustment was necessary. The same procedure was used to compare the CS725 to the SSG1000. No SSG1000 was present at Caribou Creek or Fortress Mountain and no CS725 sensors were installed at Weissfluhjoch.
0 50 100 150 200 250 300 0
50 100 150 200 250 300
Manual SWE (mm w.e.)
CS725 SW
E (mm w.
e.)
CS725 vs. manual SWE for Sodankyla 2013/2014 and 2014/2015 SWE K
SWE Tl K regression Tl regression
0 25 50 75 100 125 150 0
25 50 75 100 125 150
Manual SWE (mm w.e.)
CS725 SW
E (mm w.
e.)
CS725 vs. manual SWE for Caribou Creek 2013/2014 and 2014/2015 SWE K
SWE Tl K regression Tl regression
0 100 200 300 400 500 600 700 0
100 200 300 400 500 600 700
Manual SWE (mm w.e.)
CS725 SW
E (mm w.
e.)
CS725 vs. manual SWE for Fortress Mountain 2013/2014 SWE K
K regression
Figure 3.CS725 vs. manual SWE for Sodankylä (top) and Caribou
Creek (middle) for the 2013/14 and 2014/15 seasons and Fortress Mountain (bottom) for the 2013/14 season. Potassium output in red
and thallium output in blue. Black line is 1:1. Error bars represent
manufacturer’s stated sensor accuracy.
3 Results
3.1 CS725 vs. manual
The comparison between the CS725 measurements and the manual SWE observations are shown in Fig. 3 with the potas-sium output in red circles and the thallium output in blue tri-angles. The black line in the figure represents the 1:1 line and the error bars represent the manufacturer’s stated sensor accuracy. Figure 4 shows the time series of automated and
2013-10-01 2014-01-01 2014-04-01 2014-07-01 0
50 100 150 200 250 300
SWE (
mm w.
e.)
Sodankyla SWE 2013/2014
2014-10-01 2015-01-01 2015-04-01 2015-07-01 Sodankyla SWE 2014/2015
CS725 K CS725 Tl Manual
2013-10-01 2014-01-01 2014-04-010
20 40 60 80 100 120 140 160
SWE (
mm w.
e.)
Caribou Creek SWE 2013/2014
2014-10-01 2015-01-01 2015-04-01
Caribou Creek SWE 2014/2015
CS725 K CS725 Tl Manual
2013-11-01 2014-02-01 2014-05-01 2014-08-01 0
100 200 300 400 500 600 700
SWE (
mm w.
e.)
Fortress Mountain SWE 2013/2014
CS725 K Manual
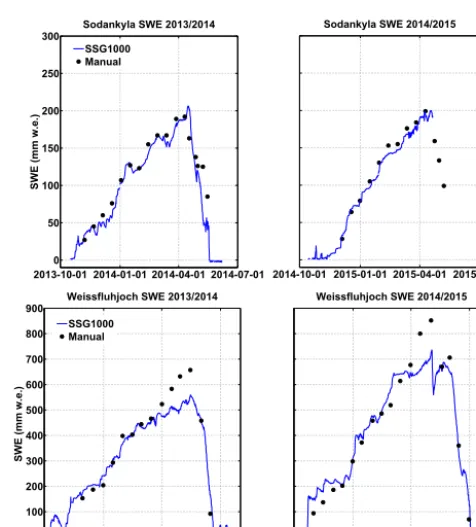
Figure 4.Time series of the CS725 SWE sensors and manual SWE
measurements at Caribou Creek (top), Sodankylä (middle) for the 2013/14 (left) and 2014/15 (right) seasons, and Fortress Mountain (bottom) for the 2013/14 season.
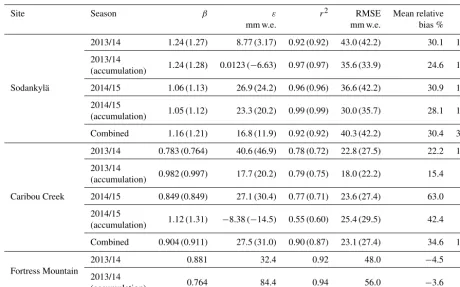
Table 1.Regression coefficients and other statistical measures for the multi-season intercomparison of the CS725 with manual SWE at
Sodankylä, Caribou Creek and Fortress Mountain (whereβandεare the slope and intercept of the regression line). Values inside and outside
of the parenthesis represent thallium and potassium output, respectively, from the sensor. “Accumulation” indicates that data occurring after
maximum seasonal SWE is omitted from the analysis. “Combined” indicates that data from both seasons are included, andnrepresents the
sample size.
Site Season β ε r2 RMSE Mean relative n
mm w.e. mm w.e. bias %
2013/14 1.24 (1.27) 8.77 (3.17) 0.92 (0.92) 43.0 (42.2) 30.1 17
2013/14
1.24 (1.28) 0.0123 (−6.63) 0.97 (0.97) 35.6 (33.9) 24.6 13
(accumulation)
Sodankylä 2014/15 1.06 (1.13) 26.9 (24.2) 0.96 (0.96) 36.6 (42.2) 30.9 13
2014/15
1.05 (1.12) 23.3 (20.2) 0.99 (0.99) 30.0 (35.7) 28.1 10
(accumulation)
Combined 1.16 (1.21) 16.8 (11.9) 0.92 (0.92) 40.3 (42.2) 30.4 30
2013/14 0.783 (0.764) 40.6 (46.9) 0.78 (0.72) 22.8 (27.5) 22.2 12
2013/14
0.982 (0.997) 17.7 (20.2) 0.79 (0.75) 18.0 (22.2) 15.4 9
(accumulation)
Caribou Creek 2014/15 0.849 (0.849) 27.1 (30.4) 0.77 (0.71) 23.6 (27.4) 63.0 7
2014/15
1.12 (1.31) −8.38 (−14.5) 0.55 (0.60) 25.4 (29.5) 42.4 4
(accumulation)
Combined 0.904 (0.911) 27.5 (31.0) 0.90 (0.87) 23.1 (27.4) 34.6 19
Fortress Mountain
2013/14 0.881 32.4 0.92 48.0 −4.5 8
2013/14
0.764 84.4 0.94 56.0 −3.6 5
(accumulation)
3.1.1 Sodankylä
Throughout the intercomparison periods at Sodankylä, the CS725 overestimated SWE on average by 30 % (mean rela-tive bias or MRB) as compared to the manual measurements. From Table 1, the regression analysis for the CS725 as com-pared to manual SWE over the entire season results in a slope (β) of 1.24 for 2013/14 and 1.06 for 2014/15. The difference inβ between the K and Tl outputs is small. The intercepts (ε) for the entire seasons are 8.77 mm w.e. for 2013/14, in-creasing to 26.9 mm w.e. for 2014/15. This difference might be in part a result of moving the instrument to a new loca-tion. The correlation coefficient,r2, is 0.92 for 2013/14 and 0.96 for 2014/15. With the period of ablation eliminated from the analysis, the impact onβ andεare relatively small al-though the interceptεdecreases almost 9 and 4 mm w.e. for the respective seasons. The accumulation periodr2increases to 0.97 and 0.99 for the 2013/14 and 2014/15 seasons, re-spectively, suggesting that more scatter is introduced into the relationship during the ablation period. This is discussed fur-ther below.
Figure 4 (top) shows the time series for the 2013/14 (left) and 2014/15 (right) seasons at Sodankylä. In this figure, the overestimation of the CS725 (red and blue lines) can be seen when compared to manual SWE (black circles). In general, the instrument trends are the same as for the manual measure-ments with differences between the measuremeasure-ments increasing after the start of the ablation periods and in January 2014 and December 2014. Although it appears from Fig. 5 that the difference between the measurements is simply increas-ing with time (or SWE amount), we believe that at least part of this increase is a result of melting in the snowpack which occurs during some relatively warm days. In 2013/14 (Fig. 5, left), a large increase in the difference occurs after the>0◦C
temperatures in mid- to late April. In 2014/15 (Fig. 5, right), there is a moderate increase after some>0◦C temperatures in March but a much larger jump after the beginning of the ablation period in April.
3.1.2 Caribou Creek
(potassium vs. thallium) is negligible. Also like Sodankylä, the CS725 at Caribou Creek consistently overestimates to-tal SWE such that the MRB is 35 %. However, the relation-ships between the instrument and the manual SWE measure-ments are different than at Sodankylä. At Caribou Creek, the slopes of the regression line,β, are less than 1 for all scenar-ios in Table 1 with the exception of the accumulation period in 2014/15. The intercepts (ε) are all larger than seen at So-dankylä, with the accumulation period in 2014/15 being the exception once again. Ther2values range from 0.90 for the combined (2013/14 and 2014/15) data to 0.55 for the accu-mulation period in 2014/15.
For both the 2013/14 and 2014/15 seasons, the time series for Caribou Creek (Fig. 4, middle) shows a rapid increase in SWE in early winter related to heavier, wet snowfall events that most likely began as rain and transitioned to snow. For 2013/14, the CS725 time series generally follows the trend of the manual SWE measurements with a large deviation devel-oping mid- to late March with the onset of seasonal ablation. Figure 5 (middle) shows the time series of the difference be-tween the CS725 and manual SWE (red) and the temperature time series (blue) for both seasons. In 2013/14 (Fig. 5, middle left), there is an increase in the difference that occurs in late January. This could be due to a melt period where tempera-tures at the site exceeded 4◦C preceding the increase in the instrument bias. A much larger jump in the difference occurs mid-March possibly due to significantly higher temperatures (exceeding 10◦C) earlier that month. In 2014/15 (Fig. 5, middle right), the deviation between the measurements oc-curs earlier in the season (mid- to late January) coinciding with a January snowmelt period characterized by above 0◦C air temperatures and high wind speeds (not shown) that re-sulted in ice layers on top and within the snowpack (which make accurate manual SWE measurements more difficult) and possibly infiltration of meltwater into the frozen sandy soil. Differences decrease after snowfall events in February only to increase again after the start of ablation in March.
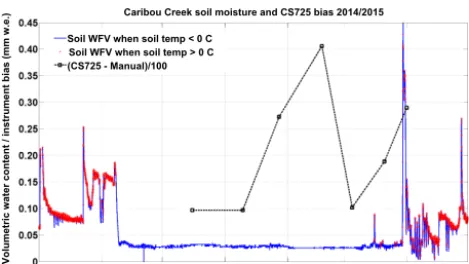
In reaction to an observed offset after the 2013/14 inter-comparison season, soil moisture and temperature probes were installed at the Caribou Creek site with the objective of correlating post-calibration, overwinter and ablation soil moisture changes with sensor offsets. The instruments were installed at three depths: 0–5 cm (vertically), 5 cm (horizon-tally) and 20 cm (horizon(horizon-tally). Unfortunately, the probes only measure liquid water (volumetric water content, or VWC) so the analysis is mostly limited to when the soil tem-peratures (also measured by the probe) are above 0◦C when
we assume that most of the water in the soil is unfrozen. Figure 6 shows the time series of soil moisture near the surface (0–5 cm) along with the difference between the CS725 and manual measurements (scaled by a factor of 100 for visualization) for the 2014/15 season. The red markers indicate when the soil temperature at this level is above 0◦C. It is easy to see from the time series when the liquid soil moisture (near the surface) freezes in late fall, resulting in
2013-10-01 2014-01-01 2014-04-01 2014-07-01-50 -40 -30 -20 -10 0 10 20 30 Sodankyla 2013/2014
Temperature (deg C)
Temperature Instrument bias
2014-10-01 2015-01-01 2015-04-01 2015-07-01
Sodankyla 2014/2015 0 10 20 30 40 50 60 70 80 In st ru m en t bi as ( m m w .e .)
2013-10-01-40 2014-01-01 2014-04-01 -30 -20 -10 0 10 20 30
Caribou Creek 2013/2014
Temperature (deg C)
Temperature Instrument bias
2014-10-01 2015-01-01 2015-04-01
Caribou Creek 2014/2015
-20 -10 0 10 20 30 40 50 In st ru m en t bi as ( m m w .e .)
2013-12-01 2014-03-01 2014-06-01 -20
-10 0 10 20
Fortress Mountain 2013/2014
Temperature (deg C)
-90 -60 -30 0 30 In st ru m en t bi as ( m m w .e .) Temperature Instrument bias
Figure 5. Time series of 1.5 m air temperature (blue, left axis)
and difference between CS725 and manual measurements (red, right axis) at Sodankylä (top) and Caribou Creek (middle) for the 2013/14 (left) and 2014/15 (right) seasons and at Fortress Mountain (bottom) for the 2013/14 season.
shal-Caribou Creek soil moisture and CS725 bias 2014/2015
Soil WFV when soil temp < 0 C Soil WFV when soil temp > 0 C (CS725 - Manual)/100
Volumetric water content / instrument bias (mm w.e.)
Figure 6.Time series of near-surface (0–5 cm) soil moisture
(vol-umetric water content, blue) and the difference between the CS725 and manual measurements (dashed line and black boxes) at Cari-bou Creek for the 2014/15 season. Red markers show where
near-surface soil temperatures are above 0◦C.
low, and meltwater was likely percolating through the snow and into the top layers of the soil.
The freezing of the 0–5 cm depths in early November is preceded by rain–snow events in late October that are rep-resented by the large jump in CS725 SWE shown in Fig. 4 (middle right) and confirmed with snow depth measurements (not shown). During the transition from rain to snow and prior to the surface freezing, Fig. 6 shows fluctuations in near-surface soil moisture (measured by the soil moisture sensor as VWC) related to the precipitation events in late Oc-tober and early November. The soil moisture calibration of the CS725 sensor was entered as a gravimetric water content (GWC) of 0.10, which can be converted to VWC by multi-plying by the specific gravity of the soil (Lambe and Whit-man, 1969). The specific gravity of the loose sand near the surface at Caribou Creek was estimated to be 1.4 based on nearby measurements taken during the BOREAS campaign (Anderson, 2000). The increase in measured VWC from the calibration value to 0.18 (GWC of 0.13) prior to freezing has the potential to create a small but potentially perpetuating offset of up to 3 mm w.e. in the CS725 SWE estimates and may explain at least some of the bias shown by the instru-ment beginning in mid-December.
In addition to the offset in the CS725 SWE measurements that occurs at the beginning of the season, it was anticipated that the rapid increase in the difference between the CS725 and manual SWE at the end of January 2015 could also be attributed to a change in near-surface soil moisture, as this was a time of mid-season snowmelt. However, a change in the liquid soil moisture during the melt period could not be detected by the soil moisture sensors so it is unlikely that the increase in the instrument offset can be attributed to in-filtration of meltwater into the sandy soil. A more plausible explanation is manual measurement errors that could result from attempting to sample a complex snowpack containing ice layers in the pack or at the snow–soil interface. Ice
lay-ers would have formed due to mid-season melt and refreez-ing. The increase in the difference between the manual mea-surement and CS725 in mid- to late March could be a re-sult of snowmelt infiltrating into the top layers of the sandy soil as the soil thaws or forming a basal ice layer (Woo et al., 1982; Lilbaek and Pomeroy, 2008) on top of the soil. A corresponding spike in measured soil moisture during early spring snowmelt is shown in Fig. 6.
3.1.3 Fortress Mountain
The intercomparison of the CS725 instrument and the man-ual SWE measurements made at Fortress Mountain are shown in Fig. 3 (bottom) and summarized in Table 1. Unlike the other two sites, the CS725 and manual SWE measure-ments generally fall on the 1:1 line with no systematic over-estimation (MRB<−5 %). This can also be seen in the time series shown in Fig. 4 (bottom). The slope of the regression line is 0.88 with a small decrease to 0.76 when excluding the ablation period. The intercept is 32.4 mm w.e. increasing to 84.4 mm w.e. when excluding the ablation period. Ther2is comparable to Sodankylä at 0.92 (increasing to 0.94 by ex-cluding the ablation period). It is unfortunate that the sample size is relatively small (n=8) but, regardless, the instrument compares quite well to the manual measurements at this site.
3.2 SSG1000 vs. manual
The regression analysis for the SSG1000 intercomparisons is shown in Fig. 7 with the time series for both seasons shown in Fig. 8. The comparison statistics are in Table 2. This analysis, as for the CS725 above, is organized by site.
3.2.1 Sodankylä
The SSG1000 regression analysis with the manual SWE measurements shown in Fig. 7 (top) and summarized in Ta-ble 2 has anr2for the entire 2014/15 period of 0.99 but is only 0.84 for the 2013/14 period. However, the SWE data from the SSG1000 are not available for the ablation period in 2014/15 due to an instrument malfunction. To have a consis-tent intercomparison for the two seasons, the ablation period (post maximum SWE) was removed from the 2013/14 period and ther2becomes 0.97, very similar to 2014/15. Combin-ing the two seasons, the slope of the regression,β, becomes 0.99 with an offsetεof −7.27 mm w.e. with anr2 of 0.88. The MRB for the two seasons combined is−11 %.
Table 2.Regression coefficients and other statistical measures for the multi-season intercomparison of the SSG1000 with manual SWE at
Sodankylä and Weissfluhjoch (whereβandεare the slope and intercept of the regression line). “Combined” indicates that data from both
seasons are included andnindicates the sample size.
Site Season β ε r2 RMSE Mean relative n
mm w.e. mm w.e. bias %
2013/14 1.05 −15.5 0.84 24.2 −15.1 17
Sodankylä 2014/15 0.92 5.5 0.99 7.9 −2.3 10
Combined 0.99 −7.3 0.88 19.8 −10.8 27
2013/14 0.72 91.7 0.97 55.5 4.2 14
Weissfluhjoch 2014/15 0.82 79.0 0.97 58.6 11.3 17
Combined 0.79 77.2 0.96 57.2 8.1 31
0 50 100 150 200 250 300
0 50 100 150 200 250 300
Manual SWE (mm w.e.)
SSG1000
SWE (mm
w.e.)
SSG1000 vs. manual SWE for Sodankyla 2013/2014 and 2014/2015
SWE Regression
0 100 200 300 400 500 600 700 800 900
0 100 200 300 400 500 600 700 800 900
Manual SWE (mm w.e.)
SSG1000
SWE (mm
w.e.)
SSG1000 vs. manual SWE for Weissfluhjoch 2013/2014 and 2014/2015
SWE Regression
Figure 7.SSG1000 vs. manual SWE at Sodankylä (top) and
Weiss-fluhjoch (bottom) for the 2013/14 and 2014/15 seasons. Black line
is 1:1. Error bars represent manufacturer’s stated sensor accuracy.
water damage to the electronics (an issue later remedied by the manufacturer).
3.2.2 Weissfluhjoch
The regression analysis for the SSG1000 and the manual SWE measurements is shown in Fig. 7 (bottom) with the time series in Fig. 8 (bottom). This alpine site has a much deeper snowpack than either Caribou Creek or Sodankylä but comparable to Fortress Mountain, which unfortunately
2013-10-01 2014-01-01 2014-04-01 2014-07-01 0
50 100 150 200 250 300
SWE (
mm w.
e.)
Sodankyla SWE 2013/2014
2014-10-01 2015-01-01 2015-04-01 2015-07-01 Sodankyla SWE 2014/2015
SSG1000 Manual
2013-10-01 2014-01-01 2014-04-01 2014-07-010 100
200 300 400 500 600 700 800 900
SWE (
mm w.
e.)
Weissfluhjoch SWE 2013/2014
2014-10-01 2015-01-01 2015-04-01 2015-07-01 Weissfluhjoch SWE 2014/2015
SSG1000 Manual
Figure 8.Time series of the SSG1000 SWE sensors and manual
SWE measurements at Sodankylä (top) and Weissfluhjoch (bottom) for the 2013/14 (left) and 2014/15 (right) seasons.
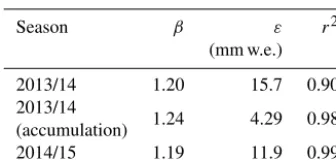
Table 3.Regression coefficients for the multi-season intercompar-ison of the CS725 with the SSG1000 SWE measurements at
So-dankylä (whereβandεare the slope and intercept of the regression
line). “Accumulation” indicates that data occurring after maximum seasonal SWE are omitted from the analysis.
Season β ε r2
(mm w.e.)
2013/14 1.20 15.7 0.90
2013/14
1.24 4.29 0.98
(accumulation)
2014/15 1.19 11.9 0.99
these are perhaps due to issues with the manual sampling of a complex (melting or melting–refreezing) snowpack. When combining the two seasons, the resulting low MRB of 8 % (for combined seasons) is somewhat surprising given the ob-vious outliers. Perhaps the low combined MRB is a reflection of errors in one season compensating the errors in the other season.
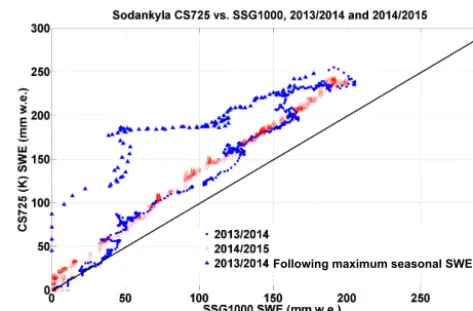
3.3 CS725 vs. SSG1000
The intercomparison with manual measurements for both the CS725 and the SSG1000 suggests that the agreements are the most favourable during accumulation rather than during abla-tion. Figure 7 shows the relationship between the CS725 and the SSG1000 for both seasons at Sodankylä with the 2014/15 season shown in red circles and the 2013/14 season shown in blue dots (changing to blue triangles at the approximate on-set of ablation). The relationship for both years appears to be linear up to the time when maximum SWE is reached. At the onset of ablation, the relationship between the instruments (shown by the blue triangles) deviates substantially from lin-ear. This is confirmed by Table 3, which shows a higherr2
when the 2013/14 ablation period is not included in the anal-ysis. This analysis could only be completed for the 2013/14 season since the sensor data are missing for the 2014/15 ab-lation period due to malfunction.
3.4 Sensor reliability
Data quality control metrics for the CS725 sensors at each of the two SPICE sites demonstrated that the instruments per-formed at a high level of reliability, such that over 95 % of the sensor measurements were usable for intercomparison. No malfunctions were noted and no maintenance was required at any of the sites.
For the SSG1000, data quality control metrics show that the sensors performed reliably during the accumulation peri-ods but malfunctioned at Sodankylä late in the spring of 2014 and again early spring of 2015. At Weissfluhjoch, 99 % of the 1 min data were usable for intercomparison. At Sodankylä, the malfunctions resulted in only 83 and 67 % of the 1 min
data, for the 2013/14 and 2014/15 seasons, respectively, be-ing available for intercomparison. The sensor malfunctions at Sodankylä were determined to be related to water dam-age to the electronics. Other than this, no other malfunctions were reported or maintenance required during the intercom-parison.
4 Discussion
The regression analysis between the CS725 and the manual SWE measurements resulted inr2values ranging from 0.55 to 0.99, depending on site and season. Combined seasonr2
values ranged from 0.90 to 0.92. Although generally lower than the correlations of 0.99 reported for intercomparisons with other instruments by Wright et al. (2011), our corre-lations (averaged by season) are similar to the r2 of 0.83 that they reported for snow tube measurements. The (com-bined season) bias shown here, which was between 30 and 35 %, is substantially higher than the 18 % reported by Cho-quette et al. (2008). The exception to this is the CS725 at Fortress Mountain which has a mean negative bias less than 5 % when compared to the manual measurements. Besides the maximum SWE, the two major differences that Fortress Mountain has from Caribou Creek and Sodankylä are the soil and the topography. Soils at the Fortress Mountain site have higher clay and loam content, overlain with a layer of or-ganics, and generally remain frozen and saturated for the du-ration of the winter. These, combined with the sloping ter-rain and faster meltwater runoff via dter-rainage channels, likely minimizes the change in soil moisture during the transition seasons and thereby minimizes potential offsets in the CS725 measurements. Furthermore, the correlations for the CS725 for Caribou Creek are substantially lower than for Sodankylä and Fortress Mountain. This could be for several reasons. The spatial and seasonal variability are quite high at Cari-bou Creek and the sample size is low. This is especially the case for 2014/15 where sample size is small due to a shorter and more variable winter where melt and refreeze occurred several times over the course of the season (Fig. 5, middle right). Melting and refreezing generally makes the manual SWE measurements more difficult and prone to error, cre-ates basal ice and results in higher spatial variability. Elimi-nating the ablation period improved the comparison statistics for 2013/14 but made the statistics for 2014/15 much worse due to the reduced sample size. Potential sources of error in the CS725 intercomparison are discussed further in the fol-lowing sections.
more significant result at Sodankylä is the smaller MRB as compared to the CS725, which is−2 to−15 % (depending on the exclusion of ablation). The magnitude of the MRB is similar at Weissfluhjoch but the bias here is a positive 8 %. This is surprising considering the many occurrences of neg-ative sensor bias (as seen in Fig. 8, bottom) but these nega-tive outliers are balanced by some large (albeit inconspicu-ous) positive outliers at the end of the ablation periods. The outliers for Sodankylä in Fig. 7 (top) occur during the abla-tion period in late April–May 2014 but it is difficult to as-certain whether the errors are related to the instrument or to the manual measurement. The most likely explanation is that these are related to the occurrence of bridging. Bridg-ing is also suspected as the cause of the pre-ablation out-liers at Weissfluhjoch since the sensor seems to agree quite well with the manual measurements up to mid-March and early April for both seasons. An intercomparison with a col-located snow pillow (not shown here) suggests a similar al-beit smaller negative bias during the same period. Errors as-sociated with bridging are discussed further in this section.
The CS725 and SSG1000 measurements at Sodankylä cor-relate very well with each other showing correlations as high as 0.99 when excluding the ablation periods. The key result here, as shown in Fig. 9, is the deviation from this linear cor-relation at the onset of melt in the 2013/14 season. Although some of this deviation can be blamed on differential melt-ing at the site, we attribute a large portion of the deviation to the different measurement principles of the sensors. At the onset of melt and the ripening of the snowpack, meltwa-ter drains out of the snowpack towards the ground surface. Once reaching the surface, the meltwater can pool and re-freeze (potentially forming a basal layer of ice), runoff from the measurement area or infiltrate into the soil. Due to the flat measurement area and the sandy soil at Sodankylä, runoff is unlikely; therefore the meltwater is either infiltrating into the sandy soil or refreezing at the surface. Either way, the same meltwater is likely draining through and away from the mea-surement plate of the SSG1000 and therefore no longer being measured as SWE in the snowpack. However, this meltwater, whether infiltrated into the top layer of the sandy soil or pool-ing at the surface, is still bepool-ing registered by the CS725 as SWE. This contributes to the overestimation of SWE by the CS725 as compared to the SSG1000 and to the non-linearity of the intercomparison shown in Fig. 9 after ablation. Also, this meltwater is either difficult or impossible to include in a snow tube sample, increasing the bias between the CS725 and the manual measurements.
4.1 Sources of error
There are several possible sources of error that affect both the automated and manual SWE measurements. They are dis-cussed and analyzed for each instrument and method in this section.
Following maximum seasonal SWE
Figure 9.CS725 vs. SSG1000 for the 2013/14 (blue dots/blue
tri-angles) and 2014/15 (red) seasons at Sodankylä. Black line is 1:1.
4.1.1 Soil moisture (CS725)
A potential source of error for the CS725 can arise from a poor pre-snowpack soil moisture calibration or a large post-calibration change in soil moisture prior to the freezing of the ground surface. Overwinter soil moisture changes (Gray et al., 1985) or infiltration of snowmelt water into soils (Gray et al., 2001) could also result in deviation between the manual and CS725 SWE measurements. Since the CS725 calculation of SWE is based on gamma ray counts during wet and dry pe-riods with no snow cover, incorrect measurements or faulty assumptions with respect to the soil moisture calibrations could result in a sensor offset. Furthermore, if soil moisture levels change significantly prior to freeze-up, during win-ter or during ablation, then the SWE estimates derived from the sensor are less reliable. The approximate error associ-ated with an inaccurate gravimetric soil moisture calibration, as provided by the manufacturer, is roughly 10 mm w.e. of SWE for a 0.10 change in GWC. Figure 6 shows an increase in soil moisture at Caribou Creek up to a VWC of 0.18 (GWC of 0.13) prior to freeze-up in the fall of 2014, an increase of 0.03 GWC and approximately 3 mm w.e. The resulting cali-bration offset could explain up to 30 % of the early season difference between the instrument and the manual measure-ment shown in Figs. 4 (middle right) and 5 (middle right). This calibration issue would then perpetuate through the win-ter period and grow with any additional infiltration into the soil beneath the snowpack. It is unfortunate that this same soil moisture and soil temperature data are not available for Sodankylä or for the first season at Caribou Creek as this would have provided some verification for the calibration offset.
ap-proximately 10 mm w.e. for each of the final two intercom-parison points in mid-March and early April. Much of this 20 mm w.e. increase could be explained by a corresponding increase in soil moisture from 0.18 VWC (0.13 GWC; esti-mated at freeze-up) to 0.45 VWC (0.32 GWC; spike at thaw) or approximately 19 mm w.e., assuming that the CS725 is in-terpreting this near-surface soil moisture as SWE.
There is some ambiguity in the soil moisture results be-cause the soil moisture sensors are incapable of measuring moisture content below 0◦C and because this is not the only source of error. However, we think that these soil measure-ments are useful for explaining at least some of the offsets seen between the sensor and the manual SWE measurements, especially during the transition periods. More work is needed on these linkages before a reliable sensor adjustment can be derived.
4.1.2 Ice bridging (SSG1000)
Ice bridging is a known issue affecting SWE measurements that are made by weight, such as snow pillows or the snow scale (e.g. Engeset et al., 2000). Bridging typically occurs when air temperature reaches 0◦C and then cools creating a melt–refreeze crust layer on the snow surface. This layer is very hard and supports the weight of the snow, thus caus-ing an underestimate of measured SWE with further accu-mulation on the surface. Probable bridging situations can be seen in Fig. 7 both at Sodankylä and at Weissfluhjoch. At Sodankylä, in December 2013, March 2014 and February– March 2015, the SWE values measured by the SSG1000 do not increase as quickly as the manual measurements. At the same time, air temperature first goes above 0◦C and then
cools to as low as−30◦C creating perfect conditions for ice
bridging. At Weissfluhjoch, the cause of potential ice bridg-ing is not so obvious, but it is difficult to explain the dif-ferences between manual and SSG1000 measurements oth-erwise. The snowpack was homogeneous (verified with ter-restrial laser scans) and even though a co-located snow pil-low (not shown here) showed some underestimation com-pared to the manual measurements, the underestimation was much smaller than by the SSG1000. However, snow pillows have been found to be less prone to ice bridging issues due to their larger surface area (Beaumont, 1966b; Tollan, 1970). A more comprehensive description of the physical processes that cause measurement errors in SWE pressure sensors can be found in Johnson (2004).
4.1.3 Snow spatial variability
Another potential source of error in this analysis is due to the spatial variability at the intercomparison sites impacting the relative SWE between the sensor and manual measurement locations. At Sodankylä, the maximum distance between the sensors and the manual SWE measurements was 12 m for the CS725 (6 m after the move prior to the 2014/15
sea-son) and 25 m (16 m in 2013/14) for the SSG1000. Unfor-tunately, only 1 SWE measurement is made at the intercom-parison site, but generally the spatial variability is low with snow depth exhibiting a coefficient of variation (COV) un-der 6 % (with a maximum snow depth of just over 80 cm). Therefore, the impact of spatial variability in SWE, even with a 25 m separation, is likely quite small for most of the sea-son. However, both webcam photos and snow depth measure-ments provide evidence that snowmelt rates during ablation vary across the site, largely dependent on exposure. Manual snow depth measurements suggest that spatial differences in the area around the SWE measurements are small and are perhaps as high as 4 cm in April of 2014 and less in mid-April of 2015. These differences obviously account for very little of the late season SWE deviation shown in Fig. 5 (top). This also suggests that the CS725 move prior to the 2014/15 season had a low impact on sensor bias from one season to the next.
Caribou Creek, with maximum snow depths of 56 and 41 cm for the two consecutive seasons, exhibits a much higher spatial variability. Here, COV is about 15 % (19 %) at peak snow depth but increases to 30 % (90 %) during ab-lation for 2013/14 (2014/15). With a full five-point snow course performed here, mean SWE maximum is approxi-mately 125 mm w.e. in 2013/14 and 75 mm w.e. in 2014/15 with COV very similar to those shown for snow depth. The manual measurement used in the intercomparison is made just inside the measurement area of the sensor, approximately 5 m from the centre. Although relatively close, the higher spatial variability could result in a spatial bias, especially during ablation. For example, in 2013/14, we estimate SWE to increase across the sensor measurement area by approxi-mately 10 mm w.e. in late April due to differential melting as a result of exposure. With the manual measurement closer to the lower SWE estimate in the sensor measurement area, up to 25 % of the difference in SWE between the sensor and the manual measurement (as shown in Fig. 5, middle left) could be explained.
The spatial variability is not assessed for Fortress Moun-tain or Weissfluhjoch.
4.1.4 Experiment design
Some aspects of the design of the SWE intercomparison are less than ideal and often were a result of compromise amongst the overall SPICE objectives, site host resources and nationally accepted practices. These compromises poten-tially contribute to some ambiguity of the study results and this commentary could form the basis for recommendations on the design of future SWE sensor intercomparisons.
man-ual SWE measurement and the sensor varied from 5 to 25 m, depending on site, but perhaps more significantly, the varia-tion within the sensor measurement area (especially for the CS725) was not properly assessed. This could certainly have been a factor at Caribou Creek but the intense sampling within the measurement area of the sensor would have caused too much disturbance and impacted sensor measurements. Also, increased frequency (i.e. weekly) of manual measure-ments is desirable especially after significant changes in the snowpack, albeit at the risk of disturbance. In the future, manual observers should pay special attention to the exis-tence of basal ice layers which may have an impact on the overall accuracy of the manual SWE estimate.
Another ideal situation would have been the co-location of both SWE sensor types at each site. This, in combination with soil moisture and temperature sensors within the mea-surement area of the CS725 sensors, would have provided additional information for the assessment of sensor bias. An-other good addition would be the automated and high fre-quency measurement of snow depth within the sensor mea-surement areas to provide an indicator of snow density and melt rates and perhaps an indicator of snow bridging on the weighing SWE sensors.
4.1.5 Manual SWE measurements
As noted above, the manual SWE measurements differed by site, the exception being Caribou Creek and Fortress Mountain that both used the ESC-30 snow tube and bagged and weighed the sample. We will not comment further on possible bias associated with different samplers (Farnes et al., 1983; Goodison et al., 1987), as these are generally small as compared to the differences in the measurements shown in these results. We do, however, want to address possible er-rors associated with the manual measurement of a complex snowpack (i.e. a snowpack with ice layers or during melt), especially with a snow tube.
During the intercomparison, both Caribou Creek and So-dankylä experienced several freeze and thaw cycles over the course of the winter (as seen in Fig. 5 top and middle) but one was especially pronounced at Caribou Creek during mid- to late January 2015 (Fig. 5, middle right). The result of freeze– thaw is usually a “crusty” snowpack with several ice layers. In general, these characteristics make a snowpack difficult to sample with a snow tube as the tube cutters need to cut through multiple ice layers without snow escaping from the bottom of the tube (Powell, 1987; Sturm et al., 2010). It is anticipated that even an expert user will have difficulties ob-taining an accurate sample in these conditions, exacerbated even more by the shallow pack found at Caribou Creek in 2014/15. It is difficult even at the time of the sample to esti-mate measurement error, but it could easily result in a 5–10 % underestimate of SWE. Sturm et al. (2010) reported an average underestimate from a snow tube of 7.1 % as com-pared to layer-integrated snow pit measurements. Although
this may explain some of the bias in the CS725 measure-ments, especially at Caribou Creek, it is countered by the relatively good agreement between the manual and SSG1000 measurements for Sodankylä. However, midwinter melting could also result in basal ice as the meltwater percolates through the snow and refreezes at the surface (providing that the surface is below 0◦C) or in the top layer of the sandy sub-strate. Not only would this ice layer be difficult to measure with a snow tube (which is difficult to cut through and of-ten results in an underestimate), the meltwater may drain off of the SSG1000 measurement surface and be underestimated by that measurement as well. This may partially explain the often (but sometimes inconsistent) increase in sensor bias shown by manual SWE measurements following midwinter freeze–thaw cycles in Fig. 5 (top and middle). Unfortunately, the observer’s notes did not indicate when a basal ice layer was observed so much of this is speculation.
During ablation, measures were taken to sample the snow-pack before it ripened but this could not always be accom-plished due to travel time to the site (especially for Caribou Creek). Because the sample was bagged and weighed rather than weighed in the tube, a wet sample would experience some errors because of the bagging process (liquid water or sticky snow left in the tube) and result in an underestimate of SWE (perhaps 5 % as a rough estimate).
5 Summary and conclusions
Two automated SWE sensors were tested at three WMO-SPICE sites (Sodankylä, Weissfluhjoch and Caribou Creek) and at one additional Canadian site (Fortress Mountain) during the WMO-SPICE intercomparison (northern hemi-spheric) winters of 2013/14 and 2014/15. Instrument mea-surements were compared to periodic manual meamea-surements of SWE at the sites and cross referenced with ancillary mea-surements of air temperature and soil moisture and soil tem-perature (at Caribou Creek) to try to determine causality for some of the bias seen in the intercomparison. The objective was not necessarily to determine which instrument makes the most accurate measurement, but to inform users of potential measurement issues that may influence their data interpreta-tion.
mea-surement due to a more complex snowpack. Correlations at Fortress Mountain are also quite high over the single inter-comparison season (r2=0.92) with a mean negative bias of approximately 5 %, which is more comparable to the results of Wright et al. (2011) in similar conditions. At the two sandy SPICE sites, the agreement between the CS725 and the man-ual SWE measurements are generally better prior to the start of seasonal ablation. We believe this occurs largely because of early spring melt percolating through the snowpack and either forming a basal ice layer or infiltrating into the sandy substrate. Either way, this water is difficult or impossible to measure with a snow tube. However, because this water con-tinues to attenuate the gamma radiation signal detected by the CS725, the sensor still interprets this water as SWE and therefore appears to overestimate as compared to the man-ual measurements. Seasonal ablation has no significant im-pact on the agreement at Fortress Mountain due to saturated frozen soils that restrict infiltration and a mild slope that pro-motes runoff of meltwater from the site.
The SSG1000 at both Sodankylä and Weissfluhjoch com-pared quite well to the manual SWE measurements show-ing mean biases of −11 and 8 % at the respective sites. It did, however, experience some technical issues at Sodankylä early in the 2014/15 snowmelt period which limited the in-tercomparison for that season. The correlations were quite high with the combined seasonr2ranging from 0.88 at So-dankylä to 0.96 at Weissfluhjoch. Many of the outliers in the SSG1000 intercomparisons are most likely due to bridg-ing of the snowpack on the weighbridg-ing plate but we also have to consider errors related to the manual measurements and other processes going on at the snow–soil–sensor interface (as outlined in Johnson, 2004). At Weissfluhjoch, these out-lier events occurred prior to maximum seasonal SWE while at Sodankylä they occurred during ablation. Removing the ablation period in the 2013/14 Sodankylä data resulted in a substantial increase inr2from 0.84 to 0.97.
The SSG1000 correlated very well with the CS725 at So-dankylä during the accumulation period. Although the over-estimation of SWE by the CS725 is quite apparent when compared against the SSG1000, the accumulation periodr2
was 0.98 and 0.99 for the two respective seasons. Intercom-parison of the two sensors clearly shows how the overesti-mation of SWE by the CS725 increases at the onset of ab-lation in March/April of the 2013/14 season. Independent of the manual measurements, this indicates that the deviation of the CS725 from manual SWE during ablation is most likely instrument related and a result of the CS725 misinterpreting the meltwater infiltrated into the sandy soils as SWE.
When comparing SWE instruments to a manual reference, there are several considerations that must be made that ulti-mately impact the interpretation of the results. We know that the manual measurements of SWE are not free of error. Ex-perience proves that making a snow tube bulk density sample in a snowpack containing ice layers or during melt is difficult and inherently prone to errors. We also have to consider the
spatial variability of the snow that we are sampling as the CS725 (and the SSG1000 to a lesser degree) have a much larger measurement area than the manual point sample. Tak-ing this and the technical capabilities of the instruments into consideration, both sensors have high correlations (generally higher than 0.90, Caribou Creek being the exception) with the manual reference measurements. We have identified that the SSG1000 has had some technical issues during snowmelt but are satisfied that these issues can be overcome with some installation modifications. The SSG1000 may also underes-timate SWE on occasion due to bridging so users need to be aware of this potential error. We have identified the potential for the CS725 measurements to be misinterpreted, especially when deployed over sandy soils and during melting condi-tions. Although more verification work is required on the im-pact of soil moisture change on the CS725 bias, aggregating subsurface moisture in the SWE estimate could potentially be useful from a hydrological perspective as it ultimately impacts the amount of water available for runoff. Neverthe-less, it is recommended to co-locate the CS725 with ancillary measurements of soil moisture, soil temperature and snow depth to guide the user in interpreting the data.
6 Data availability
Much of the data used in this analysis were collected during the SPICE project on behalf of the WMO Commission for In-struments and Methods of Observations (CIMO). At the time of publication, the SPICE final report remains in progress and the project data protocol limits data availability until the final report is released, at which time the data can be obtained by contacting the corresponding author.
Acknowledgement. We wish to thank the WSL Institute for Snow and Avalanche Research SLF for kindly providing the SSG1000 and manual SWE measurements from Weissfluhjoch as well as the countless other contributors to SPICE who helped to make the project a success. We would like to express our appreciation for the effort that the reviewers and the special issue editor provided to help us improve this paper with a special thanks to Charles Fierz (WSL-SLF, Davos), who provided a very thorough review with substantial and helpful feedback.
Edited by: S. Morin
Reviewed by: C. Fierz and two anonymous referees
within the scope of the present work and does not constitute a com-mercial endorsement of any instrument or instrument manufacturer by the authors or the WMO.
References
Anderson, D. W.: BOREAS TE-01 SSA Soil Lab Data, from Oak Ridge National Laboratory Distributed Active Archive Cen-ter, Oak Ridge, Tennessee, USA, doi:10.3334/ORNLDAAC/530, available at: http://www.daac.ornl.gov, last access: September 2016, 2000.
Barnett, T. P., Adam, J. C., and Lettenmaier, D. P.: Potential impacts of a warming climate on water availability in snow dominated regions, Nature, 438, 303–309, 2005.
Bartlett, P. A., MacKay, M. D., and Verseghy, D. L.: Modified snow algorithms in the Canadian Land Surface Scheme: Model runs and sensitivity analysis at three boreal forest stands, Atmos. Ocean, 44, 207–222, 2006.
Barry, R. G.: Observing systems and data sets related to the cryosphere in Canada: A contribution to planning for the Global Climate Observing System, Atmos. Ocean, 33, 771–807, 1995. Beaumont, R. T.: Mt. Hood pressure pillow snow gage, J. Appl.
Meteorol., 4, 626–631, 1965.
Beaumont, R. T.: Snow accumulation, in: Proceedings of the 34th Annual Western Snow Conference, April 1966, Seattle, Wash-ington, 3–6, 1966a.
Beaumont, R. T.: Evaluation of the Mt. Hood pressure pillow snow gage and application to forecasting avalanche hazard, IASH Pub-lications no. 69, 341–349, 1966b.
Brown, R. D., Walker, A. E., and Goodison, B.: Seasonal snow cover monitoring in Canada: an assessment of Canadian con-tributions for global climate monitoring, in: 57th Eastern Snow Conference, Syracuse, New York, USA, 17–19 May 2000, 131– 141, 2000.
Choquette Y., Lavigne, P., Nadeau, M., Ducharme, P., Martin, J. P., Houdayer, A., and Rogoza, J.: GMON, a new sensor for snow water equivalent via gamma monitoring, Proceedings Whistler 2008 International Snow Science Workshop, 21–27 September 2008, Whistler, B.C., 2008.
Derksen, C., Walker, A., and Goodison, B.: Evaluation of passive microwave snow water equivalent retrievals across the boreal for-est/tundra transition of western Canada, Remote Sens. Environ., 96, 315–327, 2005.
Engeset, R., Sorteberg, H., and Udnaes, H.: Snow pillows: Use and verification, in: Snow Engineering: Recent Advances and Developments. Proceedings of the Fourth International Confer-ence on Snow Engineering, Trondheim, Norway, 19–21 June 2000, edited by: Hjorth-Hansen, E., HOLAND, I., Loset, S., and Norem, H., AA Balkema, Rotterdam, Netherlands, 45–51, 2000. Farnes, P. F., Goodison, B. E., Peterson, N. R., and Richards, R. P.: Metrication of manual snow sampling equipment, Final report Western Snow Conference, 19–21 April 1983, Spokane, Wash-ington, 106 pp., 1983.
Goodison, B. E. and Walker, A. E.: Canadian development and use of snow cover information from passive microwave satellite data, in: Passive Microwave Remote Sensing of Land-Atmosphere In-teractions, edited by: Choudhury, B. J., Kerr, Y. H., Njoku, E. G., and Pampaloni, P., Utrecht, The Netherlands, 245–262, 1995.
Goodison, B. E., Glynn, J. E., Harvey, K. D., and Slater, J. E.: Snow surveying in Canada: A perspective, Can. Water Resour. J., 12, 27–42, doi:10.4296/cwrj1202027, 1987.
Gray, D. M., Granger, R. J., and Dyck, G. E.: Overwinter soil mois-ture changes, Transactions of the ASAE, 28, 442–447, 1985. Gray, D. M., Toth, B., Zhao, L., Pomeroy, J. W., and Granger, R. J.:
Estimating areal snowmelt infiltration into frozen soils, Hydrol. Process., 15, 3095–3111, 2001.
Harding, R. J.: Exchanges of energy and mass associated with melt-ing snowpack, in: Modellmelt-ing Snowmelt-Induced Processes, Proc. of the Budapest Symposium, IAHS Press, Institute of Hydrology, Wallingford, UK, IAHS Publications No. 155, 3–15, 1986. Johnson, J. B.: A theory of pressure sensor performance in snow,
Hydrol. Process., 18, 53–64, doi:10.1002/hyp.1310, 2004. Johnson, J. B., Gelvin, A., and Schaefer, G.: An engineering design
study of electronic snow water equivalent sensor performance,
Proc. 75t hWestern Snow Conf., 23–30, 2007.
Johnson, J. B., Gelvin, A. B., Duvoy, P., Schaefer, G. L., Poole, G., and Horton, G. D.: Performance characteristics of a new elec-tronic snow water equivalent sensor in different climates, Hydrol. Process., 29, 1418–1433, doi:10.1002/hyp.10211, 2015. Jonas, T., Marty, C., and Magnusson, J.: Estimating the snow water
equivalent from snow depth measurements in the Swiss Alps, J. Hydrol., 378, 161–167, doi:10.1016/j.jhydrol.2009.09.021, 2009.
Kinar, N. J. and Pomeroy, J. W.: Determining snow water equiv-alent by acoustic sounding, Hydrol. Process., 21, 2623–2640, doi:10.1002/hyp.6793, 2007.
Kinar, N. J. and Pomeroy, J. W.: SAS2: the system for acoustic sensing of snow, Hydrol. Process., 29, 4032–4050, doi:10.1002/hyp.10535, 2015a.
Kinar, N. J. and Pomeroy, J. W.: Measurements of the physi-cal properties of the snowpack, Rev. Geophys., 53, 481–544, doi:10.1002/2015RG000481, 2015b.
Kodama, M., Nakai, K., Kawasaki, S., and Wada, M.: An applica-tion of cosmic-ray neutron measurements to the determinaapplica-tion of the snow-water equivalent, J. Hydrol., 41, 85–92, 1979. Kuusisto, E.: Snow accumulation and snowmelt in Finland,
Na-tional Board of Waters, Helsinki, Finland, Publications of the Water Research Institute No. 55, 149 pp., 1984.
Lambe, W. T. and Whitman, R. V.: Description of an Assemblage of Particles, Soil Mechanics, 1st Edn., John Wiley & Sons, Inc., Chapter 3, 553 pp., 1969.
Laukkanen, A.: Short term inflow forecasting in the Nordic power market, Master thesis, Physics and Mathematics, Helsinki Uni-versity of Technology, Helsinki, 60 pp., 2004.
Lilbaek, G. and Pomeroy, J. W.: Ion enrichment of snowmelt runoff water caused by basal ice formation, Hydrol. Process., 22, 2758– 2766, 2008.
Martin, J. P., Houdayer, A., Lebel, C., Choquette, Y., Lavigne, P., and Ducharme, P.: An unattended gamma monitor for the de-termination of snow water equivalent (SWE) using the natural ground gamma radiation, in: 2008 IEEE Nuclear Science Sym-posium Conference Record, Dresden, Germany, 19–25 October 2008, 983–988, doi:10.1109/NSSMIC.2008.4774560, 2008. Nitu, R., Rasmussen, R., Baker, B., Lanzinger, E., Joe, P., Yang,
of instruments and methods for the measurement of solid precipitation and snow on the ground: organization of the experiment, WMO Technical Conference on meteorological and environmental instruments and methods of observations, Brussels, Belgium, 16–18 October 2012, 10 pp., available
at: http://www.wmo.int/pages/prog/www/IMOP/publications/
IOM-109_TECO-2012/Session1/O1_01_Nitu_SPICE.pdf last
access: 5 January 2017, 2012.
Pomeroy, J. W. and Gray, D. M.: Snowcover accumulation, reloca-tion, and management, National Water Research Institute, Saska-toon, Canada, National Hydrology Research Institute Science Report No. 7, 144 pp., 1995.
Powell, D.: Observations on consistency and reliability of field data in snow survey measurements, presented at: 55th Annual Meet-ing Western Snow Conference, Vancouver, B.C., 14–16 April 1987, 69–77, 1987.
Rasmussen, R., Baker, B., Kochendorfer, J., Meyers, T., Landolt, S., Fischer A. P., Black, J., Thériault, J. M., Kucera, P., Gochis, D., Smith, C., Nitu, R., Hall, M., Ikeda, K., and Gutmann, E.: How well are we measuring snow: The NOAA/FAA/NCAR win-ter precipitation test bed, B. Am. Meteorol. Soc., 93, 811–829, 2012.
Serreze, M. C., Clark, M. P., Armstrong, R. L., McGinnis, D. A., and Pulwarty, R. S.: Characteristics of the western United States snowpack from snowpack telemetry (SNOTEL) data, Water Re-sour. Res., 35, 2145–2160, 1999.
Stranden, H. B. and Grønsten, H. A.: Filefjell Snow Research Sta-tion, Evaluation of recorded data for snow seasons 2009/2010 and 2010/2011 (English Summary), Norwegian water resources-and energy directorate, Oslo, Report No. 23/2011, 27 pp., 2011. Sturm, M., Taras, B., Liston, G. E., Derksen, C., Jonas, T., and
Lea, J.: Estimating Snow Water Equivalent Using Snow Depth Data and Climate Classes, J. Hydrometeorol., 11, 1380–1394, doi:10.1175/2010JHM1202.1, 2010.
Takala, M., Luojus, K., Pulliainen, J., Derksen, C., Lemmetyinen, J., Kärnä, J.-P., and Koskinen, J.: Estimating northern hemisphere snow water equivalent for climate research through assimilation of space-borne radiometer data and ground-based measurements, Remote Sens. Environ., 115, 3517–3529, 2011.
Tollan, A.: Experiences with snow pillows in Norway, Interna-tional Association of Scientific Hydrology, Bulletin, 15, 113– 120, 1970.
WMO (World Meteorological Organization): Guide to hydrological practices, Volume 1: Hydrology – From measurements to hydro-logical information, 6th Edn., WMO, Geneva, WMO-No. 168, 296 pp., 2008.
Woo, M., Heron, R., and Marsh, P.: Basal ice in high Arctic snow-packs, Arctic Alpine Res., 14, 251–260, 1982.