M E T H O D O L O G Y
Open Access
Risk score modeling of multiple gene to gene
interactions using aggregated-multifactor
dimensionality reduction
Hongying Dai
1*, Richard J Charnigo
3, Mara L Becker
2, J Steven Leeder
2and Alison A Motsinger-Reif
4* Correspondence:[email protected] 1
Research Development and Clinical Investigation, Children’s Mercy Hospital, Kansas City, MO 64108, USA
Full list of author information is available at the end of the article
Abstract
Background:Multifactor Dimensionality Reduction (MDR) has been widely applied to detect gene-gene (GxG) interactions associated with complex diseases. Existing MDR methods summarize disease risk by a dichotomous predisposing model (high-risk/low-risk) from one optimal GxG interaction, which does not take the accumulated effects from multiple GxG interactions into account.
Results:We propose an Aggregated-Multifactor Dimensionality Reduction (A-MDR) method that exhaustively searches for and detects significant GxG interactions to generate an epistasis enriched gene network. An aggregated epistasis enriched risk score, which takes into account multiple GxG interactions simultaneously, replaces thedichotomouspredisposing risk variable and provides higher resolution in the quantification of disease susceptibility. We evaluate this new A-MDR approach in a broad range of simulations. Also, we present the results of an application of the A-MDR method to a data set derived from Juvenile Idiopathic Arthritis patients treated with methotrexate (MTX) that revealed several GxG interactions in the folate pathway that were associated with treatment response. The epistasis enriched risk score that pooled information from 82 significant GxG interactions distinguished MTX responders from non-responders with 82% accuracy.
Conclusions:The proposed A-MDR is innovative in the MDR framework to investigate aggregated effects among GxG interactions. New measures (pOR, pRR and pChi) are proposed to detect multiple GxG interactions.
Keywords:A-MDR, Epistasis enriched risk score, Epistasis enriched gene network, pRR, pOR, pChi
Background
Human diseases usually have complex inheritance patterns, and single nucleotide poly-morphisms (SNPs) has been utilized to explain the variation in susceptibility to many common complex diseases as well as the response to drug therapy. The advancement of genotyping technology has made genotypic data readily accessible to investigators at low cost. However, many challenges remain with regard to identifying genes that ren-der people susceptible to non-Mendelian disorren-ders and in unren-derstanding the associa-tions and functional relaassocia-tionships among genes. More and more, researchers have been advocating for advanced statistical analysis to quantify complex and interactive bio-logical and genetic relationships [1,2].
Multifactor Dimensionality Reduction (MDR) is a statistical paradigm for characterizing and detecting nonlinear complex gene-to-gene interactions (epistasis) possibly associated with susceptibility to disease [3]. When numerous genes are involved in a complex canon-ical pathway or network, traditional approaches for data analysis, such as a Chi-square test or Fisher’s exact test, might not detect the associations between risk factors and outcomes since these approaches assess only marginal main effects of the identified risk factors. Al-though one can employ logistic regression or other standard multivariate categorical data analysis approaches to explore interactions among SNPs, there are an enormous number of possible interactions in a model with both linear and nonlinear effects. Consequently, stand-ard multivariate categorical data analysis approaches might detect very few interactions, and even then the cost in terms of sample size might be immense. MDR addresses these difficul-ties by converting high-dimensional genotypic data into a single predictive variable. Geno-typic combinations are used to define high risk and low risk strata for the one-dimensional predisposing risk factor. MDR can reveal non-linear epistasis at a moderate sample size with no requirements on the underlying distributions of genotypes or outcomes [4].
The most commonly used MDR approach is described in detail by Ritchie et al. [3]. To distinguish this method from its various extensions, we will refer to it as the original MDR method. Related statistical software has been developed by Hahn et al. [4], Bush et al. [5], Winham and Motsinger-Reif [6], and Moore and colleagues (www.epistasis.org). In general, the MDR process can also be combined with a filter preprocess step by first applying global testing and filtration techniques to select the optimal number of SNPs for MDR analysis by searching for a subset of genes likely to interact with other genes using the ReliefF filtering process [7,8].
Details of the MDR [3] are briefly described here. MDR performs an exhaustive search of all variables and variable combinations to identify univariate or multivariate disease risk models. For each locus or multi-locus combination, attribute construction is performed to make a single variable with two categories: high risk and low-risk. A genotype or combin-ation of genotypes is assigned high risk status if the ratio of affected subjects to unaffected subjects exceeds a pre-determined threshold, and low-risk otherwise. This step consolidates the high-dimensional risk space into a one-dimensional predictive variable. Typically, a 5-fold or 10- 5-fold cross-validation procedure is employed, beginning with the random division of the original data set into five or ten subsets of approximately equal sizes [9]. For 10-fold cross-validation, a model is fit using nine of the ten subsets (collectively referred to as train-ing data), and then the model is applied to classify observations in both the traintrain-ing data and the tenth subset not used to fit the model (referred to as validation data). This entire process is repeated ten times, with one of the ten subsets acting as the validation data [10]. The model’s training accuracy and testing accuracy are defined as the percentage of correct classifications in the corresponding data sets. The optimal one-locus, two-locus, and three-locus MDR models with the highest testing accuracy are identified. A one-three-locus model esti-mates the main effect of each SNP, while multi-locus models investigate the interactions among relevant SNPs. The cross validation consistency (CVC) is the number of times in a 10-fold cross validation that a particular multifactorial combination is identified as an opti-mal model for the training data. Finally, statistical significance of the optiopti-mal models is assessed by 1000- or 10000-count permutation testing [11].
and rheumatoid arthritis [15,16]. Several extensions of the MDR method have been pro-posed. These methods entail the use of odds ratios [17], log-linear methods [18], general-ized linear models [19], methods for data highly imbalanced with the disease outcome [20], model-based methods [21], contingency table measures of classification accuracy [22] and familial data [23,24].
In the present work, we propose an Aggregated-Multifactor Dimensionality Reduction (A-MDR) method that exhaustively searches for statistically significant gene-gene (GxG) interactions to generate a gene interaction network. In particular, an epistasis enriched risk score replaces the traditionaldichotomouspredisposing risk factor in quantifying the degree of susceptibility to a disease. We also introduce and compare new GxG interaction measures (pOR, pRR and pChi). An adjustment for multiple comparisons is implemented to limit false positive discoveries. In the current study we introduce the new approach, evaluate its performance in a range of simulations, and apply it to a real dataset from Ju-venile Idiopathic Arthritis patients treated with methotrexate (MTX).
Method
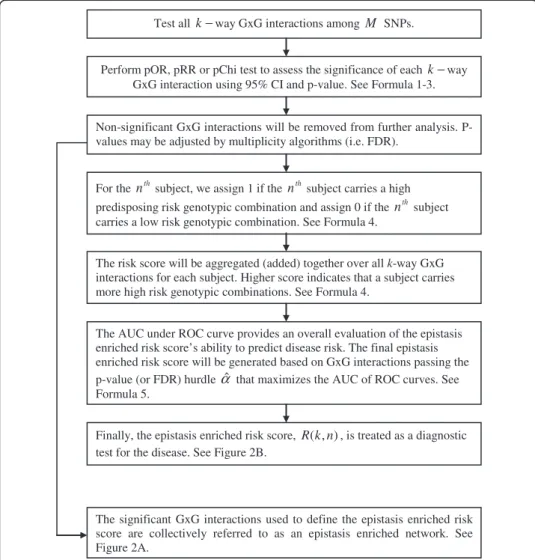
The A-MDR method proposed herein can be applied to detect interactions among alleles, genotypes, and other categorical explanatory variables. Without loss of generality, we present the A-MDR method for SNPs with three common states (0 - homozygous refer-ence, 1 - heterozygous, 2 - homozygous variant). The steps of the A-MDR are outlined in Figure 1.
Detect multiple GxG interactions using the pOR, pRR or pChi test
The starting point for the A-MDR method is the construction of a predisposing risk factor. Suppose we want to investigatek–way GxG interactions amongMSNPs. For one particulark–way GxG interaction, there are 3k(SNP(1)= 0, 1, 2 ×SNP(2)= 0, 1, 2 ×⋯×
SNP(k)= 0, 1, 2) different genotypic combinations. Denote these 3k genotypic
combina-tions asCijwherej= 1, 2,⋯, 3kstands for different genotypic combinations within one
k–way GxG interaction. We need another subscripti¼1;2;⋯; M
k to cover allk–way GxG interactions amongMSNPs. LetXijandYijbe the numbers of affected (Test) and
un-affected (Control) subjects in the jthgenotypic combination of theith k–way GxG
inter-action. Let pi0 ¼ X3k
j¼1
Xij
! = X3
k
j¼1
Xijþ
X3k
j¼1
Yij
!
∈ð0;1Þ be the threshold for disease
risk above which a person is deemed highly susceptible using a Naïve Bayes clas-sifier [25]. Genotypic combinations are then classified into high-risk predisposing risk groups and low-risk predisposing risk groups, n11,n12,n21,n22, in Table 1
where I{·} denotes an indicator function.
We propose to perform one of the following measures to assess theithk–way GxG inter-action (the subscriptiis omitted forn’s ande’s):
(a) the predisposing odds ratio (pOR),
pORi¼ n11n22= n12n21
ð Þ
F1
0 ðF nð 11n22=ðn12n21ÞÞÞ
(b) the predisposing relative risk (pRR),
pRRi¼
n11=ðn11þn12Þ
n21=ðn21þn22Þ
F1 0 F n
11=ðn11þn12Þ
n21=ðn21þn22Þ
; ð2Þ
and
(c) the predisposing chi-square (pChi) test statistic,
Test all k−way GxG interactions among M SNPs.
Perform pOR, pRR or pChi test to assess the significance of each k−way GxG interaction using 95% CI and p-value. See Formula 1-3.
The significant GxG interactions used to define the epistasis enriched risk score are collectively referred to as an epistasis enriched network. See Figure 2A.
For the nthsubject, we assign 1 if the nthsubject carries a high
predisposing risk genotypic combination and assign 0 if the nthsubject carries a low risk genotypic combination. See Formula 4.
The risk score will be aggregated (added) together over all k-way GxG interactions for each subject. Higher score indicates that a subject carries more high risk genotypic combinations. See Formula 4.
The AUC under ROC curve provides an overall evaluation of the epistasis enriched risk score’s ability to predict disease risk. The final epistasis enriched risk score will be generated based on GxG interactions passing the p-value (or FDR) hurdle αˆ that maximizes the AUC of ROC curves. See Formula 5.
Non-significant GxG interactions will be removed from further analysis. P-values may be adjusted by multiplicity algorithms (i.e. FDR).
Finally, the epistasis enriched risk score, R(k,n), is treated as a diagnostic test for the disease. See Figure 2B.
Figure 1Flow chart of Aggregated-Multifactor Dimensionality Reduction (A-MDR).
Table 1 2x2 Predisposing risk table (Subscriptiis omitted forn’s.)
Case Control Total
High Predisposing Risk
n11¼
X3k
j¼1
XijI Xij XijþYij>pi0
n12¼
X3k
j¼1
YijI Xij XijþYij>pi0
n1+
Low Predisposing Risk
n21¼
X3k
j¼1
XijI Xij XijþYij≤pi0
n22¼
X3k
j¼1
YijI Xij XijþYij≤pi0
n2+
pChii¼
X2
s¼1
X2
t¼1
nstest
ð Þ2
est
F1 0 F
X2
s¼1
X2
t¼1
nstest
ð Þ2
est
!; ð3Þ
where est¼nsþNnþt is the expected number of subjects in predisposing risk stratum s (1 = high predisposing risk, 2 = low predisposing risk) and disease stratum t(1 = Case, 2 = Control) under a null hypothesis of no association between the predisposing risk fac-tor and the disease. Details ofFandF0, along with permutation tests and 95% confidence
intervals for pOR, pRR and pChi are inAppendix I.
Aggregate high risk from significant GxG interactions into risk scores
Assume a study investigates a total of Nsubjects. For thenth(n= 1, 2,⋯,N) subject, an aggregatedk–way epistasis enriched risk score,R(k,n), is defined by
R kð ;nÞ ¼ X M k
i¼1
I Pvaluef i<α^g
X3k
j¼1
I n∈Cij
I Xij= XijþYij
>pi0
" #
8 > > > > < > > > > :
ð4Þ
^
α¼ arg max
0≤α≤0:05 AUC
α
j g f
ð5Þ
In equation (4), we use the indicator variable, I Pvaluef i<^αg, to remove theith non-significant GxG interaction from further calculation of risk scores. For the remaining significant GxG interactions, the indicator function, I{n ∈ Cij}I{Xij/(Xij + Yij) > pi0},
assigns 1 if thenthsubject carries a high predisposing risk genotypic combination and 0 if the nthsubject carries a low predisposing risk genotypic combination. More specific-ally,I{Xij/(Xij+Yij) >pi0} indicates whether thejthgenotypic combination has high
pre-disposing risk and I{n ∈ Cij} checks whether the nth subject carries the jth genotypic
combination. Each subject’s risk scores are then summed over all 3kgenotypic combina-tions and allk–way GxG interactions to obtain an aggregatedk–way epistasis enriched risk score,R(k,n), for thenthsubject.
Finally, the epistasis enriched risk score, R(k,n), is treated as a diagnostic test for the disease. One can consider adding up the predisposing scores with p < 0.05 from these interactions. Our experience has been that, in many cases,α=0.05 is an arbitrary cutoff for p-values and some GxG interactions with p-value < 0.05 might have low predictive ability. Therefore, a receiver operating characteristic (ROC) curve is constructed, and the area under the ROC curve (AUC) provides an overall evaluation of the epistasis enriched risk score’s ability to predict disease susceptibility. Instead of using an arbi-trary cutoff α=0.05, we propose to select ^α that maximizes the AUC of ROC curves. Choosing ^α¼ arg max
0≤α≤0:05
AUCj gα
f for α^≤0:05 may help focusing on a modest number
Construct multiple GxG interactions into an epistasis enriched network
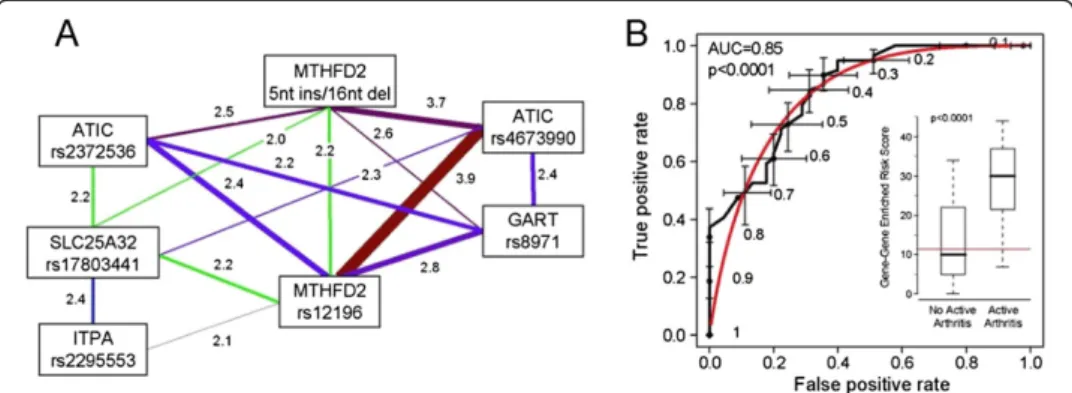
The significant GxG interactions used to define the epistasis enriched risk score are collectively referred to as an epistasis enriched network (Figure 2A). Genes involved in one or more significant interactions appear as nodes in a radial graph. Pairs of genes shar-ing significant interactions are connected by lines. Each line is labeled with the corre-sponding pOR, and the line thickness may be chosen to accentuate the strongest pORs.
In summary, the A-MDR method has not only replaced the dichotomous predispos-ing risk factor with a continuous predictive variable,R(k,n), but has done so by integrat-ing numerous significant GxG interactions into an epistasis enriched network that may more adequately explain the susceptibility to complex diseases. Epistasis enriched risk scores may also be accumulated over GxG interactions from multiple dimensions. For instance, we can accumulate both two-way and three-way GxG interactions. Or further consider accumulating one way main effects and up to k–way GxG interactions. The feasibility of these extensions needs to be assessed by future studies.
Empirical assessment
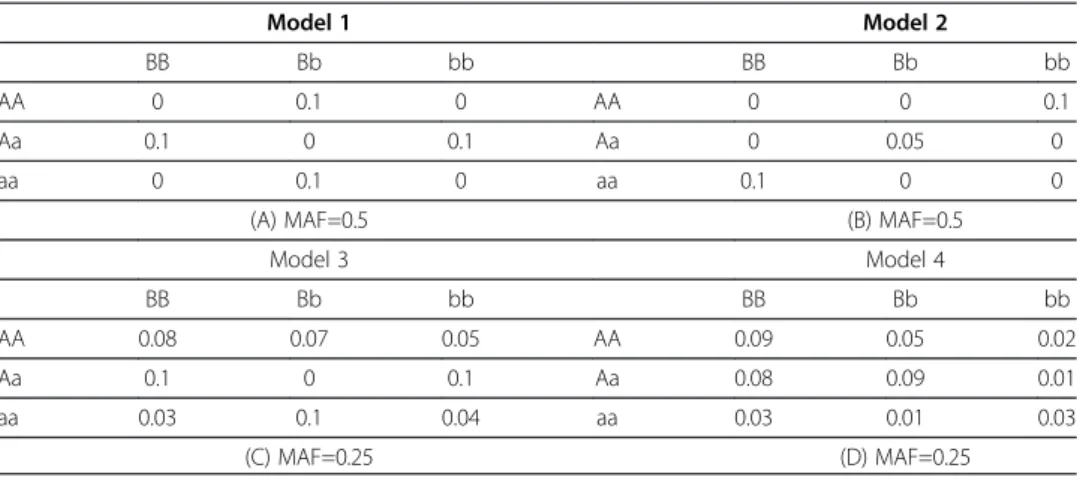
Extensive Monte Carlo simulations were performed to assess the performance of pOR, pRR and pChi and compare them to the original MDR in unrelated case– control studies. To avoid subjective selections of models in favor of our methods, we report the power and type I error simulation similar to the models previously assessed by [26]. In each model, we simulated five SNPs with common homozygote (AA), heterozygote (Aa) and rare homozygote (aa). The minor allele frequencies (MAF) in each model were set to be 0.5 and 0.25 respectively and the genotypes were generated according to proportional expectations under Hardy-Weinberg equilibrium and linkage equilibrium. Equal numbers of affected and unaffected sub-jects were generated based on penetrance functions given in Table 2. Let D=1
indi-cate the onset of disease and l1,l2...,l5 stand for five loci, Pl1×l2 and Pl4×l5 be
penetrance functions from loci 1x2 and loci 4x5 respectively as listed in Table 2. Our simulations comprised three major scenarios:
A) Existence of only one two-way interaction in loci 1x2 associated with disease susceptibility while the remaining loci were unrelated to the outcome variable, i.e. P(D= 1|l1,l2) =pl1 ×l2.
B) Genetic heterogeneity models where a proportion of affected subjects are linked with interactions between loci 1 and 2 and the rest of affected subjects are linked with interactions between loci 4 and 5, i.e.
PðD¼1;C lj1;l2;l4;l5Þ ¼PðD¼1jl1;l2;l4;l5;C¼0Þ P Cð ¼0Þ
þPðD¼1jl1;l2;l4;l5;C¼1Þ PðC¼1Þ ¼PðD¼1jl1;l2Þ P Cð ¼0Þ þP Dð ¼1jl4;l5Þ P Cð ¼1Þ ¼γ1pl1l2þγ2pl4l5
whereγ1≥0,γ2≥0 andγ1+γ2=1. The latent binary variableClabels the source of genetic
vari-ation whereC=0 indicates that disease is related to loci 1x2 with P(C=0)=γ1andC=1
indi-cates that disease is related to loci 4x5 withP(C=1)=γ2. In this study, we consider balanced
genetic heterogeneity models withγ1=γ2=0.5 and unbalanced genetic heterogeneity models
withγ1=0.7 andγ2=0.3.
C) Additive models with two pairs of loci jointly contributing to disease susceptibility. Let Dl1×l2=1 denote the onset of disease due to the penetrancePl1×l2from loci 1*2 andDl4×l5=1 due to the penetrancePl4×l5from loci 4*5. The susceptibility function is given by
P Dð ¼1jl1;l2;l4;l5Þ ¼PððDl1xl2¼1Þ [ðDl4xl5¼1Þjl1;l2;l4;l5Þ ¼PðDl1xl2¼1jl1;l2;l4;l5Þ
þPðDl4xl5¼1jl1;l2;l4;l5Þ PððDl1xl2¼1Þ \ðDl4xl5¼1Þjl1;l2;l4;l5Þ
¼PðDl1xl2¼1jl1;l2Þ þPðDl4xl5¼1jl4;l5Þ PðDl1xl2¼1jl1;l2Þ
PðDl4xl5¼1jl4;l5Þ ¼pl1l2þpl4l5pl1l2pl4l5
To assess the power of the A-MDR method, we randomly generated 100 sets of data in the above described scenarios and performed the MDR and A-MDR tests for each random sample. The power is the percentage of rejection of null hypothesis for the loci with a GxG interaction. Type I error is the percentage of rejection of null hypothesis when the simulated loci have no GxG interaction.
Table 2 Simulated gene-gene interaction models with varying penetrance functions and minor allele frequencies
Model 1 Model 2
BB Bb bb BB Bb bb
AA 0 0.1 0 AA 0 0 0.1
Aa 0.1 0 0.1 Aa 0 0.05 0
aa 0 0.1 0 aa 0.1 0 0
(A) MAF=0.5 (B) MAF=0.5
Model 3 Model 4
BB Bb bb BB Bb bb
AA 0.08 0.07 0.05 AA 0.09 0.05 0.02
Aa 0.1 0 0.1 Aa 0.08 0.09 0.01
aa 0.03 0.1 0.04 aa 0.03 0.01 0.03
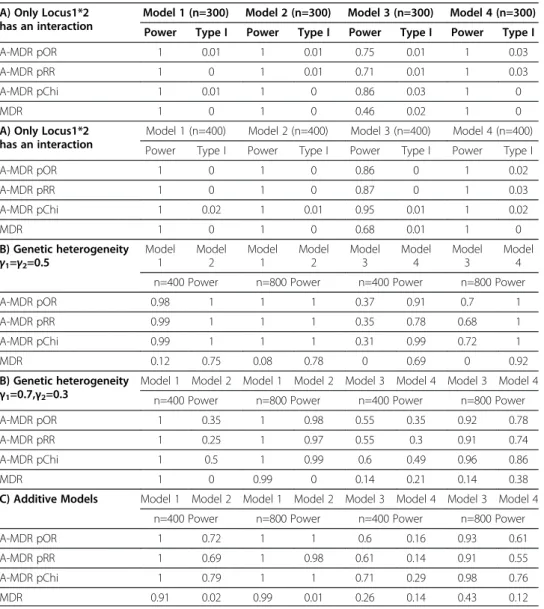
As shown in Table 3, the Type I errors of all tests were under the nominal rate of 5%. When only loci 1 and 2 had an interaction (Table 3A), all five measures had strong power to detect GxG interactions in most models except that the power of MDR dropped to 0.46 in model 3 with n=300, which could be enhanced by increasing sample size. We next simulated genetic heterogeneity (Table 3B) with 0.5/0.5, 0.7/0.3 proportions of subjects affected by a mixture model of epistasis from loci 1x2 and loci 4*5. We noticed that MDR lost power to detect interactions with weaker effects. The power was not recovered with increased sample sizes. We last examined the additive models (Table 3C) where susceptibility increases jointly through loci 1x2 and loci 4x5. MDR has low power to detect both pairs of GxG interactions. All this evidence suggests that the proposed A-MDR might be a better choice for detecting complex GxG interactions, especially when multiple GxG interactions are cumulatively contributing to a phenotype.
Table 3 Power and type I error assessment
A) Only Locus1*2 has an interaction
Model 1 (n=300) Model 2 (n=300) Model 3 (n=300) Model 4 (n=300)
Power Type I Power Type I Power Type I Power Type I
A-MDR pOR 1 0.01 1 0.01 0.75 0.01 1 0.03
A-MDR pRR 1 0 1 0.01 0.71 0.01 1 0.03
A-MDR pChi 1 0.01 1 0 0.86 0.03 1 0
MDR 1 0 1 0 0.46 0.02 1 0
A) Only Locus1*2 has an interaction
Model 1 (n=400) Model 2 (n=400) Model 3 (n=400) Model 4 (n=400)
Power Type I Power Type I Power Type I Power Type I
A-MDR pOR 1 0 1 0 0.86 0 1 0.02
A-MDR pRR 1 0 1 0 0.87 0 1 0.03
A-MDR pChi 1 0.02 1 0.01 0.95 0.01 1 0.02
MDR 1 0 1 0 0.68 0.01 1 0
B) Genetic heterogeneity γ1=γ2=0.5
Model 1
Model 2
Model 1
Model 2
Model 3
Model 4
Model 3
Model 4
n=400 Power n=800 Power n=400 Power n=800 Power
A-MDR pOR 0.98 1 1 1 0.37 0.91 0.7 1
A-MDR pRR 0.99 1 1 1 0.35 0.78 0.68 1
A-MDR pChi 0.99 1 1 1 0.31 0.99 0.72 1
MDR 0.12 0.75 0.08 0.78 0 0.69 0 0.92
B) Genetic heterogeneity
γ1=0.7,γ2=0.3
Model 1 Model 2 Model 1 Model 2 Model 3 Model 4 Model 3 Model 4
n=400 Power n=800 Power n=400 Power n=800 Power
A-MDR pOR 1 0.35 1 0.98 0.55 0.35 0.92 0.78
A-MDR pRR 1 0.25 1 0.97 0.55 0.3 0.91 0.74
A-MDR pChi 1 0.5 1 0.99 0.6 0.49 0.96 0.86
MDR 1 0 0.99 0 0.14 0.21 0.14 0.38
C) Additive Models Model 1 Model 2 Model 1 Model 2 Model 3 Model 4 Model 3 Model 4
n=400 Power n=800 Power n=400 Power n=800 Power
A-MDR pOR 1 0.72 1 1 0.6 0.16 0.93 0.61
A-MDR pRR 1 0.69 1 0.98 0.61 0.14 0.91 0.55
A-MDR pChi 1 0.79 1 1 0.71 0.29 0.98 0.76
MDR 0.91 0.02 0.99 0.01 0.26 0.14 0.43 0.12
Application to genotyping data
Juvenile Idiopathic Arthritis (JIA) is one of the most common chronic diseases of child-hood, affecting an estimated 300,000 children in the U.S. alone, and is an important cause of morbidity and disability in children. Although methotrexate (MTX) is the most commonly used second-line anti-inflammatory agent used to treat JIA worldwide, this antifolate prodrug has shown considerable inter-individual variability in clinical re-sponse and adverse reactions. Thus far, variables investigated as potential useful predic-tors of response and toxicity in patients taking MTX, which is used alone and as an “anchor drug” for many rheumatic conditions, have not been clearly associated with outcomes. The effect of individual genetic SNP variation within the folate pathway upon MTX response has been investigated in several studies in adult rheumatoid arth-ritis (RA) and a few studies in JIA with conflicting results. To elucidate the genetic architecture impacting the efficacy of MTX, 34 SNPs from 19 folate pathway genes were measured in 104 subjects. Response-defined as the absence of active arthritis (swelling not due to bony enlargement or, if no swelling was present, limitation of mo-tion accompanied by either pain on momo-tion or tenderness, not due to trauma or explained by prior joint damage [27]-was determined for these subjects. Information pertaining to the 34 SNPs is listed in Table 4; demographic and clinical characteristics of the subjects were described by Becker and colleagues [15]. After being on a stable dose and route of MTX for at least 3 months, 56.7% of the patients (59 out of 104) still had at least 1 active (i.e., swollen or tender) joint. The presence of active arthritis was the outcome variable, and represented an incomplete response to MTX. By definition, the absence of active arthritis-no joint involvement-was considered a positive response to MTX treatment.
Standard logistic regression analysis did not identify significant main effects from SNPs or GxG interactions. This could primarily due to the complex and non-linear interactions among SNPs. For the rest article, the A-MDR and original MDR methods were applied to the MTX data to search for genetic predictors of response to MTX. Redundant SNPs and SNPs with no prediction of the phenotype were removed by the ReliefF algorithm [7]. A complete set of 34 SNPs and 7 filtered SNPs were analyzed respectively.
The original MDR analysis method was applied to obtain the one-locus, two-locus, and three-locus models with the highest validation accuracy in the original MDR. Two-locus interactions between genes ATICand MTHFD2were significant in testing accur-acy but not in CVC. The prediction accuraccur-acy from the optimal MDR model was 75%.
Another goal of our A-MDR analysis was to integrate numerous significant GxG interactions into a continuous epistasis enriched risk score for the prediction of which patients would have active arthritis despite MTX treatment. A higher epistasis enriched risk score would indicate that a patient carried more high-risk genotypic combinations in loci with significant GxG interactions, and vice versa. To compare prediction accur-acies based on the number of candidate SNPs as well as the presence or absence of ad-justment for multiple comparisons, we generated epistasis enriched risk scores from 82 significant GxG interactions from 34 SNPs (Figure 2B).
Subjects with persistent active arthritis had significantly higher mean and median epistasis enriched risk scores compared to subjects without active arthritis (p < 0.0001). When 82 GxG interactions from 34 SNPs with unadjusted p-values < 0.0167 were used to generate epistasis enriched risk scores (Figure 2B boxplot inset), these scores ranged from 0 to 44. A higher risk score suggests that a subject is less likely to respond favor-ably to MTX treatment. The ROC curve assessing the overall ability of the epistasis enriched risk score to distinguish between subjects with active joints and subjects with-out active joints had 85% area under the curve (p < 0.0001). (The 0.0167 cutoff for un-adjusted p-values was chosen to maximize this area.) We correctly classify 82% of the subjects if we predict that those with epistasis enriched risk scores above 11.5 have active joints and that those with epistasis enriched risk scores below 11.5 do not have persistent joint involvement.
Examination of the five genes in the 15-interaction model presented in Figure 2A reveals a testable hypothesis for future studies. All genes fall within a pathway leading to purine biosynthesis and adenosine formation:SLC25A32transports folates from the cytoplasm to mitochondria; MTHFD2is a component of the mitochondrial folate path-way that produces one-carbon donors in the form of formate (10-formyl-tetrahydrofo-late) exclusively to support de novo purine biosynthesis; and ITPA, ATIC, and GART are involved in purine biosynthesis. Thus, all genes map to a core pathway associated Table 4 List of 34 SNPs from 18 candidate genes in the folate pathway
Gene RS# Gene RS#
ABCG2 rs7699188 GGH rs3758149
−15846A>C rs11545078
rs35252139 ITPA rs2295553
rs35229708 MTHFD1 rs2236225
rs55930652 MTHFD2 5nt ins/16nt del
ADORA2a rs2298383 rs56168672
rs3761422 rs12196
rs2267076 MTHFR rs1801133
rs2236624 rs1801131
ATIC rs2372536 rs2274976
rs12995526 MTR rs1805087
rs4673990 MTRR rs1801394
BHMT rs3733890 SHMT-1 rs1979277
DHFR 19 bp deletion SLC25A32 rs17803441
rs7387 SLCO1B1 Rs4149056
GART rs8971 SLC19A1 rs1051266
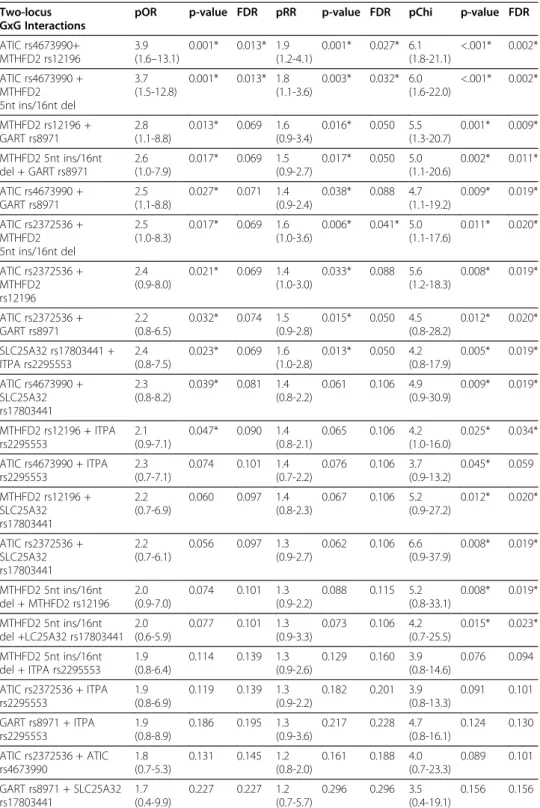
Table 5 Two-locus GxG interactions among 7 SNPs assessed by A-MDR
Two-locus GxG Interactions
pOR p-value FDR pRR p-value FDR pChi p-value FDR
ATIC rs4673990+ MTHFD2 rs12196
3.9 (1.6–13.1)
0.001* 0.013* 1.9 (1.2-4.1)
0.001* 0.027* 6.1 (1.8-21.1)
<.001* 0.002*
ATIC rs4673990 + MTHFD2 5nt ins/16nt del
3.7 (1.5-12.8)
0.001* 0.013* 1.8 (1.1-3.6)
0.003* 0.032* 6.0 (1.6-22.0)
<.001* 0.002*
MTHFD2 rs12196 + GART rs8971
2.8 (1.1-8.8)
0.013* 0.069 1.6 (0.9-3.4)
0.016* 0.050 5.5 (1.3-20.7)
0.001* 0.009*
MTHFD2 5nt ins/16nt del + GART rs8971
2.6 (1.0-7.9)
0.017* 0.069 1.5 (0.9-2.7)
0.017* 0.050 5.0 (1.1-20.6)
0.002* 0.011*
ATIC rs4673990 + GART rs8971
2.5 (1.1-8.8)
0.027* 0.071 1.4 (0.9-2.4)
0.038* 0.088 4.7 (1.1-19.2)
0.009* 0.019*
ATIC rs2372536 + MTHFD2 5nt ins/16nt del
2.5 (1.0-8.3)
0.017* 0.069 1.6 (1.0-3.6)
0.006* 0.041* 5.0 (1.1-17.6)
0.011* 0.020*
ATIC rs2372536 + MTHFD2 rs12196
2.4 (0.9-8.0)
0.021* 0.069 1.4 (1.0-3.0)
0.033* 0.088 5.6 (1.2-18.3)
0.008* 0.019*
ATIC rs2372536 + GART rs8971
2.2 (0.8-6.5)
0.032* 0.074 1.5 (0.9-2.8)
0.015* 0.050 4.5 (0.8-28.2)
0.012* 0.020*
SLC25A32 rs17803441 + ITPA rs2295553
2.4 (0.8-7.5)
0.023* 0.069 1.6 (1.0-2.8)
0.013* 0.050 4.2 (0.8-17.9)
0.005* 0.019*
ATIC rs4673990 + SLC25A32 rs17803441
2.3 (0.8-8.2)
0.039* 0.081 1.4 (0.8-2.2)
0.061 0.106 4.9 (0.9-30.9)
0.009* 0.019*
MTHFD2 rs12196 + ITPA rs2295553
2.1 (0.9-7.1)
0.047* 0.090 1.4 (0.8-2.1)
0.065 0.106 4.2 (1.0-16.0)
0.025* 0.034*
ATIC rs4673990 + ITPA rs2295553
2.3 (0.7-7.1)
0.074 0.101 1.4 (0.7-2.2)
0.076 0.106 3.7 (0.9-13.2)
0.045* 0.059
MTHFD2 rs12196 + SLC25A32 rs17803441
2.2 (0.7-6.9)
0.060 0.097 1.4 (0.8-2.3)
0.067 0.106 5.2 (0.9-27.2)
0.012* 0.020*
ATIC rs2372536 + SLC25A32 rs17803441
2.2 (0.7-6.1)
0.056 0.097 1.3 (0.9-2.7)
0.062 0.106 6.6 (0.9-37.9)
0.008* 0.019*
MTHFD2 5nt ins/16nt del + MTHFD2 rs12196
2.0 (0.9-7.0)
0.074 0.101 1.3 (0.9-2.2)
0.088 0.115 5.2 (0.8-33.1)
0.008* 0.019*
MTHFD2 5nt ins/16nt del +LC25A32 rs17803441
2.0 (0.6-5.9)
0.077 0.101 1.3 (0.9-3.3)
0.073 0.106 4.2 (0.7-25.5)
0.015* 0.023*
MTHFD2 5nt ins/16nt del + ITPA rs2295553
1.9 (0.8-6.4)
0.114 0.139 1.3 (0.9-2.6)
0.129 0.160 3.9 (0.8-14.6)
0.076 0.094
ATIC rs2372536 + ITPA rs2295553
1.9 (0.8-6.9)
0.119 0.139 1.3 (0.9-2.2)
0.182 0.201 3.9 (0.8-13.3)
0.091 0.101
GART rs8971 + ITPA rs2295553
1.9 (0.8-8.9)
0.186 0.195 1.3 (0.9-3.6)
0.217 0.228 4.7 (0.8-16.1)
0.124 0.130
ATIC rs2372536 + ATIC rs4673990
1.8 (0.7-5.3)
0.131 0.145 1.2 (0.8-2.0)
0.161 0.188 4.0 (0.7-23.3)
0.089 0.101
GART rs8971 + SLC25A32 rs17803441
1.7 (0.4-9.9)
0.227 0.227 1.2 (0.7-5.7)
0.296 0.296 3.5 (0.4-19.1)
0.156 0.156
with adenosine accumulation, which is considered to be a mechanism of action of MTX that contributes to response in JIA and Rheumatoid Arthritis.
Discussion
In this work, we have proposed an Aggregated Multifactor Dimensionality Reduction (A-MDR) model to elucidate complex and non-linear genetic associations contributing to disease risk and variability in response to treatment. The proposed method is innovative in three important ways: 1) a continuous GxG enriched risk score is generated to replace the dichotomous risk factor in prediction of susceptibility to disorders; 2) new measures of gene-gene interaction using pOR, pRR, and pChi along with p-values and confidence inter-vals are proposed to detect and characterizemultiplegene-gene interactions; and, 3) a radial network is generated to depict patterns of epistasis. This approach allows for prediction on not just a single interactive model, which is important given the growing appreciation in human genetics for the accumulative impact of a large number of variants with low effect size [28]. By pooling moderate and inter-related genetic contributors together, the A-MDR model becomes robust and predictive of complex traits. In addition to GxG interactions, the A-MDR can also be applied to model gene-environment interactions where environ-mental risk factors such as smoking, alcohol consumption, exercise, and diet can be incor-porated into multi-factorial models.
The original MDR model selects an optimal multi-factorial (SNP) combination for each two-way, three-way or higher order interaction. When multiple genes function together in a pathway, the original MDR is prone to overlook genes with weaker signals and lose power for selecting one optimal GxG interaction in cross-validation. For the MTX data, the optimal two-locus interaction detected by the original MDR among 7 candidate SNPs was ATIC (rs4673990) + MTHFD2 (rs12196) with testing accuracy of 0.73 (p=0.0005). However, there exist other pairs of interactions with comparable accuracy. As a result, CVC, which measures the percentage of times that an optimal GxG interaction is selected when splitting the training and validation sets randomly, was not significant (CVC=8/10, p=0.2700). Our A-MDR analysis in Table 5 identified 15 pairs of two-locus interactions. When multiple GxG interactions withbio-equivalenteffects are involved in epistasis, the original MDR will select an optimal model, by chance and lose some of the real pathway-based signals. The recent extended MDR methods, including OR-MDR [17], LM-MDR [18] and G-MDR [19], adopt the same strategy of selecting one optimal GxG interaction as does the original MDR, which means they have the same limitations.
A continuous GxG enriched risk score is another major distinction between A-MDR and all the majority of existing MDR models, in which a binary risk factor is utilized to predict the outcome variable. ForM-way interactions, the existing MDR models classify~3M geno-typic combinations as either high-risk or low-risk. A-MDR evolves from the traditional MDR outputs to the predisposing risk scores and epistasis based network as shown in Figure 2.
We explore a radial network (Figure 2A) to depict patterns of epistasis. From the sys-tems biology perspective, genetic variants might jointly impact the disease susceptibility and response to treatment. The gene-gene interaction network reveals intriguing informa-tion when interpreted in the context of what we know about the folate pathway and the effect that MTX has upon the disruption of this pathway as it relates to arthritis. ATIC and MTHFD2 were the two genes with the strongest interaction, and it is of interest to note that the genes included in the model (Figure 2A) include a transporter involved in folate uptake into mitochondria, SLC25A32, and the bifunctional methylenetetrahydrofo-late dehydrogenase-cyclohydrolase MTHFD2, a key constituent of the mitochondrial fol-ate pathway. The mitochondrial folfol-ate pathway is responsible for the generation of formate (in the form of 10-formylTHF) specifically to support purine biosynthesis, repre-sented by ATIC, GART, and ITPA. The anti-inflammatory effect of low-dose MTX used to treat JIA and RA is thought to be due the anti-inflammatory effects of adenosine, formed as a consequence of the inhibitory effects of MTX on amino-imidazole carboxa-mide ribonucleotide (AICAR) transformylase (gene name,ATIC), which promotes the ac-cumulation of AICAR ribotide, inhibiting adenosine deaminase and leading to a build up of adenosine, a potent anti-inflammatory agent [30]. A disruption of this process may re-sult in a decreased anti-inflammatory effect of the drug. Therefore, the combined effect of SNPs inATICandMTHFD2may indeed yield a more clinically apparent result by altering the anti-inflammatory effects of methotrexate. There is a potential to apply the proposed method to GWAS study by dissecting SNPs into pathways in order to detect GxG interac-tions in GWAS pathways. The major computational challenges from the proposed A-MDR and other approach in MDR framework are in the generation of p-values for MDR. MDR permutation computing time is largely dependent on the dimension of data sets. In other words, the computing time increases as the number of SNPs and/or the number of subjects increases. Several works have been devoted to improve the efficiency and shorten the computing time in MDR analysis in high-throughput data [5,31,32]. We will defer interested readers to the corresponding citations for computing issues in high-throughput MDR analysis. These computational limitations make our strategy appropriate in large scale candidate gene studies, but may be limited in application to genome-wide association studies until further improvements in computing speed are realized or very large-scale computing resources are available.
In summary, bioinformatics challenges remain in detecting and modeling epistasis in complex biological traits. We have developed a new A-MDR framework to interpret com-plex genetic variation and have proposed predicting an outcome using a continuous risk factor. Several other extensions and modifications of the original MDR have been pro-posed in the literature. Incorporation of valuable features from other MDR extension models into the A-MDR framework is worth further investigation. Prospective studies and validation in independent samples are needed to assess reliability of the A-MDR model’s predictive ability. Tools for statistical inference, including asymptotic distributions of the proposed test statistics, need to be developed to save computing time and improve reliability.
Appendix
Since the predisposing risk factor (Table 1) is conditioned on the naïve Bayes classi-fier, standard inference procedures based on normal or chi-square asymptotic distribu-tions with 1 degree of freedom do not apply to the numerators in (1)-(3), which are the unadjusted odds ratio (OR), relative risk (RR) and Chi-square statistics (Chi). As a result, 95% confidence intervals of OR and RR are often greater than 1 under H0. To
address this issue, we propose pOR, pRR and pChi by taking the null distribution of unadjusted statistics into account. Let x=pOR,pRR, orpChi,F(x) be the cumulative dis-tribution function of the corresponding statistic under the alterative hypothesis (GxG interaction present) F0(x),be the cumulative distribution function of the corresponding
statistic under the null hypothesis (GxG interaction absent) and F0− 1(x) be the inverse
function ofF0(x). The corrected pOR, pRR and pChi are then defined byF1x
0 ðF xð ÞÞ. Under H0,F(x)=F0(x), so pOR, pRR and pChi should equalF1x
0 ðF xð ÞÞ¼ x F1
0 ðF0ð ÞxÞ¼1. This adjust-ment will ensure the insignificant GxG interactions to have 95% confidence interactions cross 1 under Under H0. In this work, we evaluated pOR, pRR and pChi using a full
data set while these methods can also be evaluated under the cross validation scheme typically used in MDR.
The functions F(x) and F0(x) can be estimated by the corresponding empirical
distri-bution function. Permutation is applied to estimateF0(x) by reshuffling the relationship
between SNPs and a phenotype, where SNPs for each individual in a system are main-tained as a vector to preserve their correlation structure. For each permutation, we gen-erated odds ratio (OR), relative risk (RR) and chi-square test statistic (Chi). Jackknife re-sampling was applied to estimate F(x) by generating random subsets of data, where 80% to 90% of subjects were randomly selected. SNPs and the phenotype from each subject are maintained as a vector to preserve the association between SNPs and the phenotype. Denote the OR, RR and Chi statistic from permutation or re-sampling as
x1,x2,. . .xBwhereB is the number of permutation or resampling. The null distribution
functionF0(x) andF(x) can be estimated byB1
XB
i¼1Ifxi≤xg. The 95% confidence
inter-val pOR, pRR and pChi can be obtained by resampling. Denote the pOR, pRR and pChi statistics from resampling or permutation as z1,z2. . .,zBthen the 95% confidence
inter-val pOR, pRR and pChi is the interinter-val from 2.5 to 97.5 percentile of z1,z2. . .,zB from
resampling. The p-value for pOR, pRR and pChi for the ith GxG interaction, denoted
by Pvaluei, will be calculated by the permutation testing, i.e. Pvaluei¼B1
XB
i¼1Ifz<zig
where z1,z2. . .,zBare calculated from permutation samples andz is the pOR, pRR and
pChi statistic calculated from the current data.
Competing interests
There are no competing interests to this work.
Authors’contributions
HD conceived of the study. RC and AMR aided in study design and statistical method. HD performed the simulations and data analysis. MB and SL performed the clinical data collection, genotyping and interpretation of case study findings. All authors contributed to the manuscript writing. All authors read and approved the final manuscript.
Acknowledgements
This work is supported for collaboration between HD and AMR by Bursary Award of the 1stShort Course on Statistical Genetics and Genomics from University of Alabama at Birmingham from the National Institute of Health
Author details
1
Research Development and Clinical Investigation, Children’s Mercy Hospital, Kansas City, MO 64108, USA.2Division of Clinical Pharmacology and Medical Toxicology, Department of Pediatrics, Children’s Mercy Hospital, Kansas City, MO 64108, USA.3Department of Statistics, University of Kentucky, Lexington, KY 40506, USA.4Bioinformatics Research Center, Department of Statistics, North Carolina State University, Raleigh, NC 27695, USA.
Received: 4 September 2012 Accepted: 21 December 2012 Published: 8 January 2013
References
1. Moore JH:Detecting, characterizing, and interpreting nonlinear gene-gene interactions using multifactor dimensionality reduction.Adv Genet2010,72:101–116.
2. Cantor RM, Lange K, Sinsheimer JS:Prioritizing GWAS results: a review of statistical methods and recommendations for their application.Am J Hum Genet2009,86(1):6–22.
3. Ritchie MD, Hahn LW, Roodi N, Bailey LR, Dupont WD, Parl FF, Moore JH:Multifactor-dimensionality reduction reveals high-order interactions among estrogen-metabolism genes in sporadic breast cancer.Am J Hum
Genet2001,69(1):138–147.
4. Hahn LW, Ritchie MD, Moore JH:Multifactor dimensionality reduction software for detecting gene-gene and gene-environment interactions.Bioinformatics2003,19(3):376–382.
5. Bush WS, Dudek SM, Ritchie MD:Parallel multifactor dimensionality reduction: a tool for the large-scale analysis of gene-gene interactions.Bioinformatics2006,22(17):2173–2174.
6. Winham SJ, Motsinger-Reif AA:An R package implementation of multifactor dimensionality reduction.BioData Min2011,4(1):24.
7. Robnik-Siknja M, Kononeko I:Theoretical and empirical analysis of RelifF and RReliefF.Mach Learn2003,53:23–69. 8. Dai H, Bhandary M, Becker ML, Leeder SJ, Gaedigk R, Motsinger-Reif AA:Global tests of p-values for multifactor dimensionality reduction models in selection of optimal number of target genes.BioData Min2012,5(1):3. 9. Motsinger AA, Ritchie MD:The effect of reduction in cross-validation intervals on the performance of
multifactor dimensionality reduction.Genet Epidemiol2006,30(6):546–555.
10. Hastie T, Tibshirani R, Friedman J:The Elements of Statistical Learning: Data Mining, Inference, and Predication. New York, USA: Springer; 2001.
11. Good P:Permutation Tests: A Practical Guide to Resampling Methods for Testing Hypotheses. New York, USA: Springer; 2000.
12. Moore JH, Williams SM:New strategies for identifying gene-gene interactions in hypertension.Ann Med2002, 34(2):88–95.
13. Andrew AS, Karagas MR, Nelson HH, Guarrera S, Polidoro S, Gamberini S, Sacerdote C, Moore JH, Kelsey KT, Demidenko E,et al:DNA repair polymorphisms modify bladder cancer risk: a multi-factor analytic strategy.
Hum Hered2008,65(2):105–118.
14. Cho YM, Ritchie MD, Moore JH, Park JY, Lee KU, Shin HD, Lee HK, Park KS:Multifactor-dimensionality reduction shows a two-locus interaction associated with Type 2 diabetes mellitus.Diabetologia2004,47(3):549–554. 15. Becker ML, Gaedigk R, van Haandel L, Thomas B, Lasky A, Hoeltzel M, Dai H, Stobaugh J, Leeder JS:The effect of
genotype on methotrexate polyglutamate variability in juvenile idiopathic arthritis and association with drug response.Arthritis Rheum2011,63(1):276–285.
16. Dervieux T, Wessels JA, van der Straaten T, Penrod N, Moore JH, Guchelaar HJ, Kremer JM:Gene-gene interactions in folate and adenosine biosynthesis pathways affect methotrexate efficacy and tolerability in rheumatoid arthritis.Pharmacogenet Genomics2009,19(12):935–944.
17. Chung Y, Lee SY, Elston RC, Park T:Odds ratio based multifactor-dimensionality reduction method for detecting gene-gene interactions.Bioinformatics (Oxford England)2007,23(1):71–76.
18. Lee SY, Chung Y, Elston RC, Kim Y, Park T:Log-linear model-based multifactor dimensionality reduction method to detect gene gene interactions.Bioinformatics (Oxford England)2007,23(19):2589–2595. 19. Lou XY, Chen GB, Yan L, Ma JZ, Zhu J, Elston RC, Li MD:A generalized combinatorial approach for detecting
gene-by-gene and gene-by-environment interactions with application to nicotine dependence.Am J Hum
Genet2007,80(6):1125–1137.
20. Velez DR, White BC, Motsinger AA, Bush WS, Ritchie MD, Williams SM, Moore JH:A balanced accuracy function for epistasis modeling in imbalanced datasets using multifactor dimensionality reduction.Genet Epidemiol
2007,31(4):306–315.
21. Calle ML, Urrea V, Vellalta G, Malats N, Steen KV:Improving strategies for detecting genetic patterns of disease susceptibility in association studies.Stat Med2008,27(30):6532–6546.
22. Bush WS, Edwards TL, Dudek SM, McKinney BA, Ritchie MD:Alternative contingency table measures improve the power and detection of multifactor dimensionality reduction.BMC Bioinformatics2008,9:238. 23. Lou XY, Chen GB, Yan L, Ma JZ, Mangold JE, Zhu J, Elston RC, Li MD:A combinatorial approach to detecting
gene-gene and gene-environment interactions in family studies.Am J Hum Genet2008,83(4):457–467. 24. Mei H, Cuccaro ML, Martin ER:Multifactor dimensionality reduction-phenomics: a novel method to capture
genetic heterogeneity with use of phenotypic variables.Am J Hum Genet2007,81(6):1251–1261.
25. Moore JH, Gilbert JC, Tsai CT, Chiang FT, Holden T, Barney N, White BC:A flexible computational framework for detecting, characterizing, and interpreting statistical patterns of epistasis in genetic studies of human disease susceptibility.J Theor Biol2006,241(2):252–261.
26. Ritchie MD, Hahn LW, Moore JH:Power of multifactor dimensionality reduction for detecting gene-gene interactions in the presence of genotyping error, missing data, phenocopy, and genetic heterogeneity.
Genet Epidemiol2003,24(2):150–157.
28. Yang J, Manolio TA, Pasquale LR, Boerwinkle E, Caporaso N, Cunningham JM, de Andrade M, Feenstra B, Feingold E, Hayes MG,et al:Genome partitioning of genetic variation for complex traits using common SNPs.Nat Genet
2011,43(6):519–525.
29. Ritchie MD, Edwards TL, Fanelli TJ, Motsinger AA:Genetic heterogeneity is not as threatening as you might think.Genet Epidemiol2007,31(7):797–800.
30. Cronstein BN, Naime D, Ostad E:The antiinflammatory mechanism of methotrexate. Increased adenosine release at inflamed sites diminishes leukocyte accumulation in an in vivo model of inflammation.J Clin Invest
1993,92(6):2675–2682.
31. Oki NO, Motsinger-Reif AA:Multifactor dimensionality reduction as a filter-based approach for genome wide association studies.Front Genet2011,2:80.
32. Yang C, Wan X, He Z, Yang Q, Xue H, Yu W:The choice of null distributions for detecting gene-gene interactions in genome-wide association studies.BMC Bioinformatics2011,12(Suppl 1):S26.
doi:10.1186/1756-0381-6-1
Cite this article as:Daiet al.:Risk score modeling of multiple gene to gene interactions using aggregated-multifactor dimensionality reduction.BioData Mining20136:1.
Submit your next manuscript to BioMed Central and take full advantage of:
• Convenient online submission
• Thorough peer review
• No space constraints or color figure charges
• Immediate publication on acceptance
• Inclusion in PubMed, CAS, Scopus and Google Scholar
• Research which is freely available for redistribution